safety.viz v1.11.3: the Safety Histogram, labelled
A patch with two display changes to the Safety Histogram. Its charts now say what their axes and bars show. Clicking a bar lists the visit of each record. No value, bin or count changes.
Before this release the histogram's axes had no titles, and with one participant selected nothing said when each record was taken. This release titles the single-measure chart's axes, as the original safety-histogram did, gives each bar's count on hover on the small panels, and adds a Visit column to the bar listing. Each pair below is the same view in release 1.11.2 and in this release.
Both axes are titled
The x-axis names the measure and its unit. The y-axis says what each bar counts.
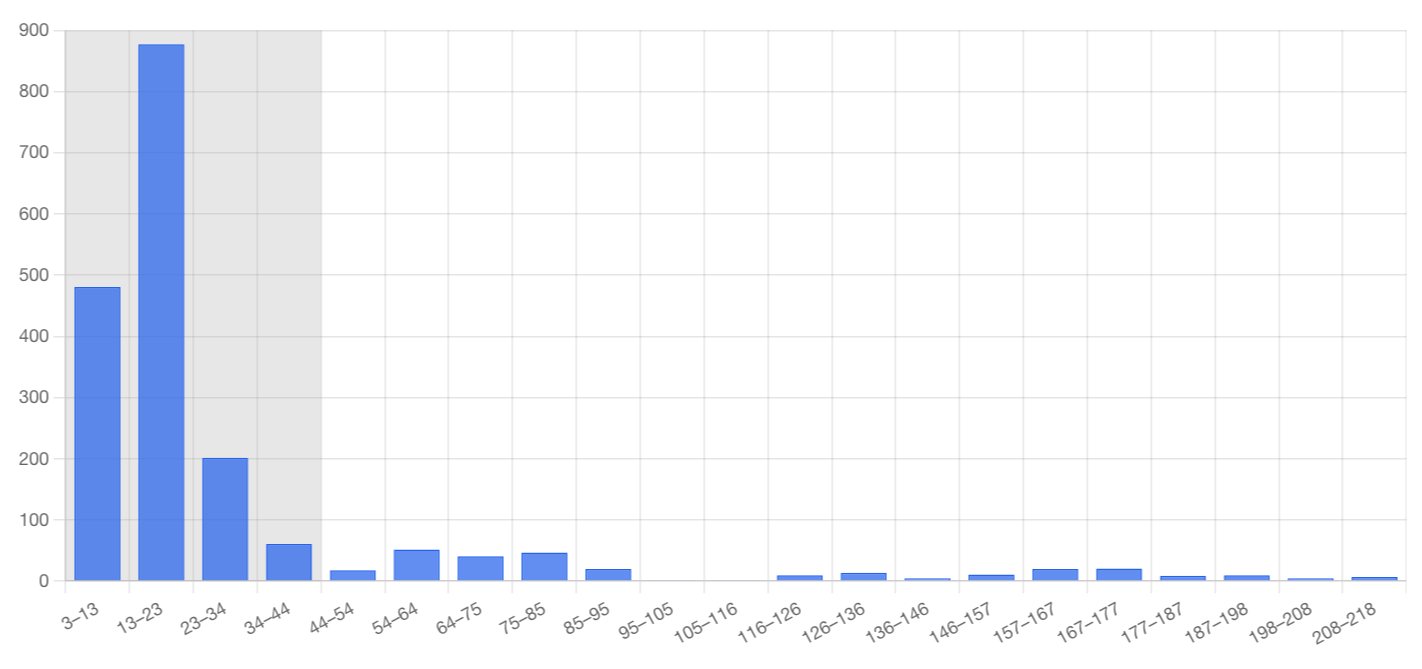
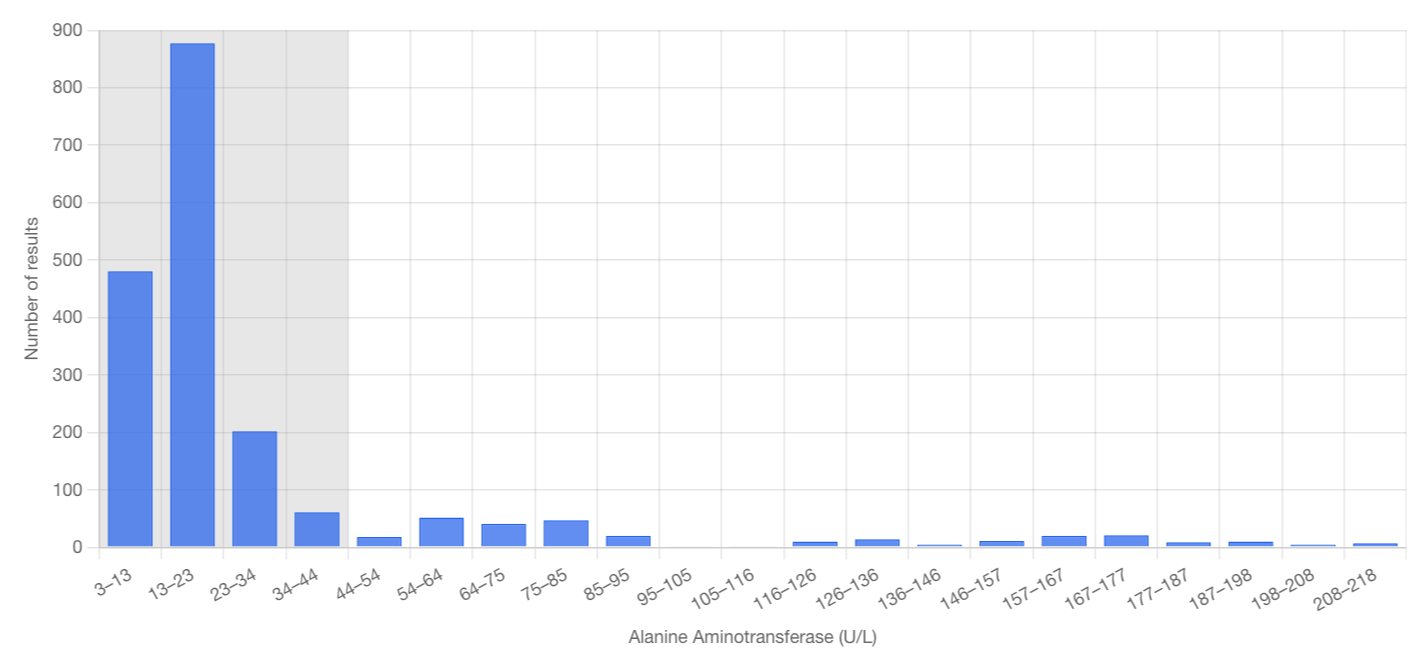
- “Alanine Aminotransferase (U/L)”
- “Number of results”
Alanine Aminotransferase (U/L), all participants. The 21 bars and their counts are the same in both.
The overview says what the bars count
The histogram opens on one panel for each measure. The line above the panels now says what each bar counts, and pointing at a bar shows its range and its count. The panels carry no axis title.
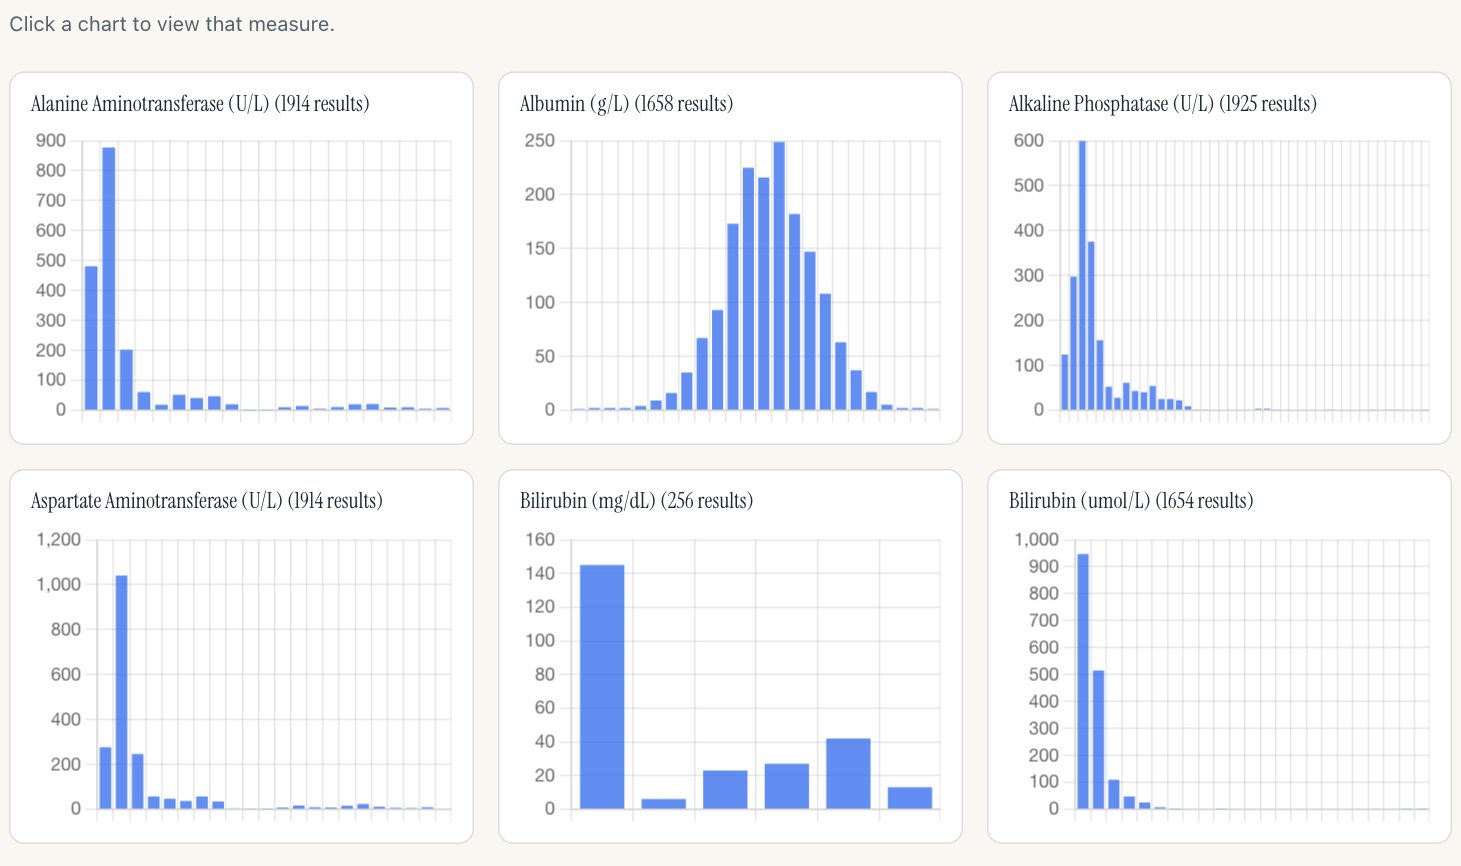
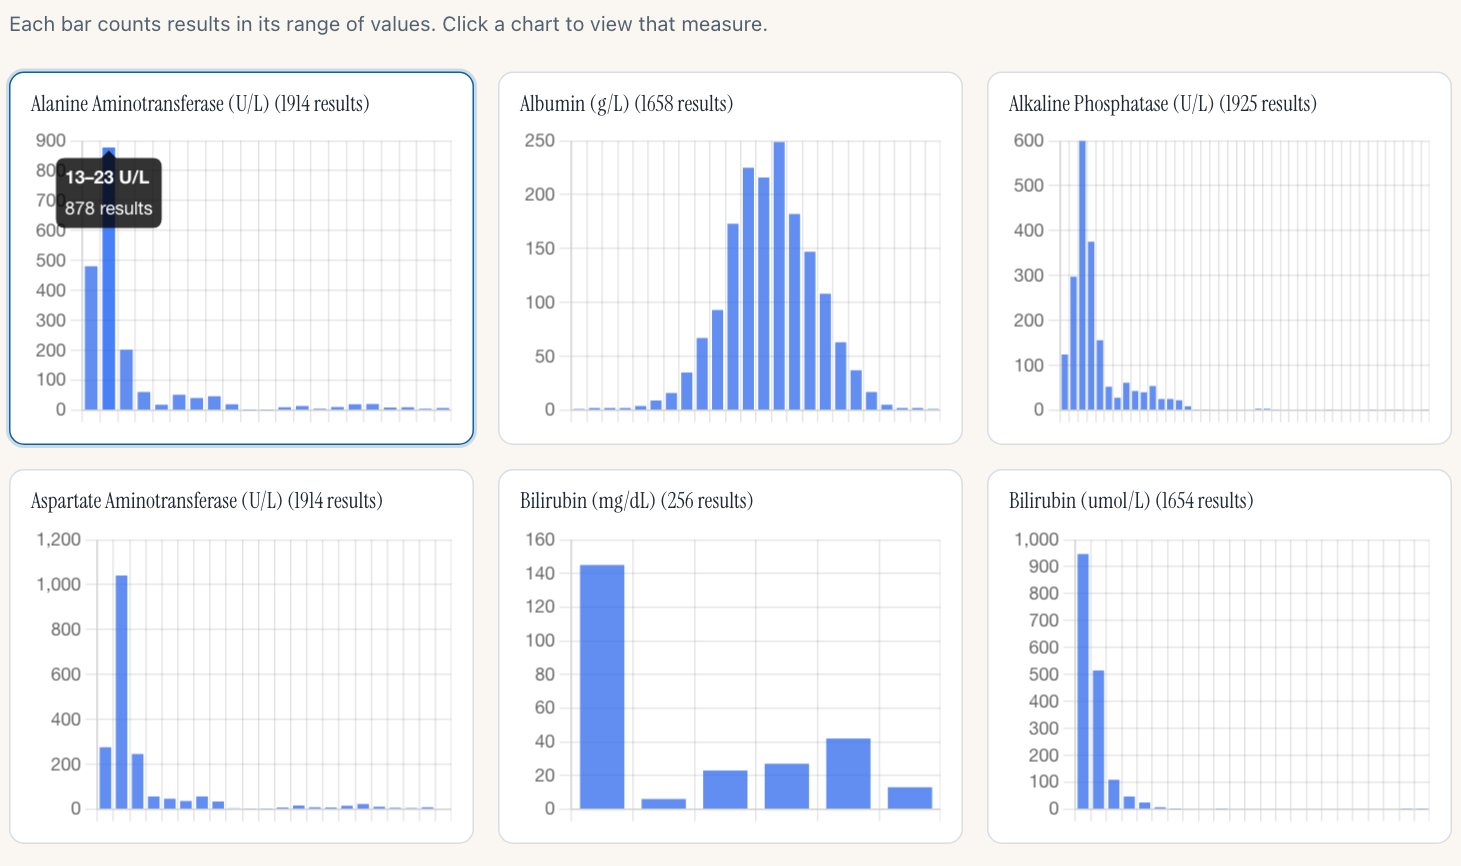
- The line: “Each bar counts results in its range of values. Click a chart to view that measure.”
- Pointing at a bar: “13–23 U/L”, “878 results”.
The first six of 29 panels. The counts are the same in both. Click a panel, or press Enter on it, to open its measure, as before. A phone shows no tooltip.
Grouped panels give the count on hover
Grouping by treatment group draws a panel for each group under the titled chart. Pointing at a bar shows its range and count, as on the overview.
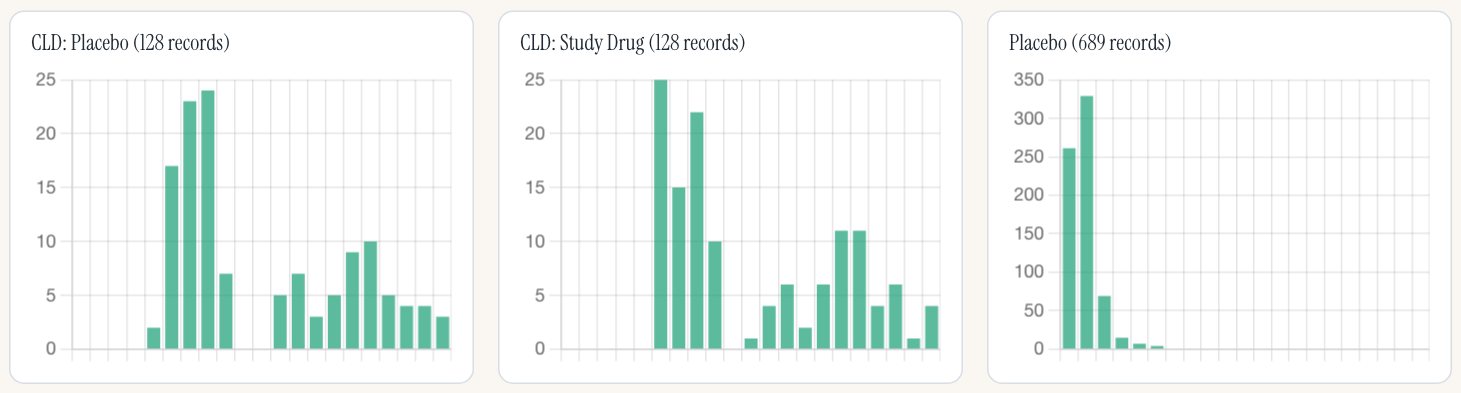
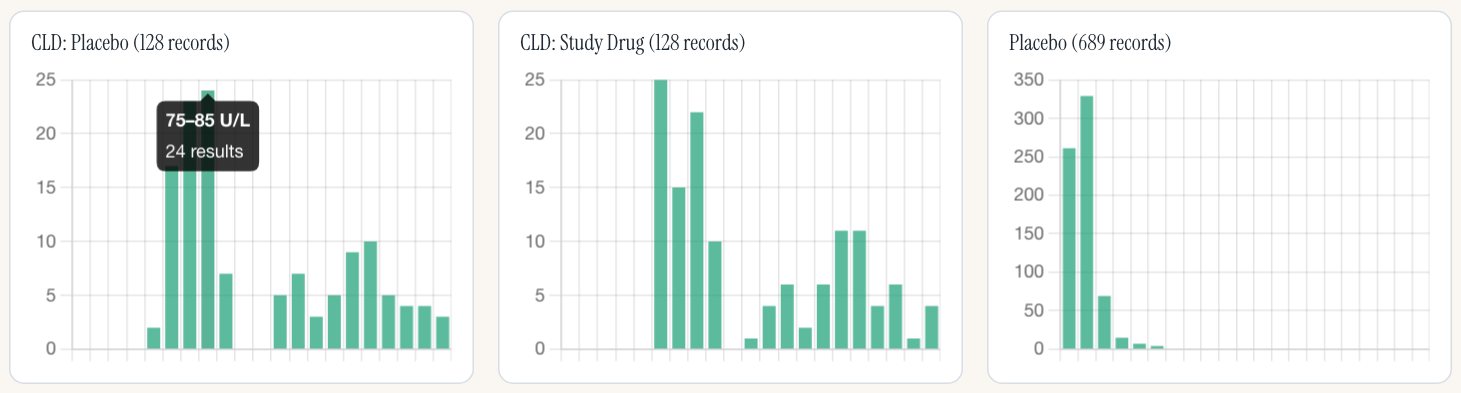
- Pointing at a bar: “75–85 U/L”, “24 results”.
Alanine Aminotransferase (U/L), grouped by treatment group: the first row of 5 panels. The chart above them keeps both axis titles.
The listing names the visit
Select one participant, click a bar: each record now says which visit it is from. The participant ID, which the gallery page also offers as a filter, is listed once.
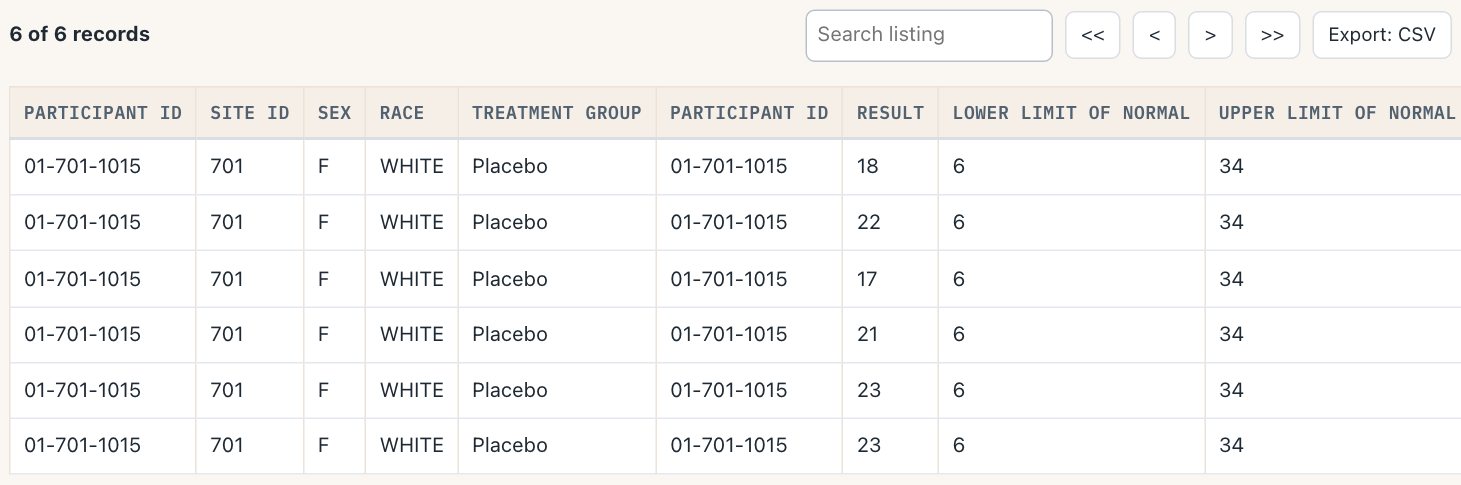
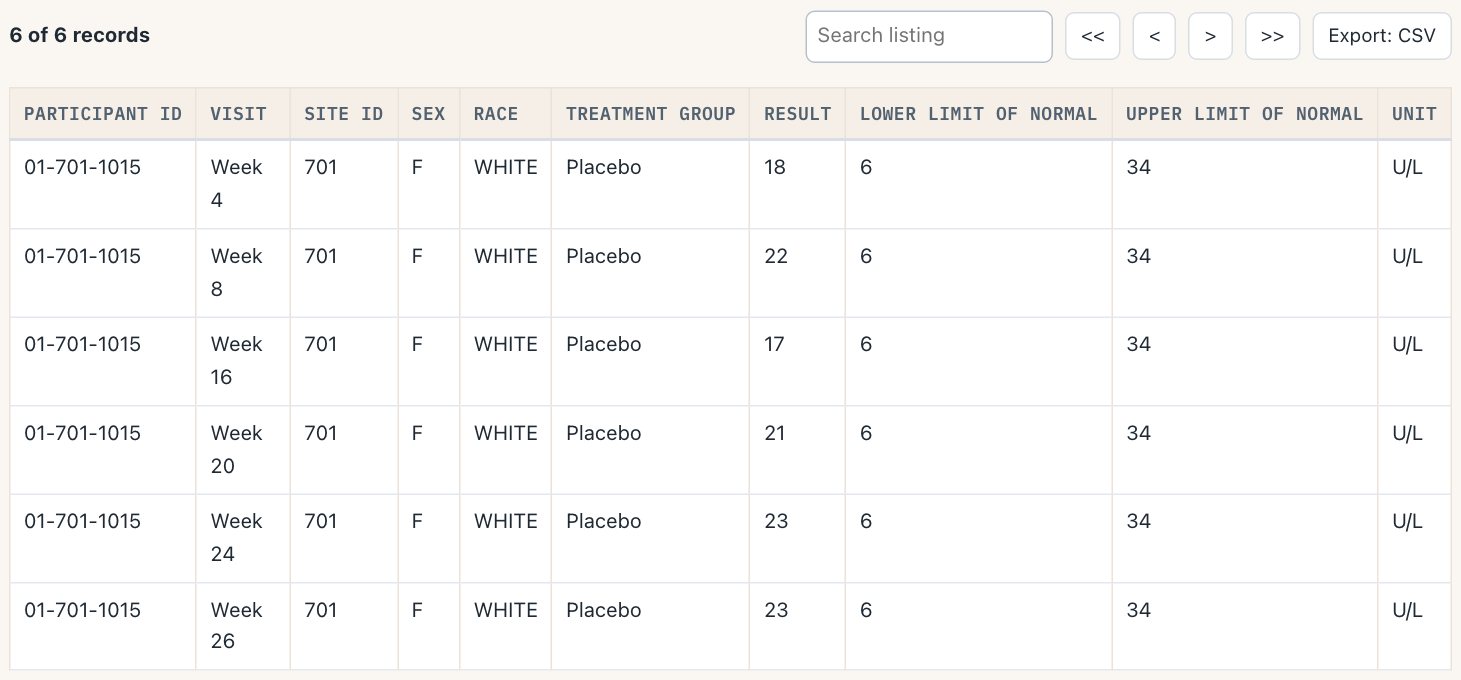
- Participant ID, once.
- Visit: Week 4, Week 8, Week 16, Week 20, Week 24, Week 26.
Participant 01-701-1015, Alanine Aminotransferase (U/L), the tallest bar: the same 6 records in both.
The same in the demo app
The demo app opens on the histogram, so it gets both changes.
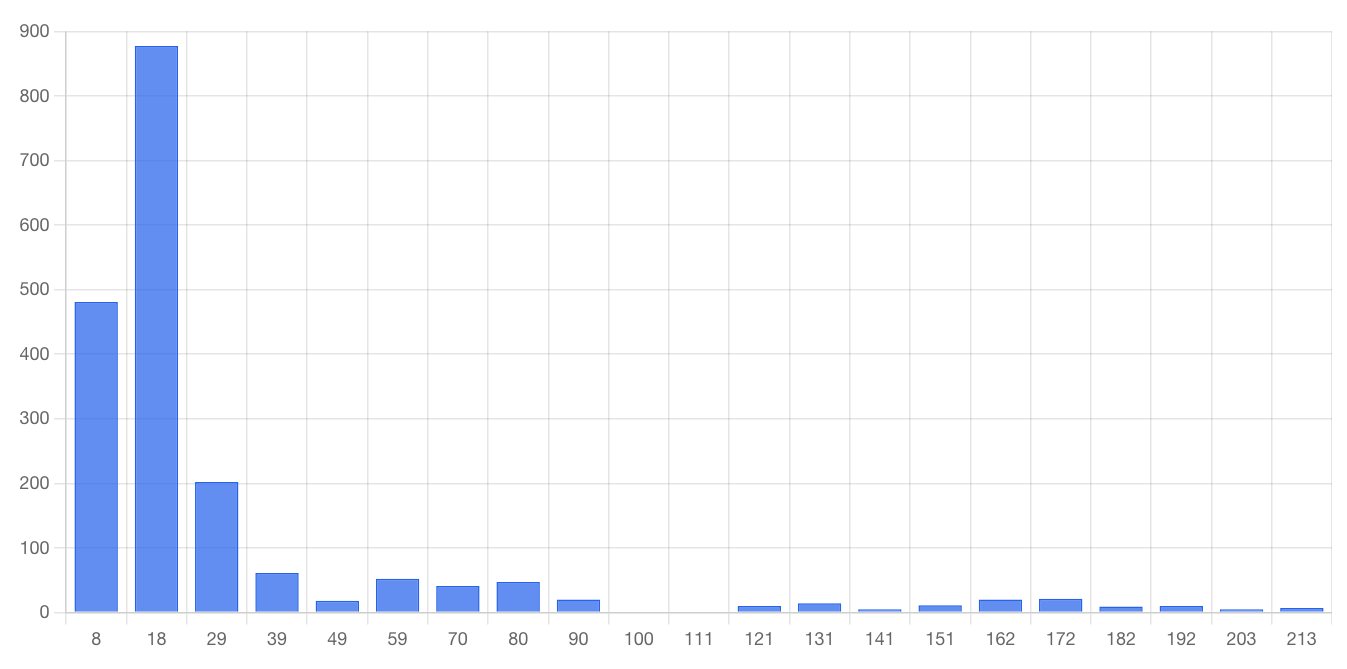
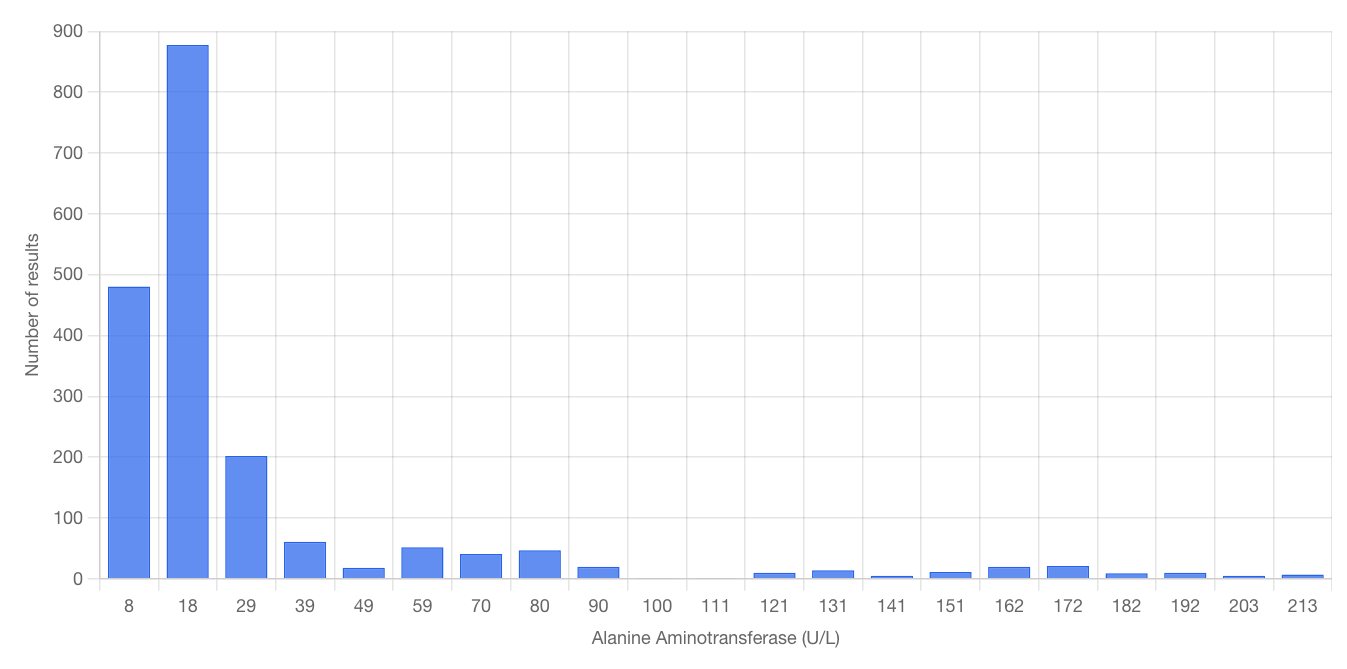
- “Alanine Aminotransferase (U/L)”
- “Number of results”
Alanine Aminotransferase in the demo app.
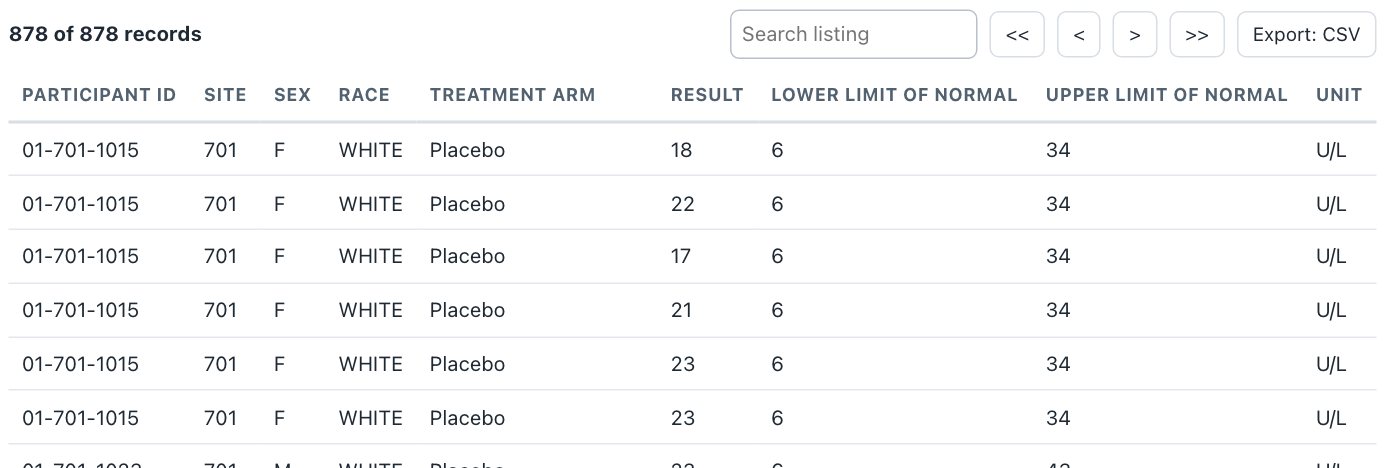
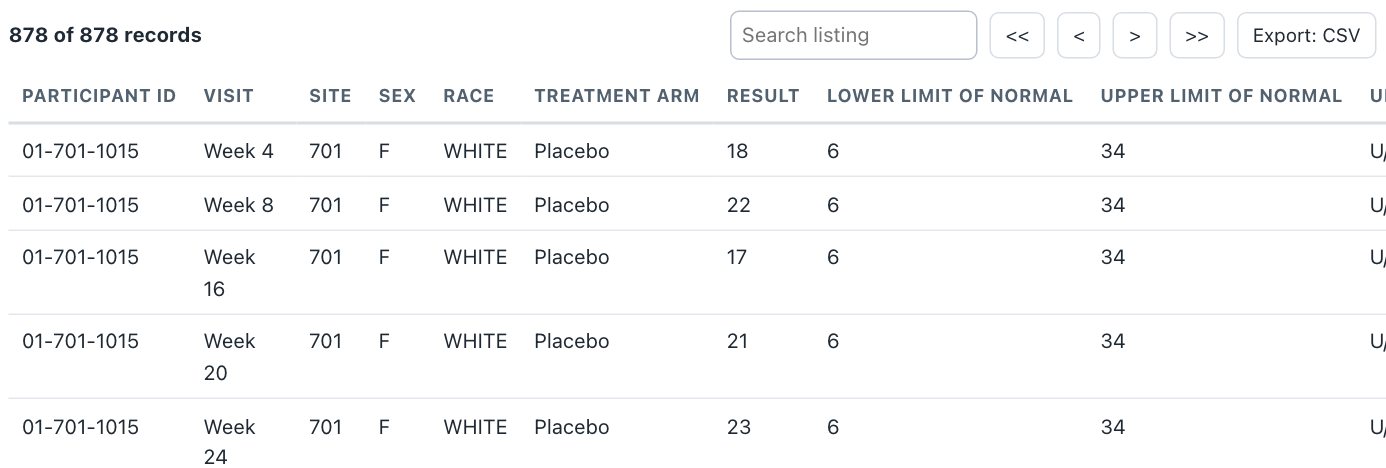
The tallest bar, clicked: the app offers no participant filter, so these are all 878 records in that bar. At a 1,280-pixel window the wider listing now runs past the card on the right; that is filed for the backlog (safety.viz #355).
- Participant ID
- Site
- Sex
- Race
- Treatment arm
- Result
- Lower Limit of Normal
- Upper Limit of Normal
- Unit
- Participant ID
- Visit
- Site
- Sex
- Race
- Treatment arm
- Result
- Lower Limit of Normal
- Upper Limit of Normal
- Unit
- Open the histogram demo and point at a bar.Its range and its count of results.
- Set Measure to Alanine Aminotransferase (U/L), Group charts by to None.Both axes are titled.
- Set Participant ID to 01-701-1015, click the tallest bar.The listing shows Participant ID, then Visit.
- Open the demo app.The same titles and the same Visit column.
The participant profile's time axis says "Study Day" but, on the demo data, plots visit numbers. It is unchanged here, and the listing has no study-day column for the same reason. Fixing it is its own development cycle: requirement 2 of the objective to firm up the tools for the ISG relaunch (obot.roadmap #429).
What did not change
- Bins, tick labels and counts. The capture compared them in both releases.
- A listing given its own columns (the details setting) is used as given.
- The participant profile, every time axis, the demo data, and every other chart.
- The gsm.safety widget gets both changes when it next copies in the bundle.
Where to check it
- The histogram evidence page.
- The requirement: the Safety Histogram’s quick wins (obot.roadmap #430).
- The tasks: axis titles (#347), pull request #349; the count on hover (#359), pull request #360, chosen from the options page; the visit in the listing (#348), pull request #350.
- The requirement matrix, the release notes, the release preparation (#351).