safety.viz v1.12.0: Visit or Study day
Every chart that shows change over time can now be read by visit or by study day, with one switch that works the same way everywhere. The demo data now carries real study days, and hep-explorer's 30-day timing test is measured in days.
- Before this release, several charts drew a time axis titled "Study Day" over numbers that were not study days: visit numbers in the side panels, the QT drill-down and hep-explorer's slider, and a day worked out from the visit name on the participant profile page.
- Now each of those charts has an X-axis control, Visit or Study day. The axis title always names what is plotted, and tooltips name both.
- A chart with neither a visit nor a study day says so instead of drawing.
- hep-explorer's slider steps by visit or by study day, and its 30-day timing test always uses study days. On the demo data that draws 131 of 318 participants hollow; release 1.11.3 drew none.
- The change was raised by a member of the working group, from a review of the Safety Histogram.
The profile has an X-axis control: Visit or Study day
The gallery's participant profile page, participant 01-701-1028. It opens on Visit.
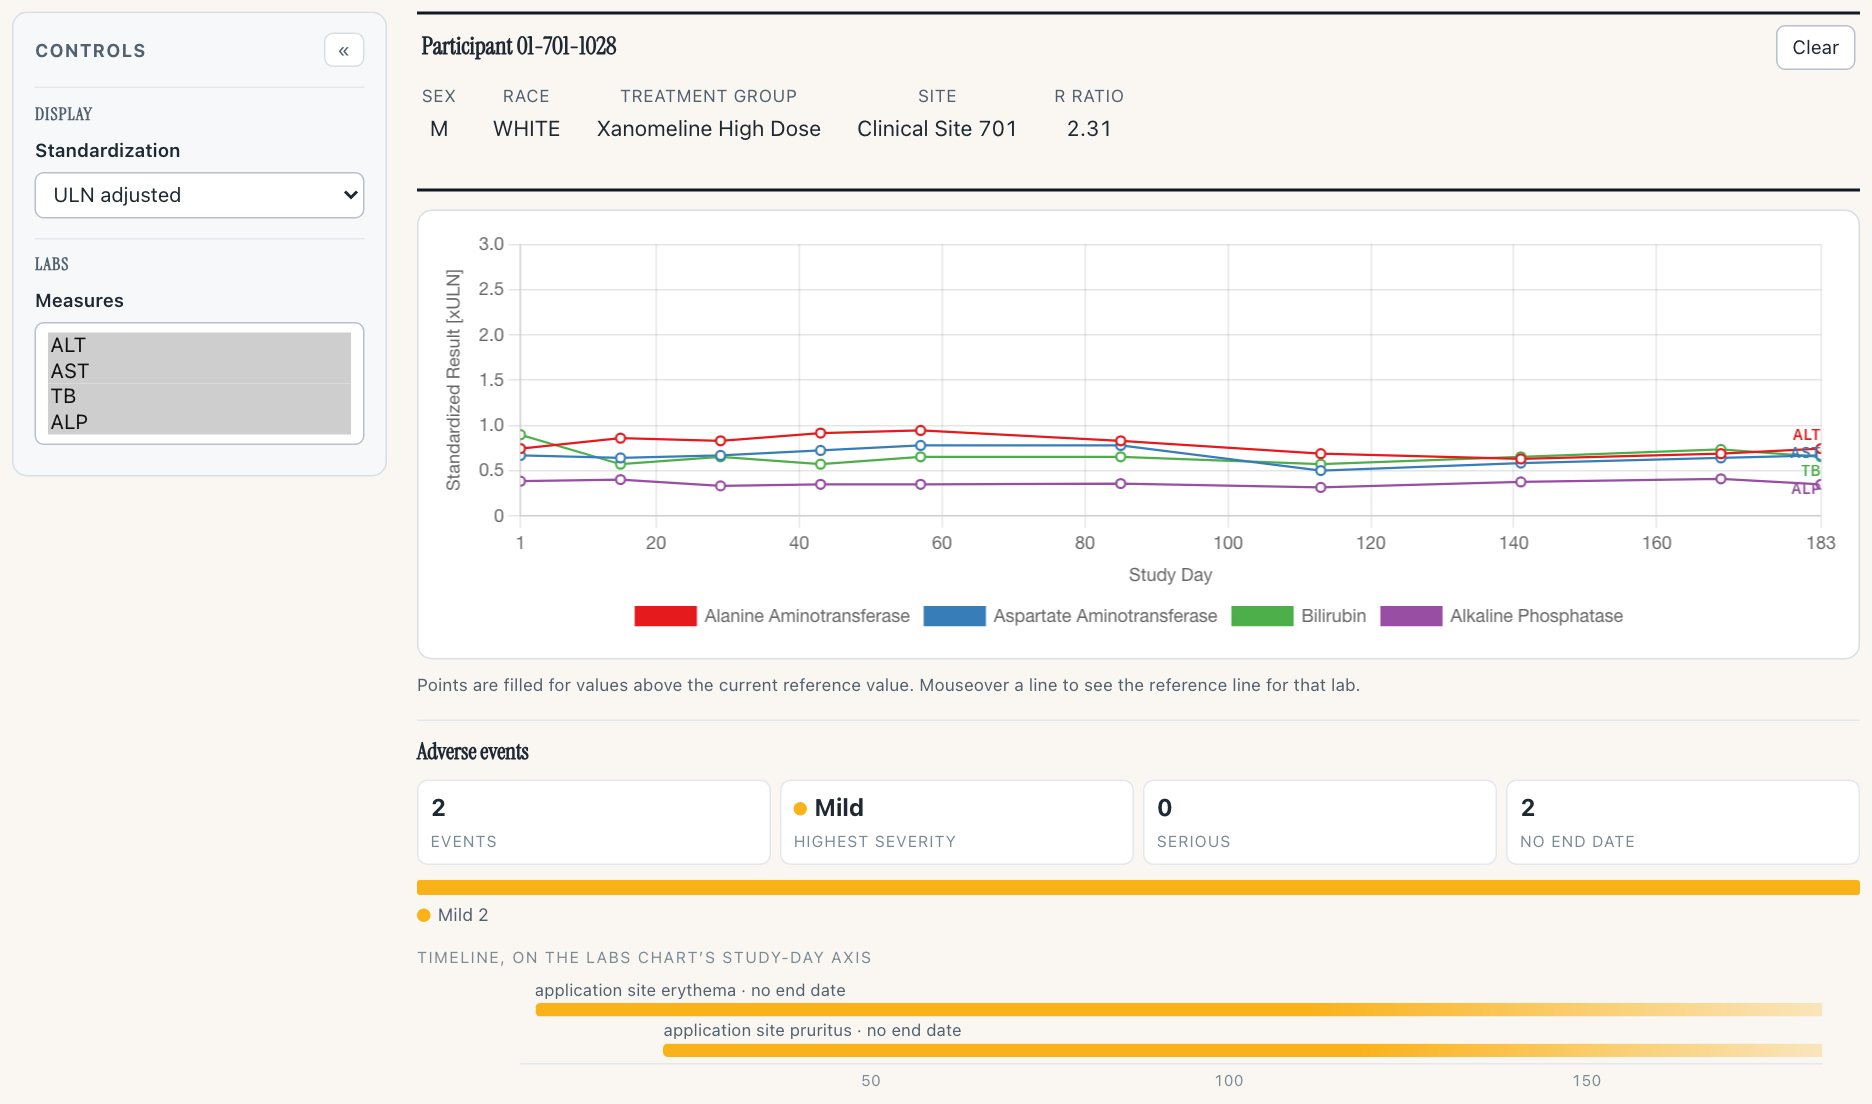
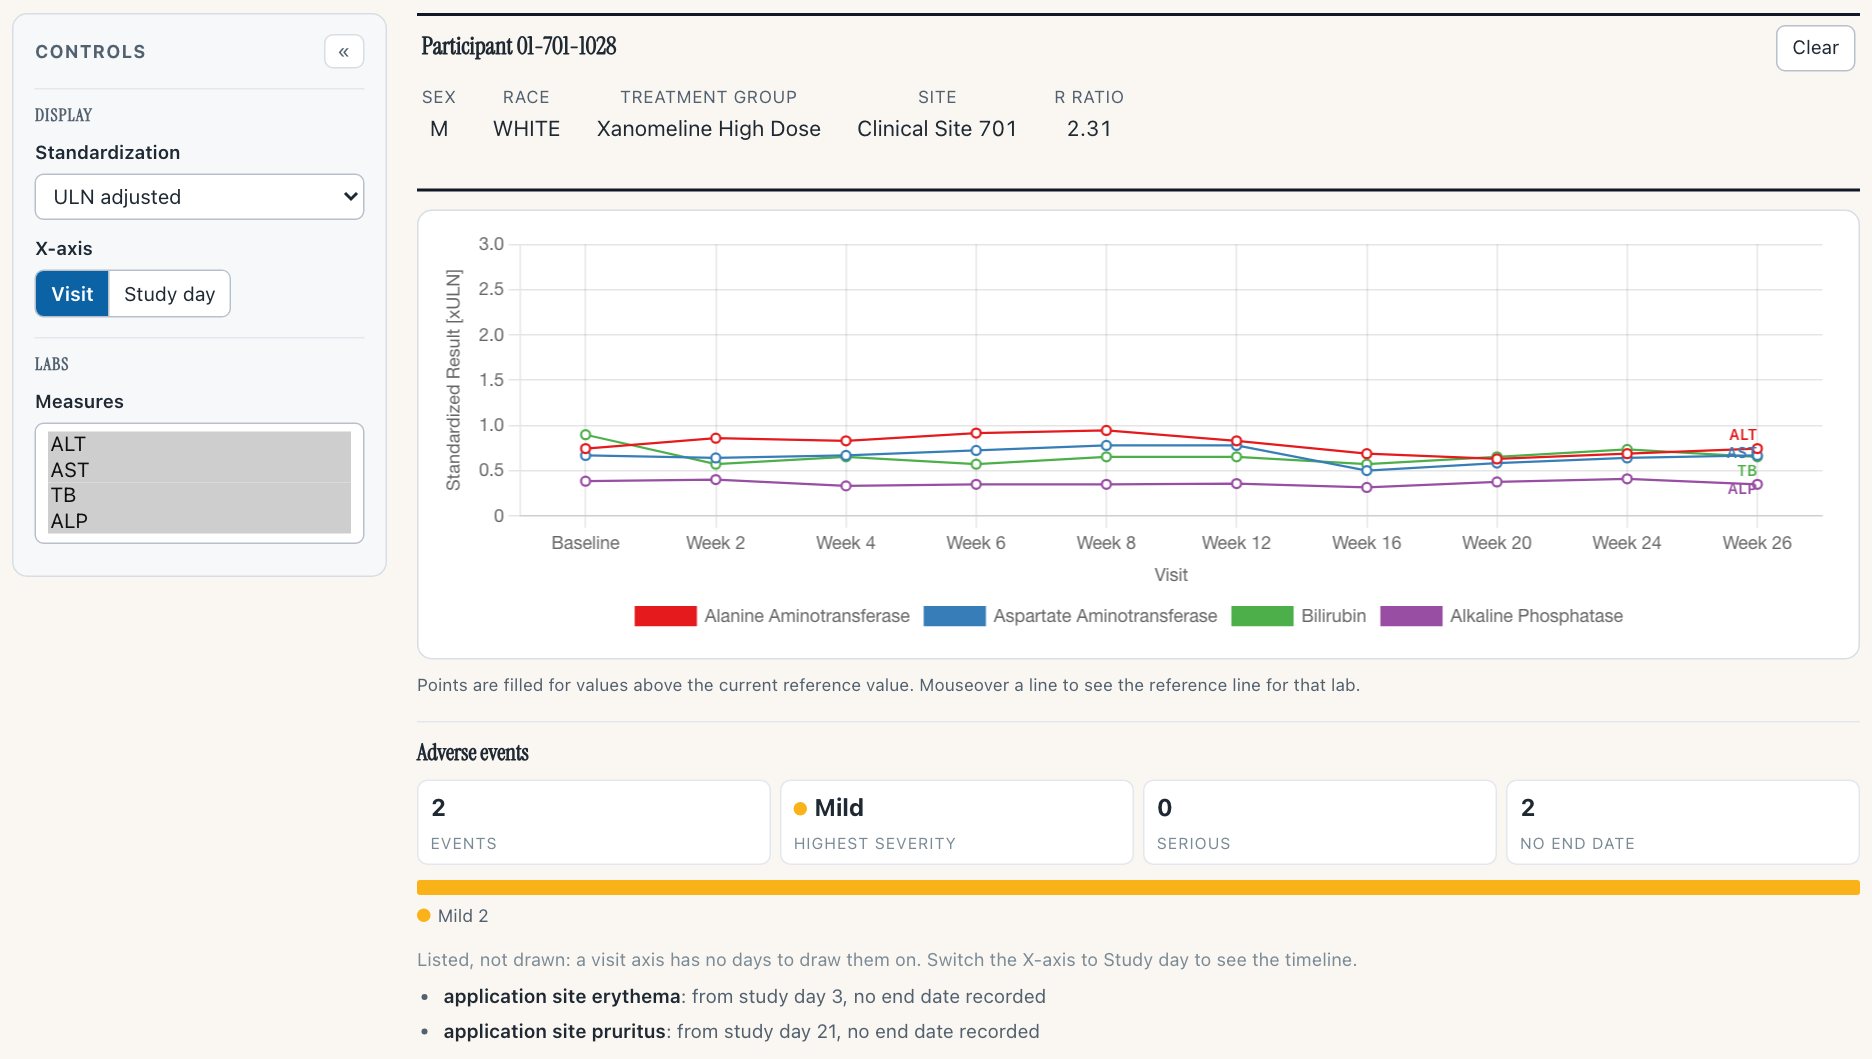
- The X-axis control: Visit | Study day.
- Visit view: the visits evenly spaced, each tick a visit name (Baseline, Week 2, Week 4 … Week 26).
- The adverse events are listed, with their study days, not drawn: a visit axis has no days to draw them on.
Before: the axis was titled “Study Day”, but on this page it plotted a day worked out from the visit name (Baseline day 1, Week N day 7N + 1), so the last ALT sat at 183. The real study day is 180.
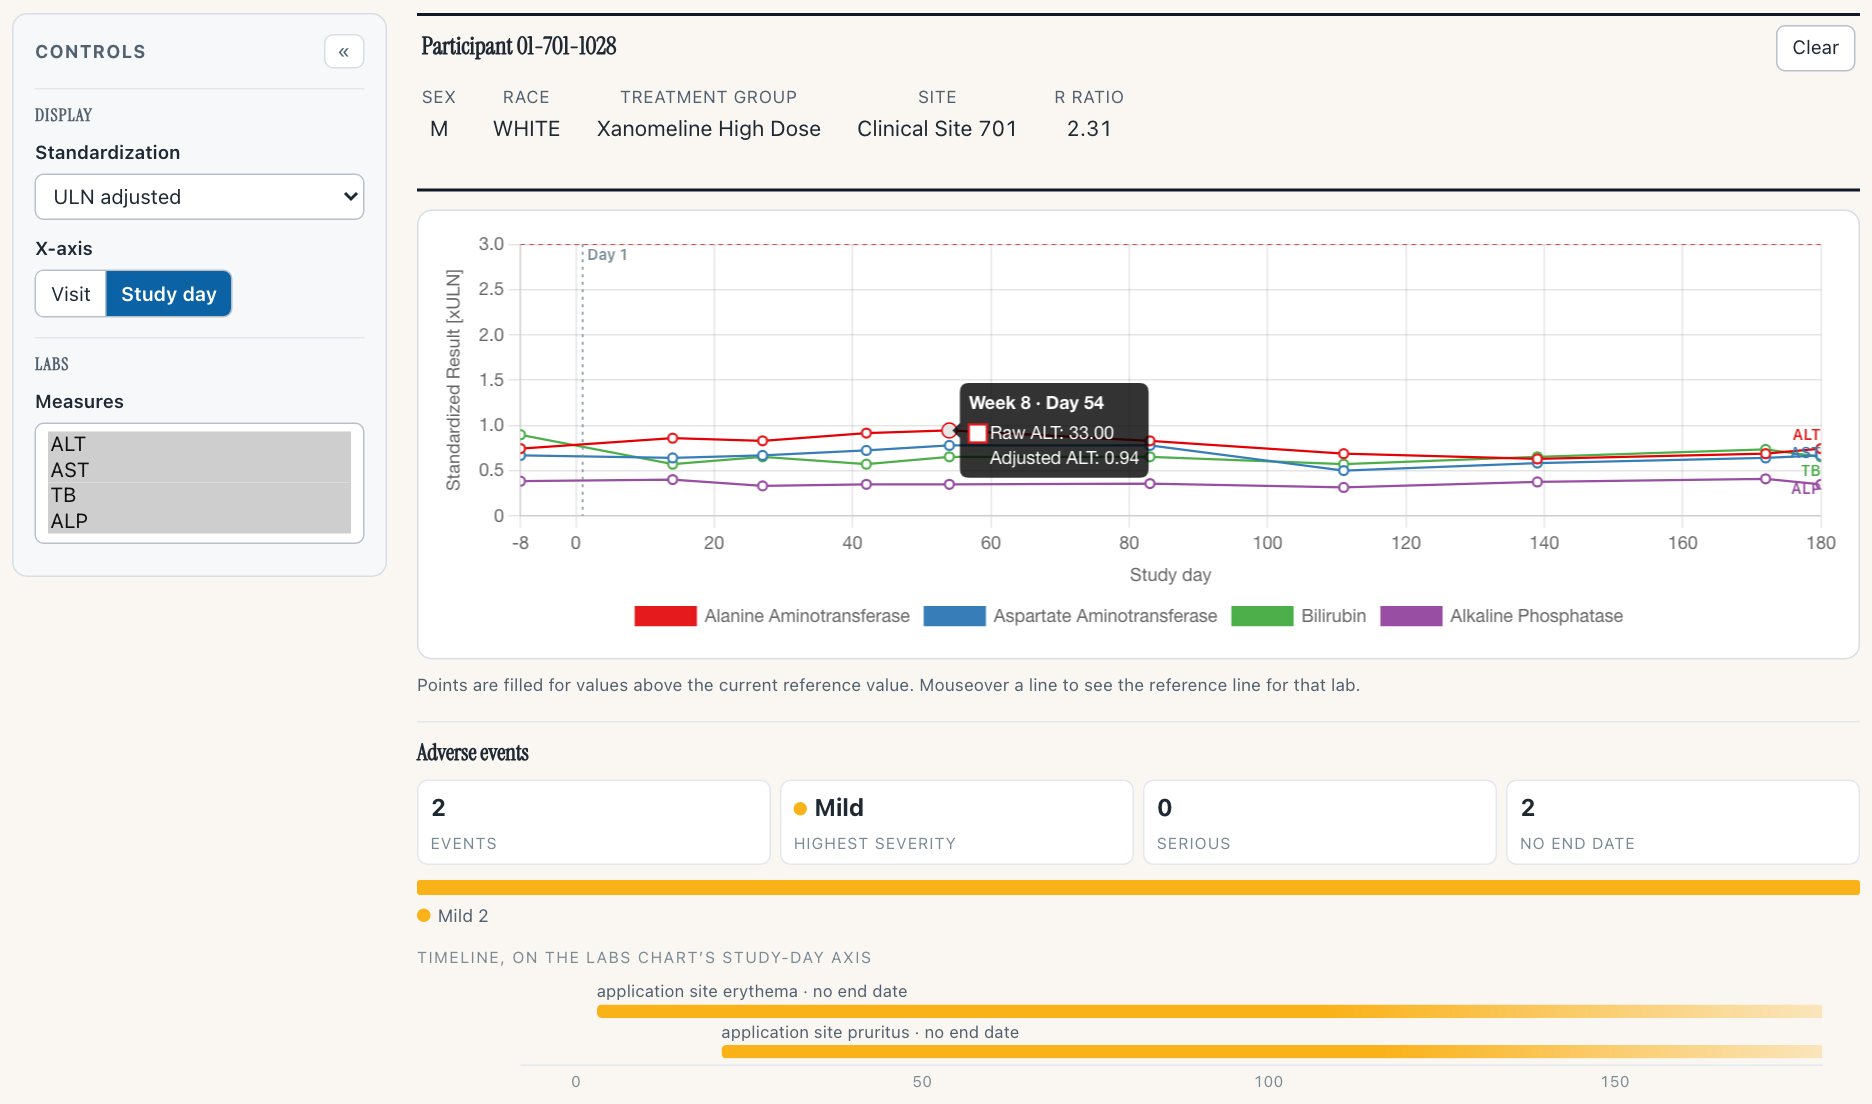
- A dotted line marks day 1, the first dose. Records before it have negative days.
- The tooltip names both: “Week 8 · Day 54”.
- The adverse-event track shows only in this view, on the same day axis as the labs.
The last ALT now sits at study day 180, Week 26. The adverse events listed in Visit view: application site erythema: from study day 3, no end date recorded; application site pruritus: from study day 21, no end date recorded.
- Open the participant profile demo and click a point in the chart at the top.The profile below opens on Visit, with the X-axis control in its controls.
- Press Study day.The axis turns into days, a line marks day 1, and the adverse-event track appears.
- Point at a dot on the ALT line.The tooltip reads like “Week 8 · Day 54”.
The profile as a side panel has its own toggle
Selecting a participant in a host chart opens the profile beside it. It opens on the host's view, or on Visit where the host has no toggle, and keeps its own choice after that.
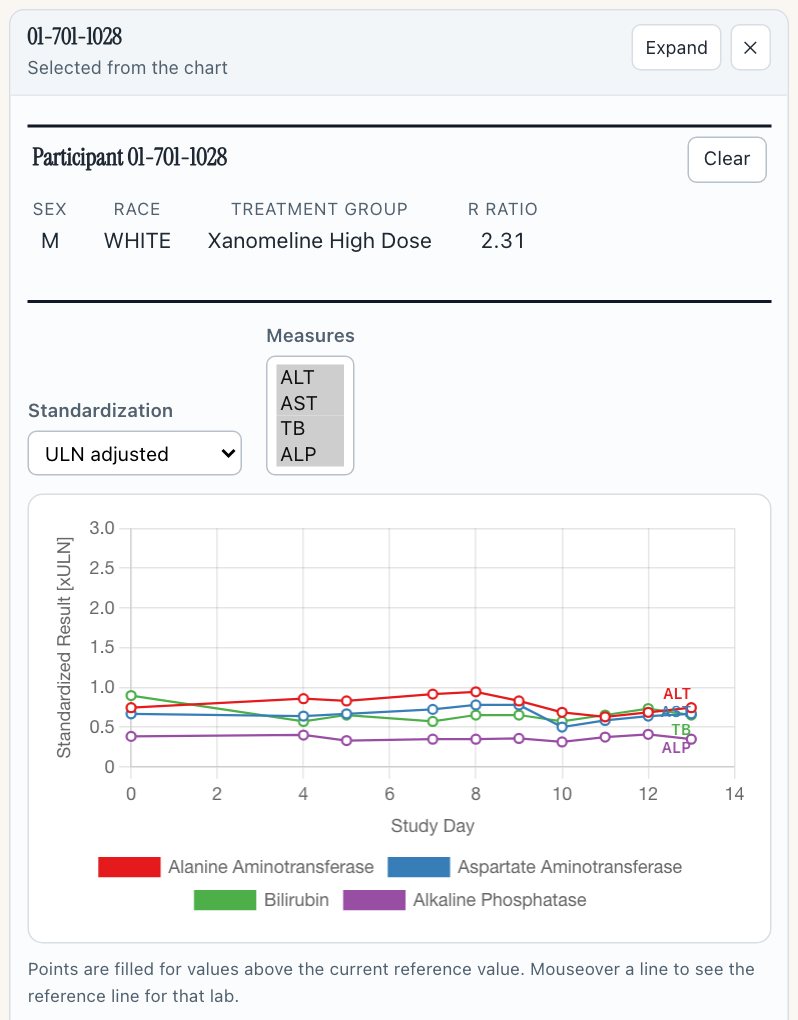
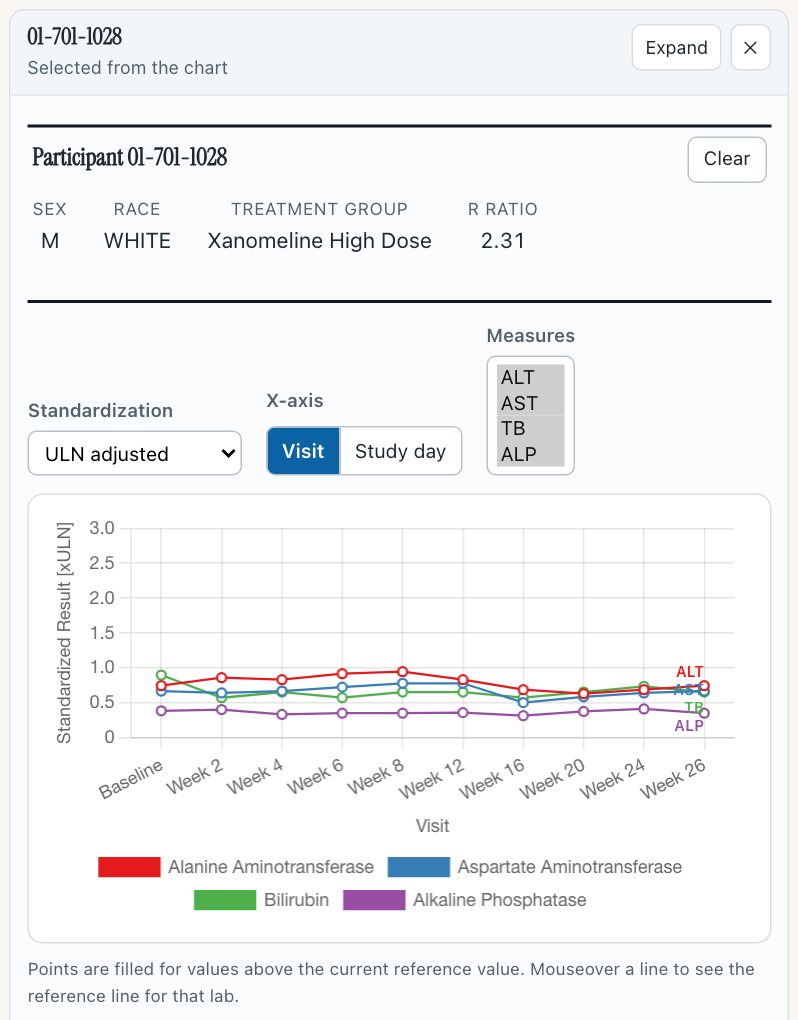
- The side panel's own X-axis control, opening on Visit.
The histogram, participant 01-701-1028. Before, the panel plotted the visit number under the title “Study Day”: the last ALT at 13. In Study day view it now sits at day 180.
- In the outlier explorer, set to Study day, the panel opened on Study day. Switching the panel to Visit left the main chart on Study day.
- The same toggle is in the side panel of the histogram, outlier explorer, shift plot, delta-delta, hep-explorer and QT explorer. The AE explorer and AE timelines panels have none: see "Decided in the build".
- On data with no study day the panel still draws by visit, from the profile's own visit columns, with Study day greyed: read in the histogram, given no time setting, on the gallery data without its DY column (harness). The panel's axis was titled “Visit”; release 1.11.3's panel on the same data drew an empty axis titled “Study Day”. (safety.viz pull request #387)
- Open the histogram demo, set Participant ID to 01-701-1028 and click a bar, then a row of the listing.The side panel opens on Visit, with its own X-axis control.
- Press Study day in the panel.The panel's axis turns into days; the histogram does not change.
The outlier explorer plots by visit or by study day
Release 1.11.3 plotted each participant's results in the order they came, under the title "Measurement". The main axis now takes the same X-axis control, opening on Visit.
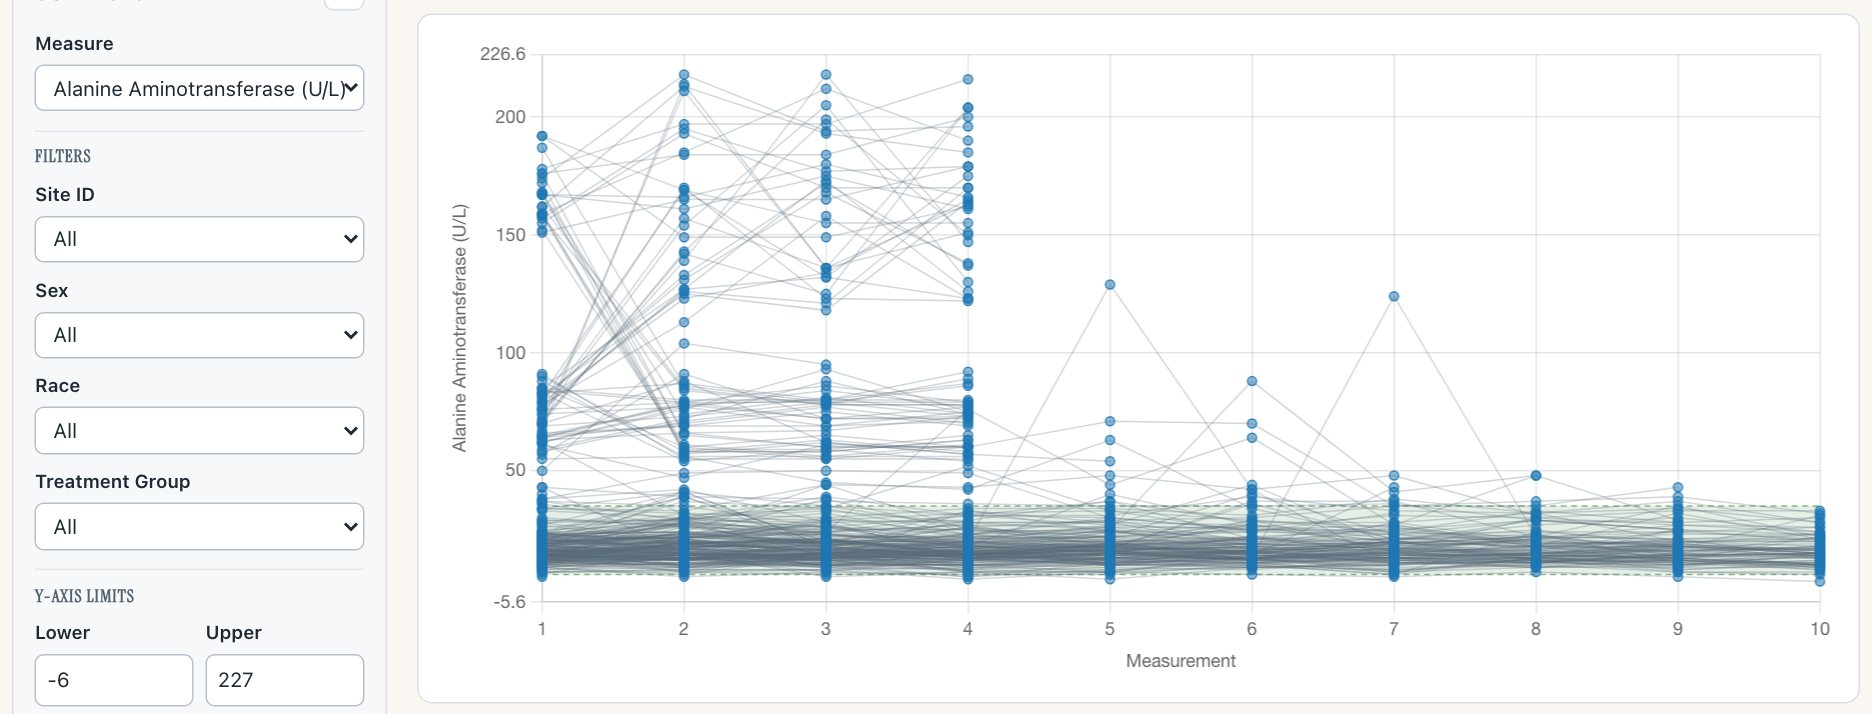
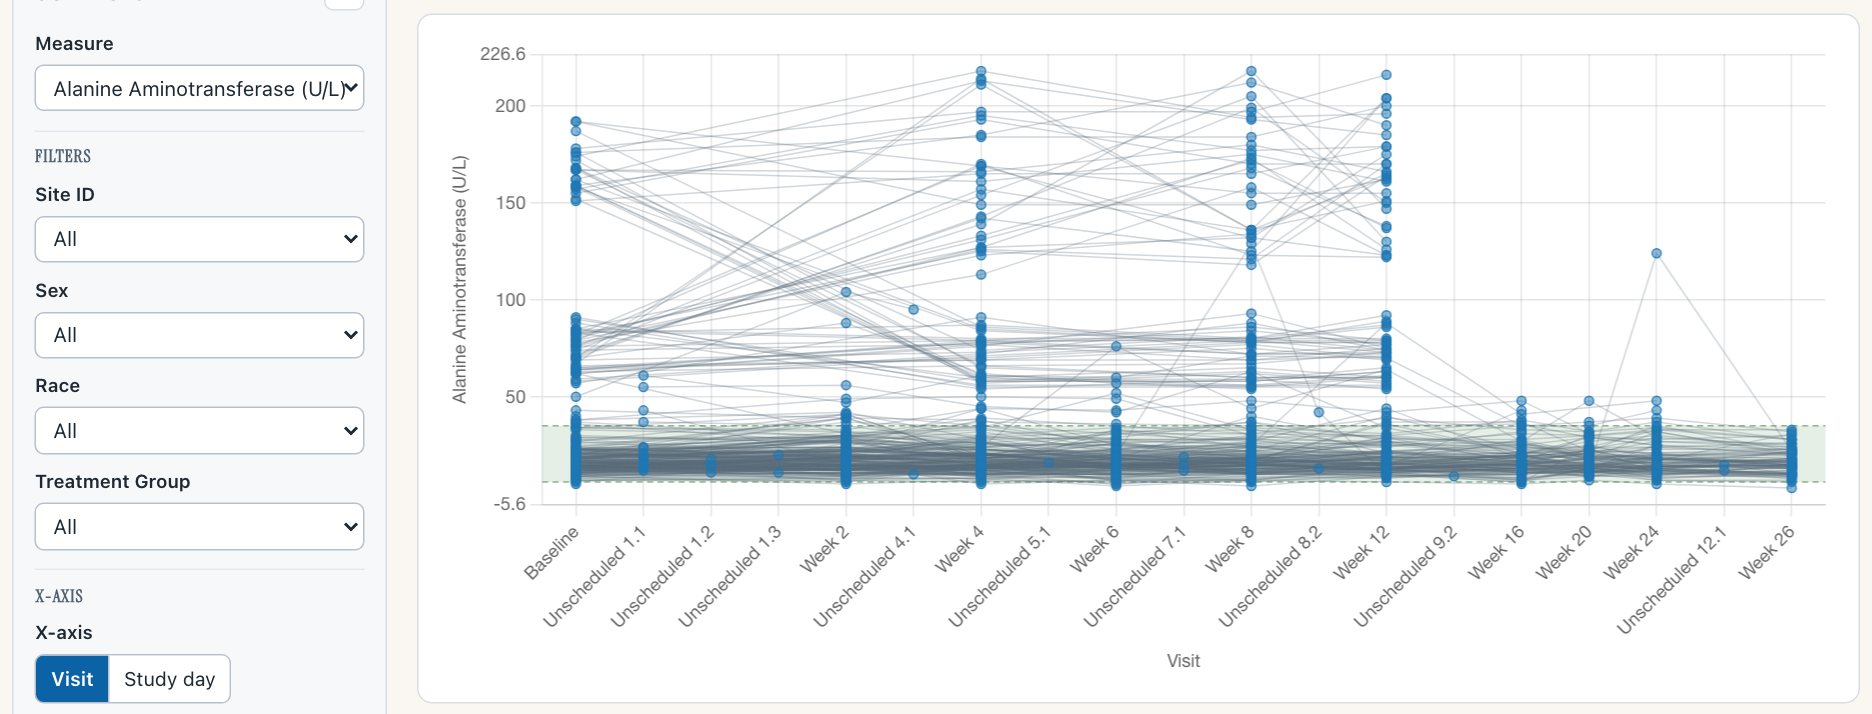
- The X-axis control, in the controls on the left.
- The axis title: “Visit”, with 19 visits, unscheduled ones after the visit they follow.
Alanine Aminotransferase, every participant.
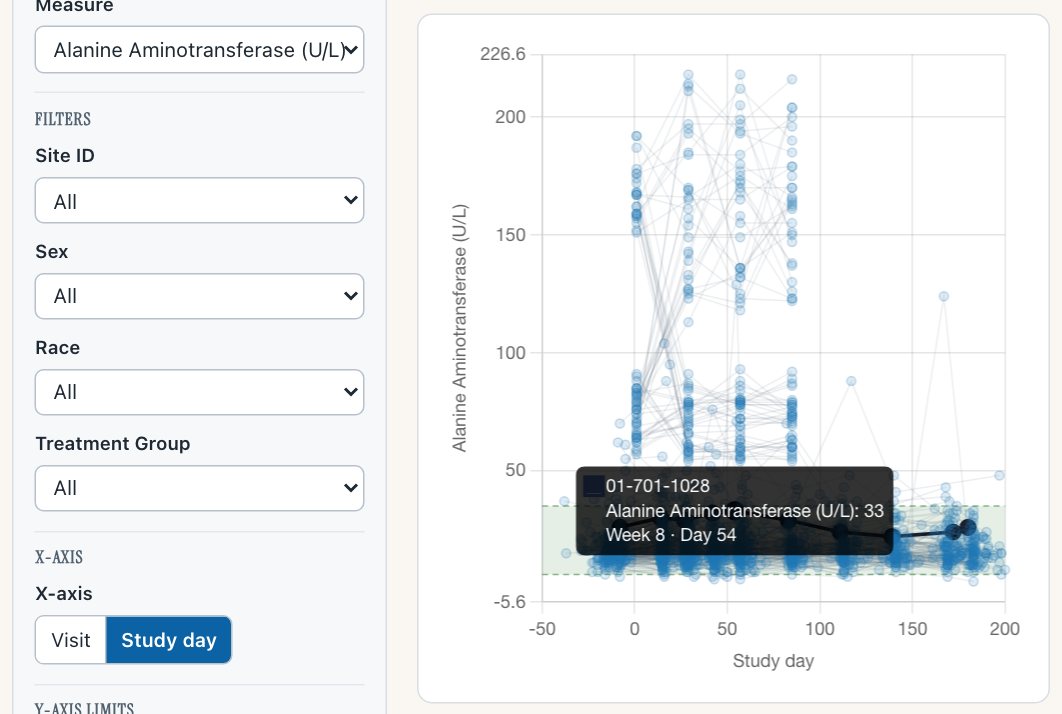
- The tooltip names both: “Week 8 · Day 54”.
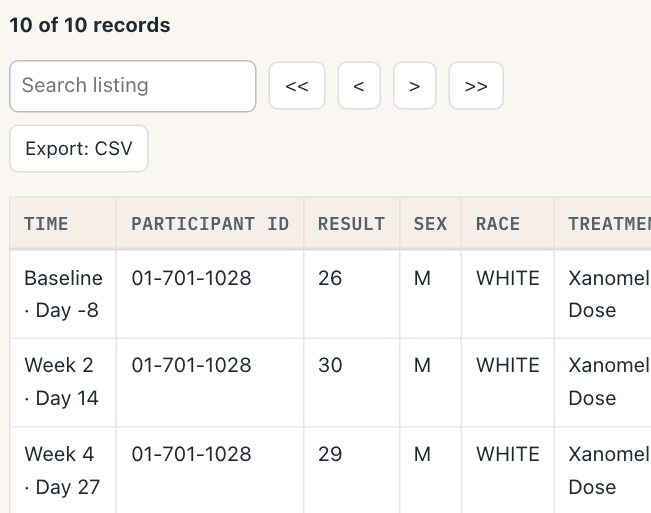
- The “Time” column names both: “Baseline · Day -8”, “Week 2 · Day 14”, “Week 4 · Day 27” …
The listing's 10 records for 01-701-1028 each name a visit and a study day, whichever view is on.
- Visits that share a name but not a number stay apart in Visit view, named with the number, such as “UNSCHEDULED (2.1)”. The demo data gives each unscheduled visit its own name, so it does not show here; the unit test SOE-XAX-006 covers it. (safety.viz pull request #387)
- Open the outlier explorer demo.The axis is titled Visit.
- Press Study day, then click a line.The axis is in days; the listing below names the visit and the day of each record.
The QT drill-down by visit or by study day
Selecting a participant in the QT explorer opens their ECGs in the side panel. Release 1.11.3 passed the visit number there as the study day.
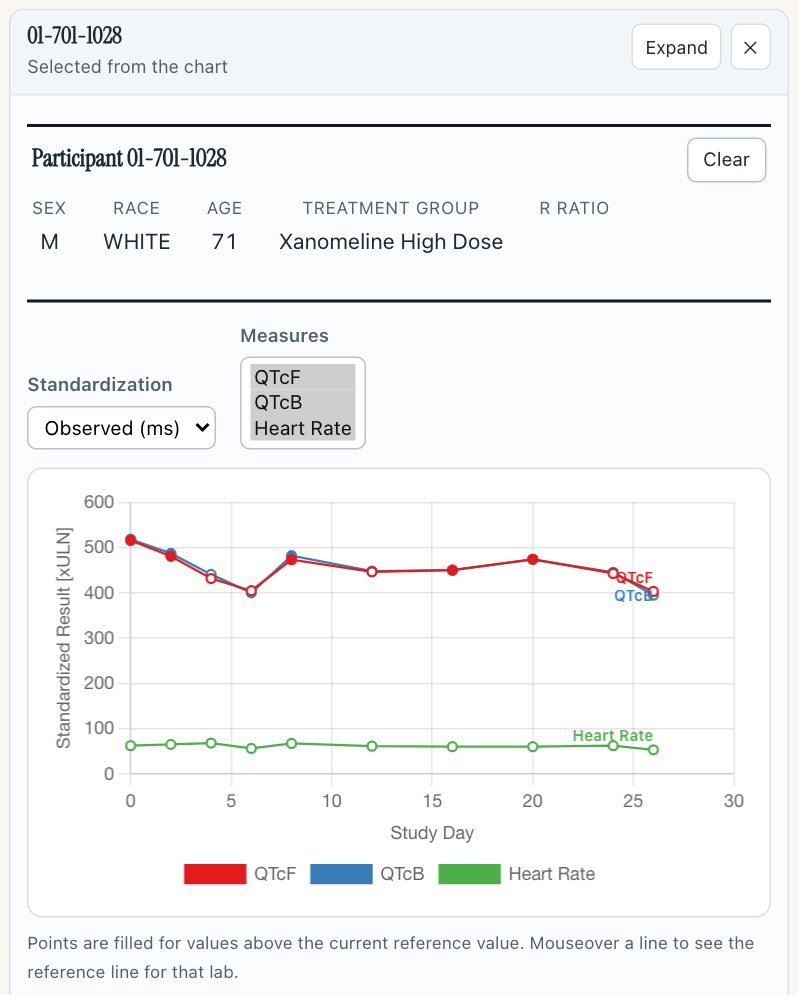
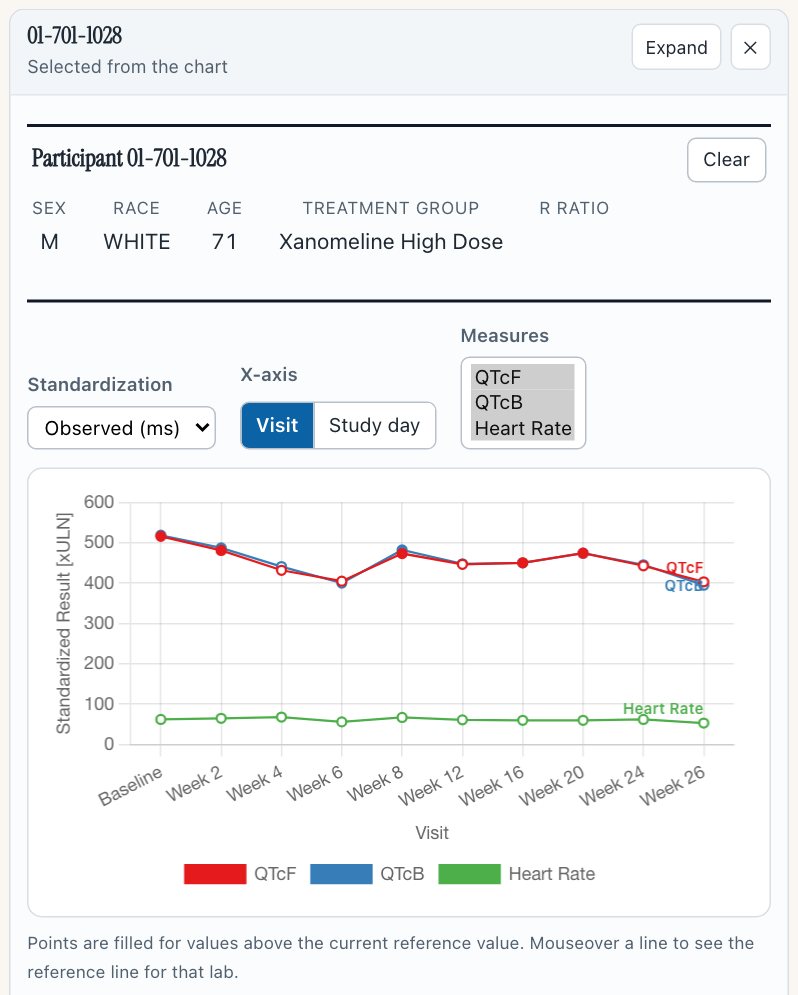
Before: “Study Day” over the visit numbers 0, 2, 4, 6, 8, 12, 16, 20, 24, 26. After, in Study day view, the same ECGs fall on days 1, 14, 27, 42, 54, 83, 111, 139, 172, 180.
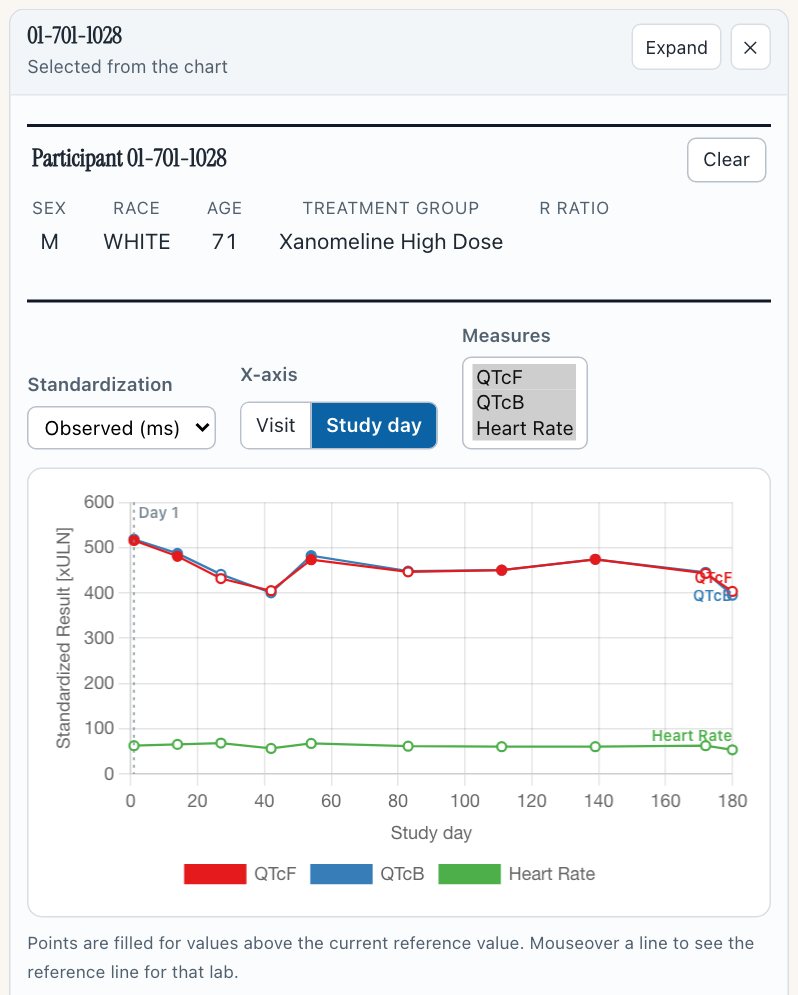
On the demo's ECG data no participant has two visits on one study day, so the two views differ here only in spacing. The design's case of several ECGs on one day, apart by visit and stacked by day, is not in this data.
- Open the QT explorer demo and click a point.The side panel opens on Visit.
- Press Study day in the panel.The ECGs move to their study days.
hep-explorer: step by visit or by study day, and timing in days
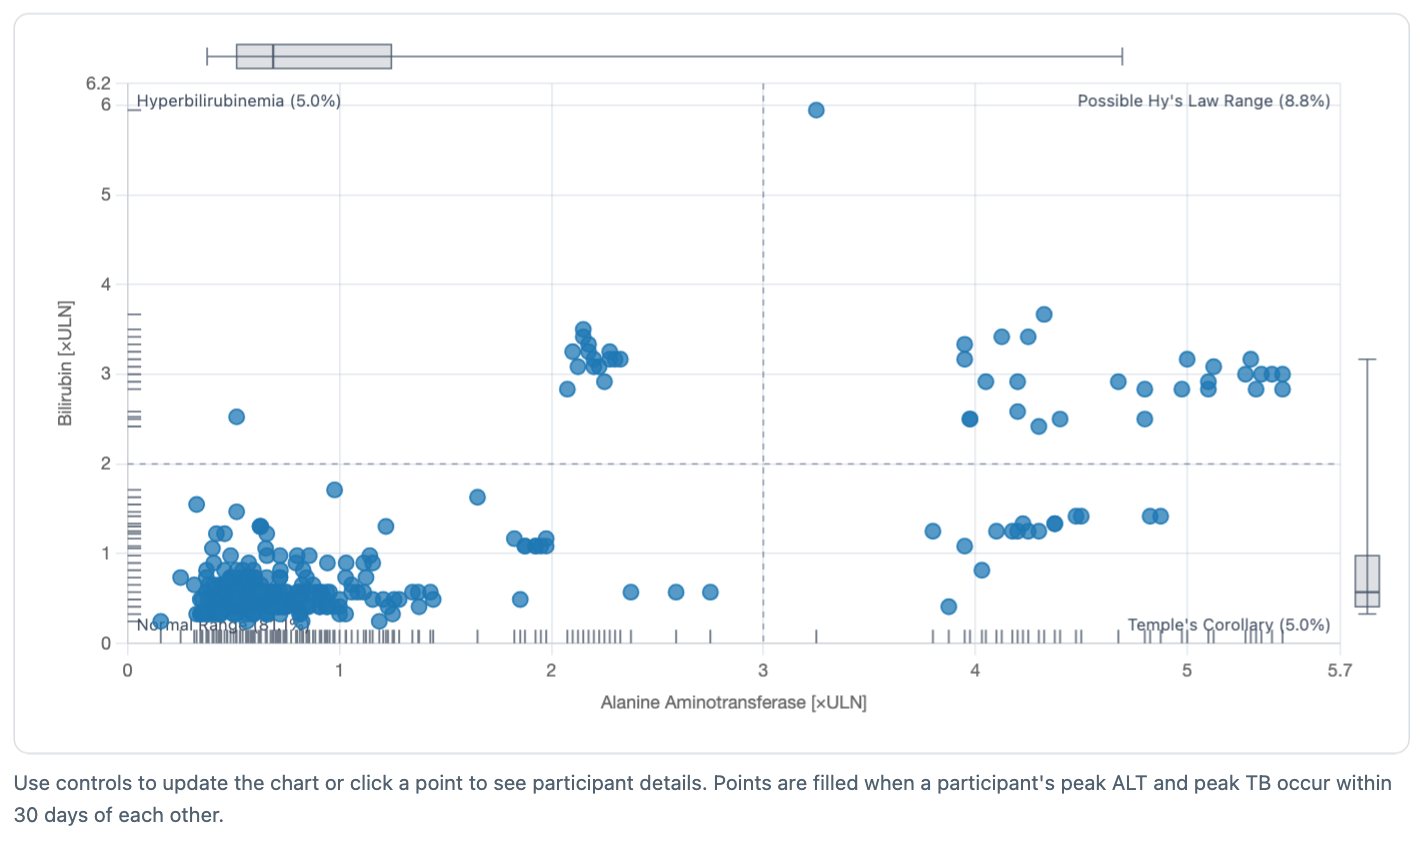
The eDISH scatter. The slider under it now steps by visit or by study day, chosen with a control labelled "Step by". The 30-day timing test always measures study days.
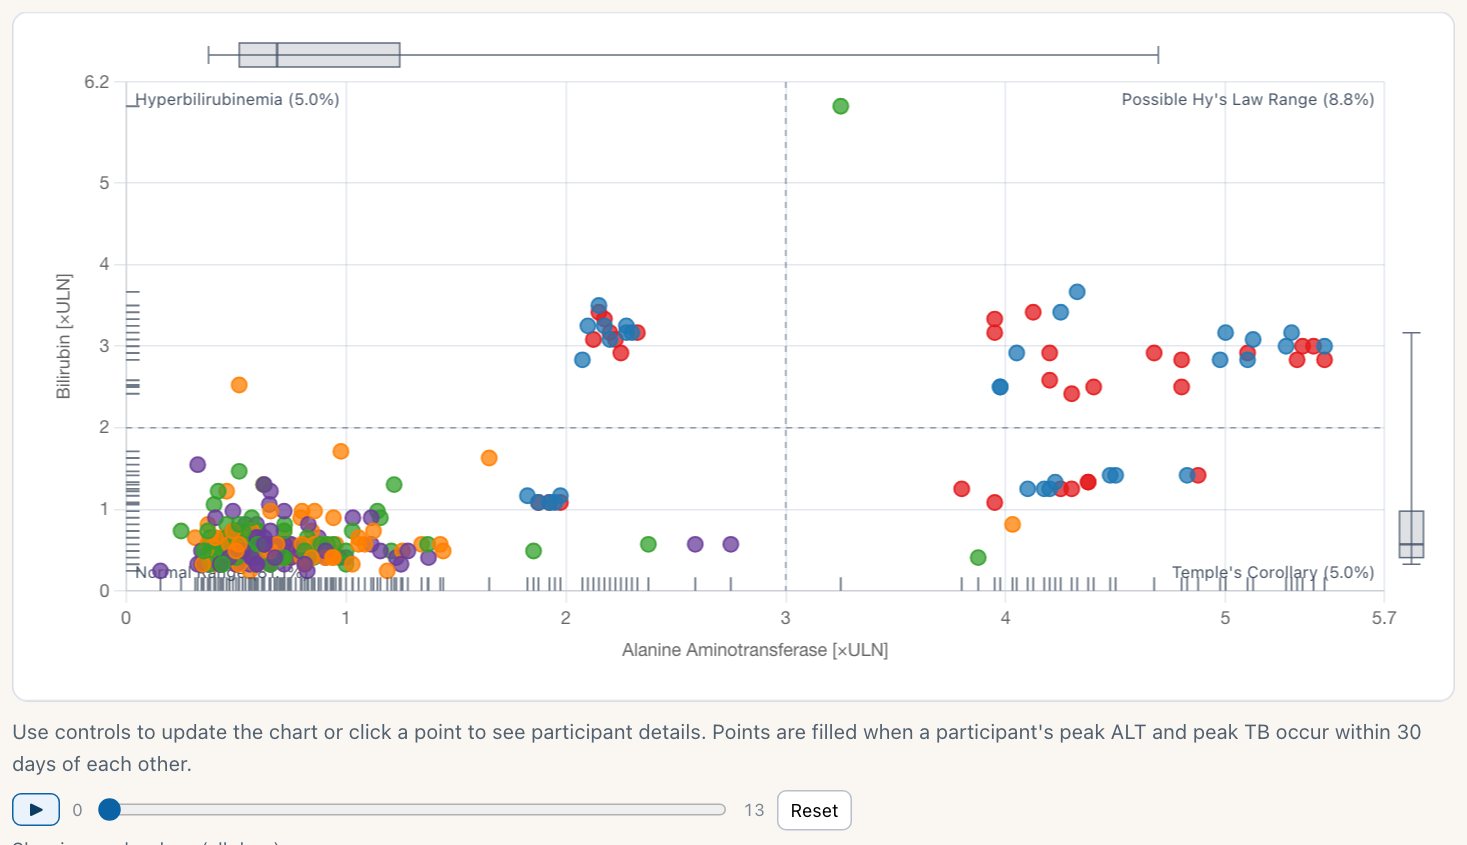
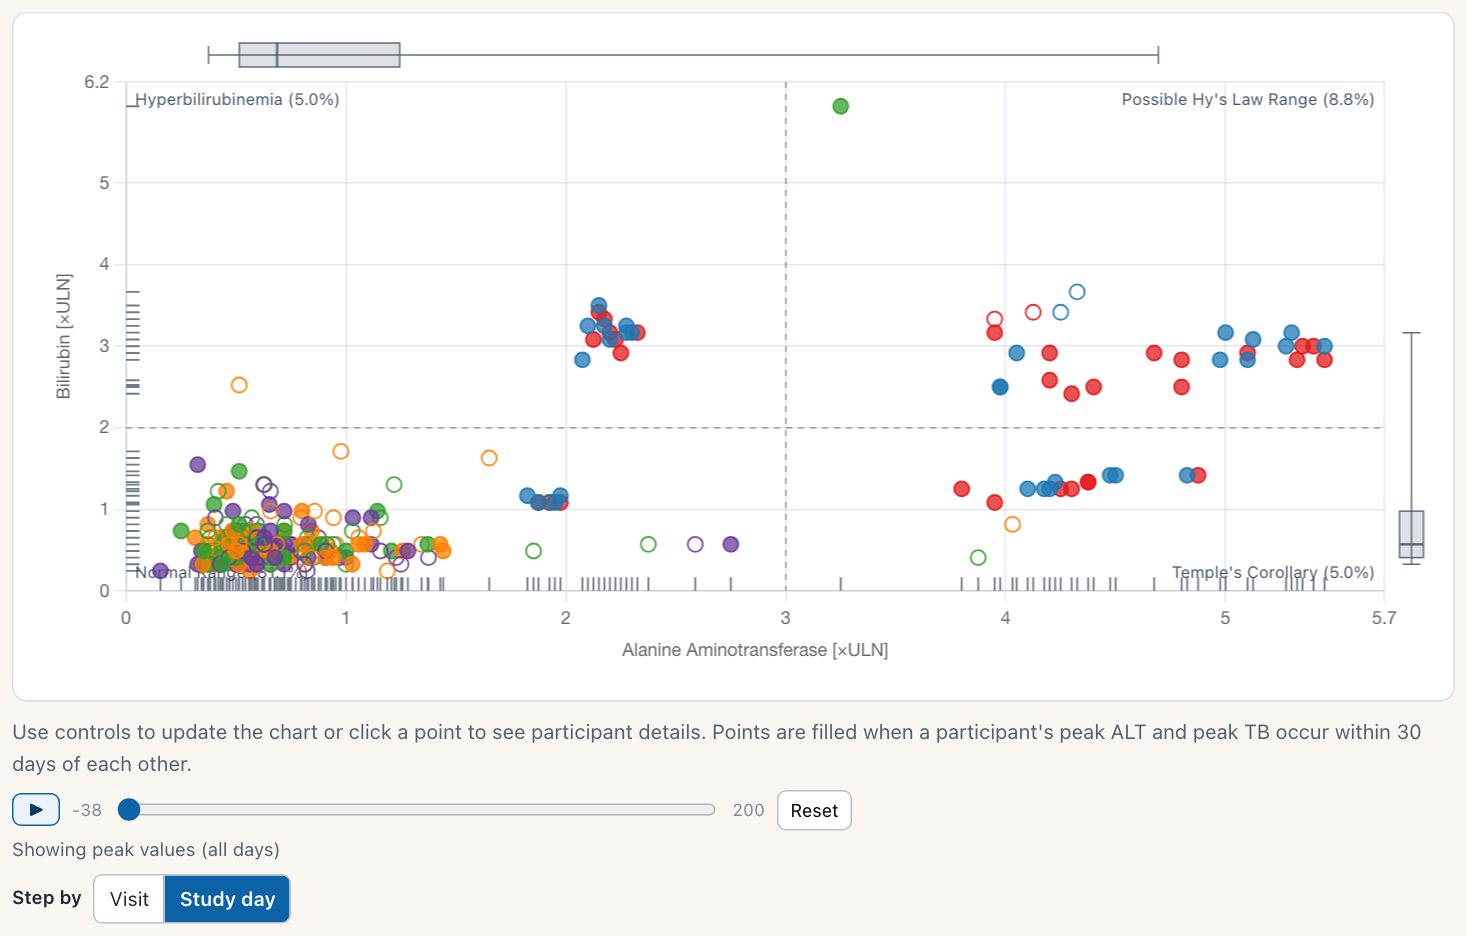
- A hollow point: this participant's peak ALT and peak bilirubin are more than 30 days apart.
- The footnote says what filled means.
- The Step by control: Visit | Study day, opening on Study day.
On the demo data 131 of 318 participants are hollow, read from the points as drawn. Before: 0 of 318, because the test measured visit numbers, which are never 30 apart. The old slider ran from 0 to 13, visit numbers, under the name "Study day".

Step by Visit: the slider runs from Baseline to Week 26. By study day it runs from day -38 to day 200.
- Open the hep-explorer demo and choose eDISH / mDISH scatter.Some points are hollow; the footnote says why.
- Under the chart, press Visit beside "Step by", then play.The points step through the visits by name.
With neither a visit nor a study day, a message
The gallery's data has both, so this is shown in a small harness page: the gallery's own demo data with its visit and study-day columns taken out, loaded into the dev site's bundle and into release 1.11.3's.
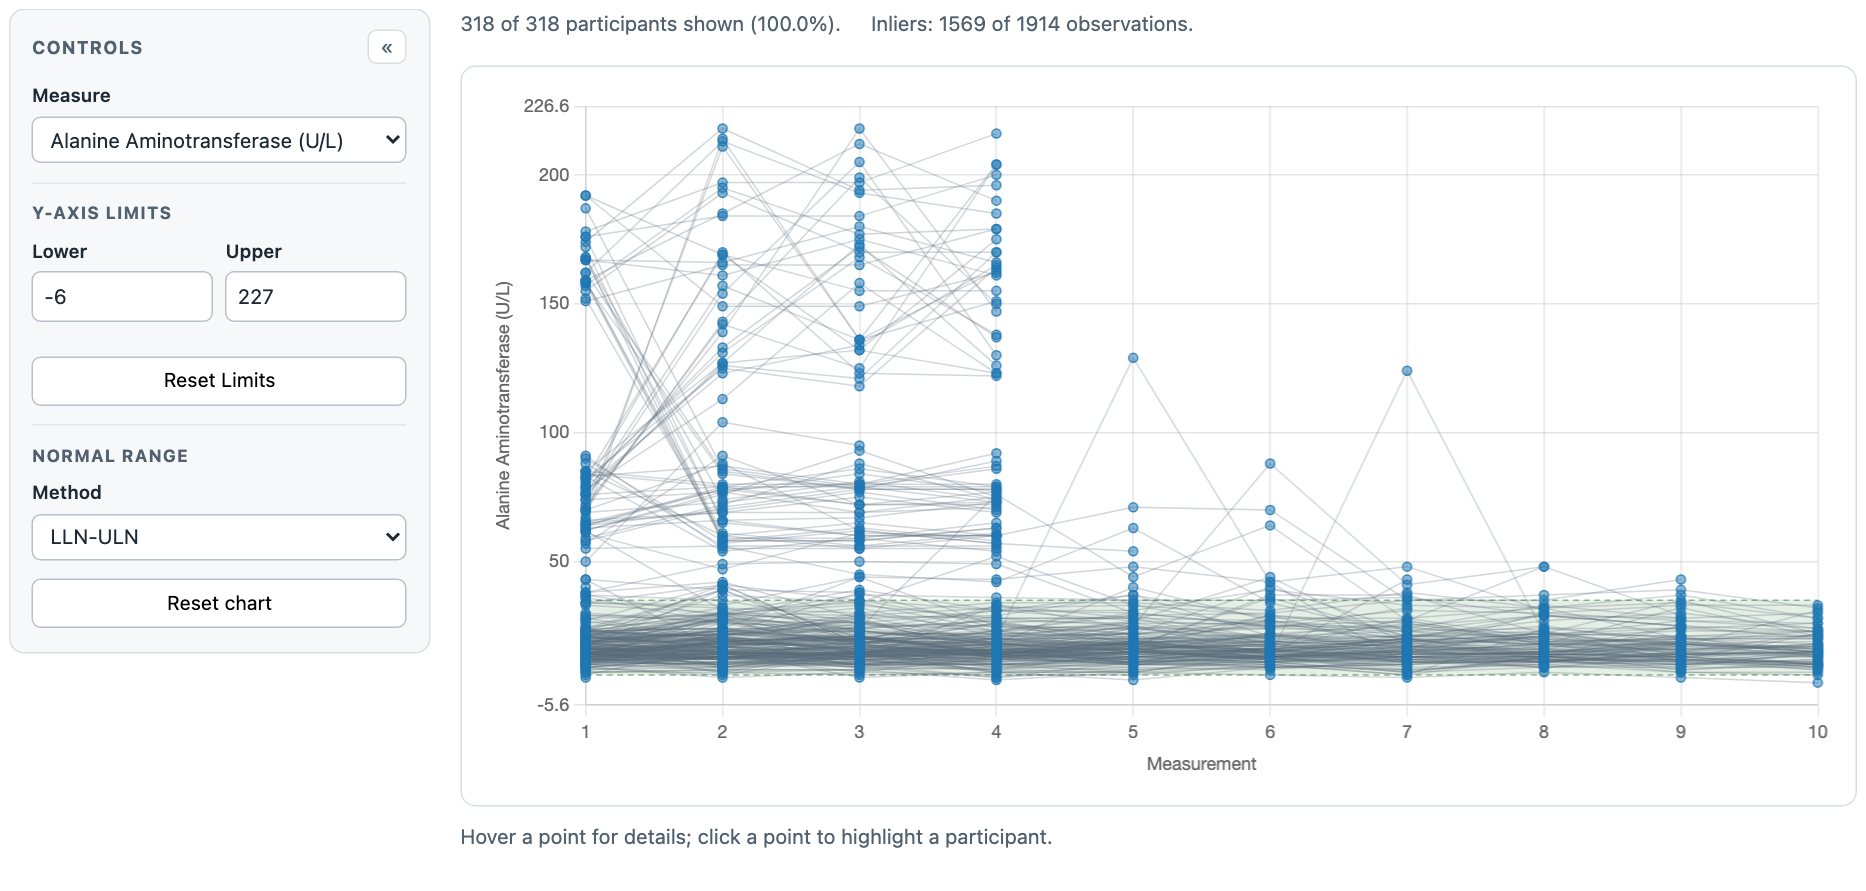
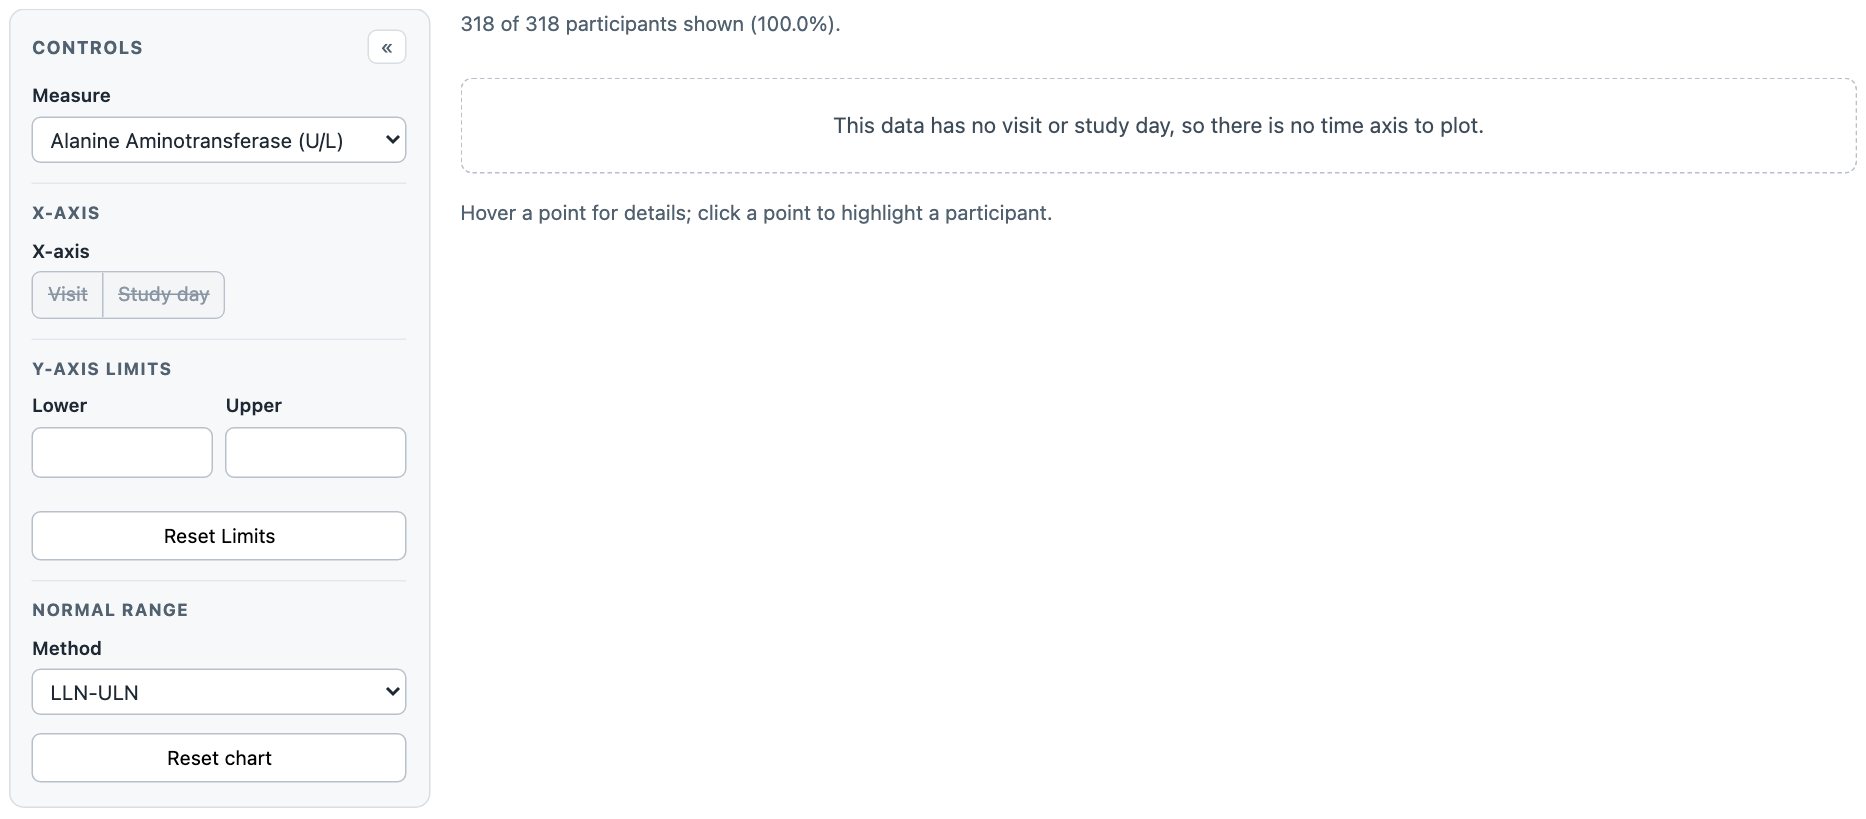
- In place of the chart: “This data has no visit or study day, so there is no time axis to plot.”
The outlier explorer. The participant profile shows the same message (read, not shown). Before, the profile drew an empty axis titled “Study Day”. Open the harness: release 1.12.0, release 1.11.3.
hep-explorer with no study day: crosses, and a footnote
With visits but no study day, the timing test cannot be run. Every point is drawn as a cross, neither filled nor hollow, and the chart says why. Shown in the harness: the gallery's demo data with its study-day column taken out.
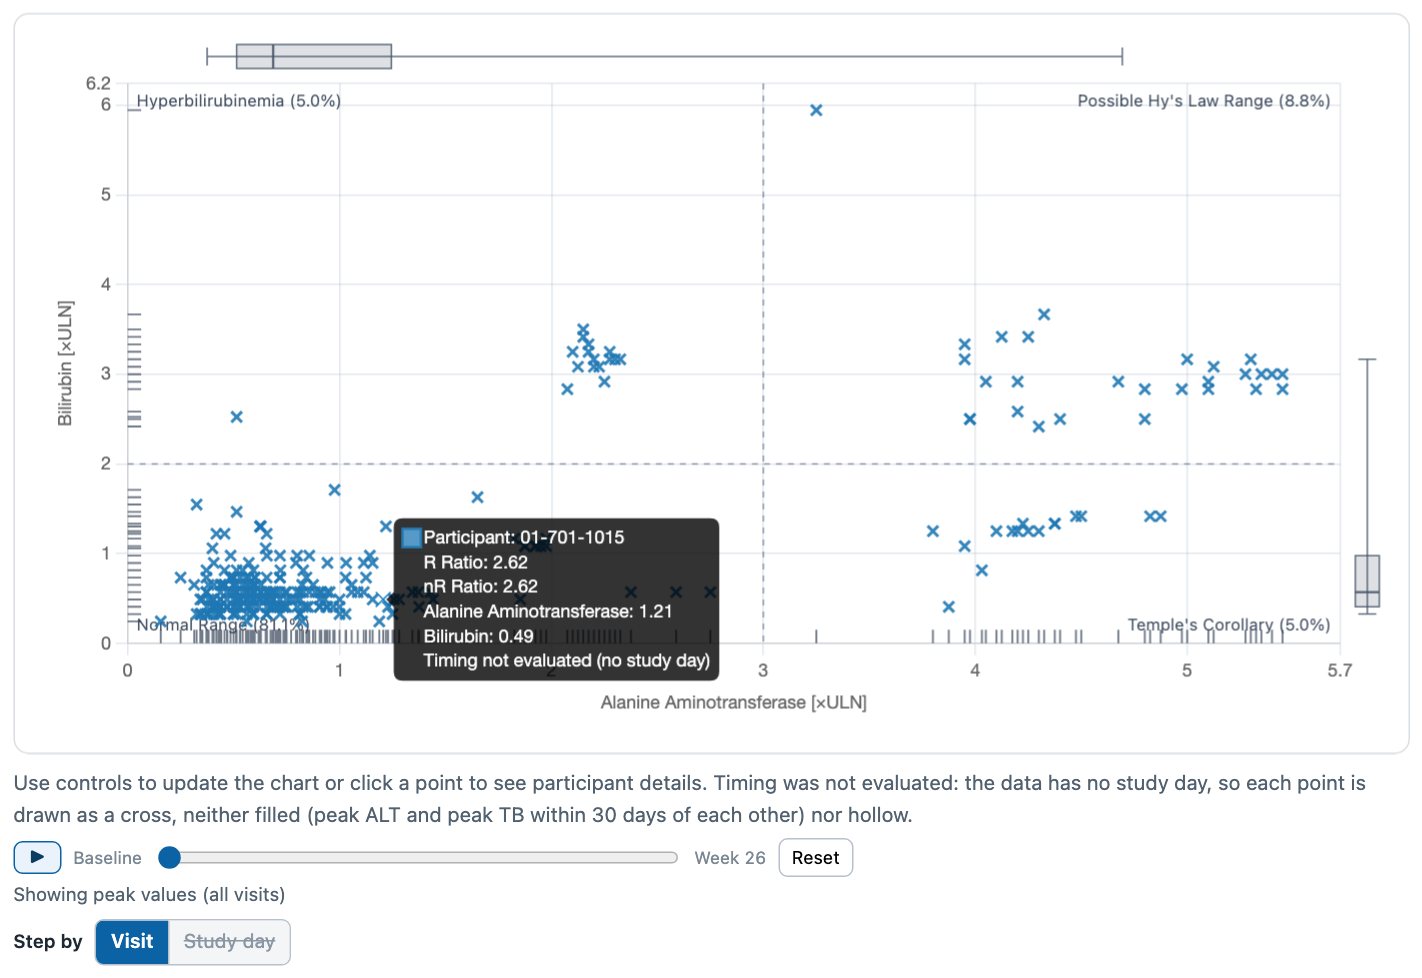
- A point's tooltip: “Timing not evaluated (no study day)”.
- The footnote: “Timing was not evaluated: the data has no study day, so each point is drawn as a cross, neither filled (peak ALT and peak TB within 30 days of each other) nor hollow.”
- Step by: Study day greyed, titled “No study day in this data”.
All 318 points are crosses, and the timing-window input (Highlight Points Based on Timing) is disabled. Before, release 1.11.3 drew all 318 filled, as if each had passed a test it never ran. Open the harness: release 1.12.0, release 1.11.3.
The demo app passes the toggle and remembers the view
The demo app's charts are given the same X-axis setting, built from the columns mapped on the Data tab. Each chart remembers the view you last chose while the page is open; a new page opens on each chart's own default.
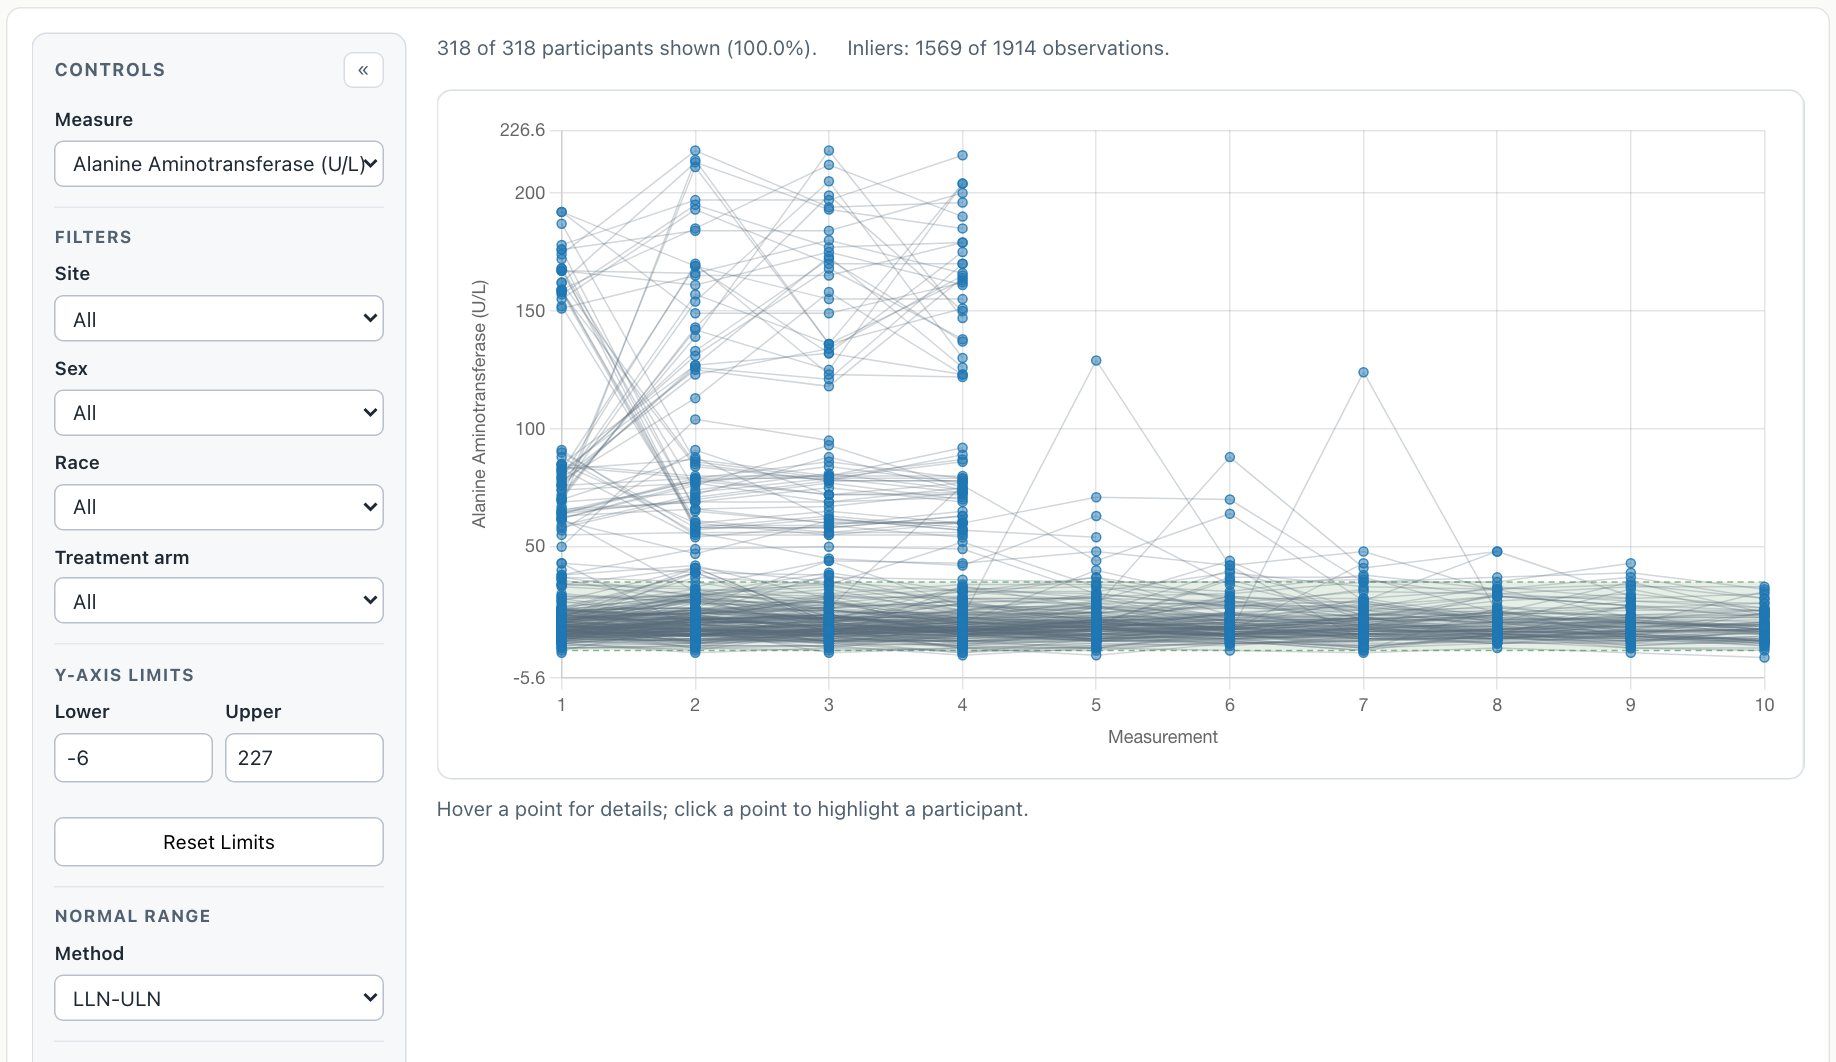
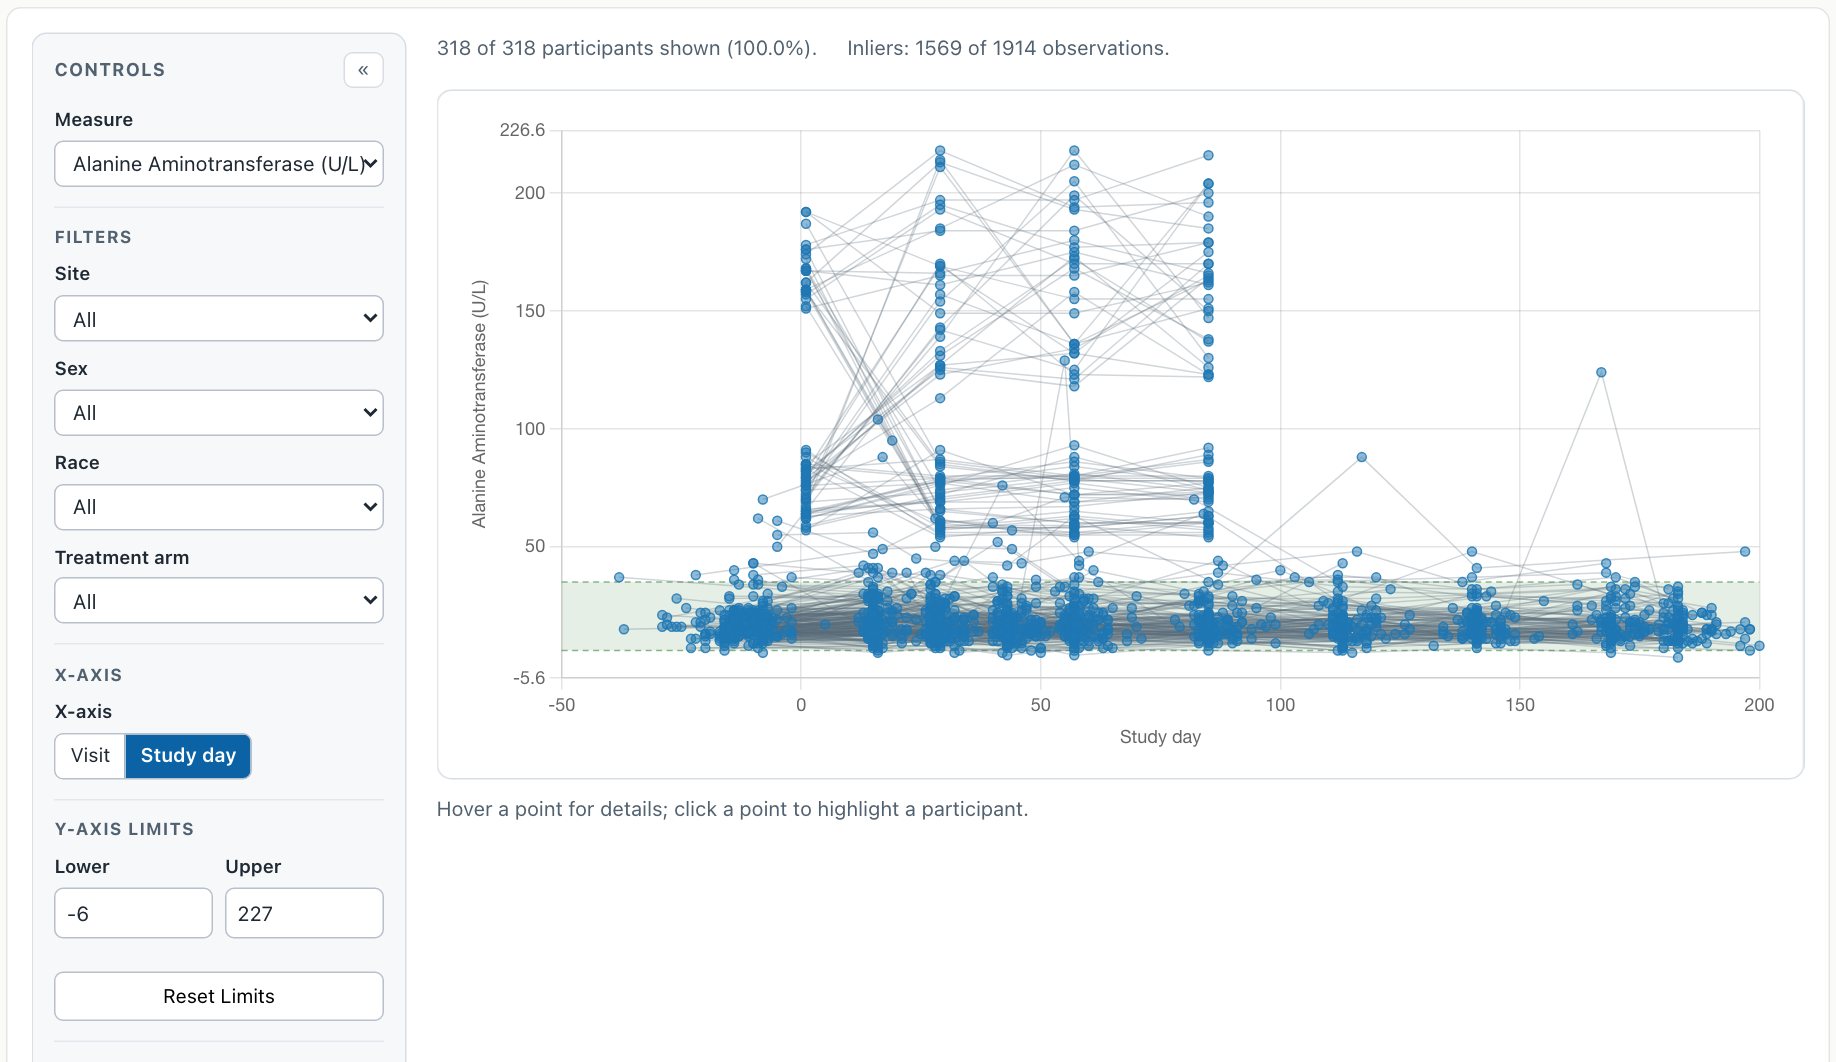
- Study day, still chosen after leaving the chart and coming back.
The Outlier Explorer opens on Visit. The capture pressed Study day, opened the Histogram, and came back: the chart was still on Study day. Clicking a participant then opened the side panel on Study day, with its own toggle.
- Open the demo app, choose Outlier Explorer and press Study day.The axis is in days.
- Choose Histogram, then Outlier Explorer again.Study day is still chosen. Reload the page, and it opens on Visit.
Four charts read the study day from DY by default
The histogram, outlier explorer, shift plot and delta-delta now look for the study day in a column called DY when they are not told otherwise. The outlier explorer also looks for the visit in VISIT and VISITNUM, so given no time setting it offers both views and opens on Visit. A page that names its own study-day column is unaffected; a page whose data has a DY column it did not mean as a study day should set it to none. The release notes say so.
| What | release 1.11.3 | release 1.12.0 (dev site) |
|---|---|---|
| Study-day column, given no setting | histogram: none, outlier: none, shift: none, delta: none | histogram: DY, outlier: DY, shift: DY, delta: DY |
| An outlier explorer given no time setting | plots a “Measurement” sequence | offers Visit | Study day, reading VISITNUM and VISIT for the visit, and opens on “Visit” |
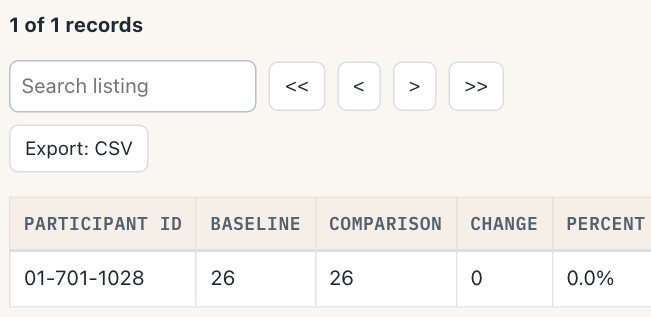
| Shift-plot listing columns | Participant ID, Baseline, Comparison, Change, Percent Change | Participant ID, Visit, Study day, Baseline, Comparison, Change, Percent Change |
| Shift-plot listing, data with no study day | not read | Participant ID, Visit, Baseline, Comparison, Change, Percent Change: no Study day column |
| Delta-delta tooltip, participant 01-701-1028 | Participant: 01-701-1028 Change in Alanine Aminotransferase: +0.00 Change in Aspartate Aminotransferase: +0.00 | Participant: 01-701-1028 Change in Alanine Aminotransferase: +0.00 Change in Aspartate Aminotransferase: +0.00 Visit: Baseline → Week 26 Study day: -8 → 180 |
The first two rows were read in the harness, each chart mounted with no settings beyond its measures (release 1.12.0, release 1.11.3); the fourth on the gallery data without its DY column (harness). The others were read on the gallery pages.
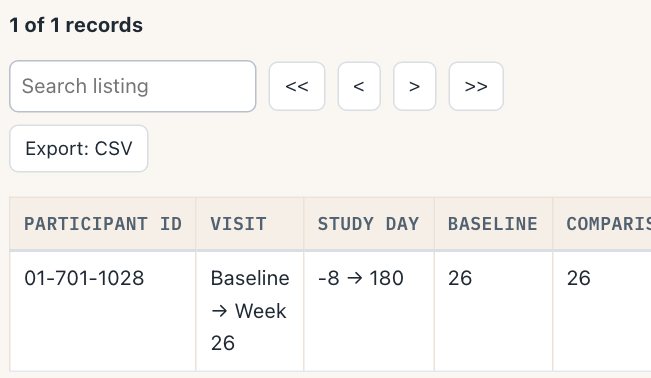
- Study day: “-8 → 180”, beside Visit: “Baseline → Week 26”.
The shift plot, Baseline against Week 26, participant 01-701-1028 selected. Delta-delta's tooltip now adds “Study day: -8 → 180” under “Visit: Baseline → Week 26”.
- The AE explorer and AE timelines side panels have no X-axis toggle. They show adverse events only, which are drawn in days, so they open on Study day. A Visit option there would have nothing to draw. The requirement's definition of done asked for an X-axis control in all eight hosts; six have one. Whether they should take one is split out for later. (safety.viz pull request #379) (the AE panels’ toggle, safety.viz #385)
- The baseline flag (
baseline_col) is not forwarded to the side panels of the histogram, outlier explorer, shift plot and delta-delta in this release; it is split out for later. (safety.viz #386) - hep-explorer's control is labelled "Step by", not "X-axis": the scatter's own axes are ALT and bilirubin, and the control changes only what the slider steps through. Points whose timing was not evaluated are drawn as crosses, and the timing-window input is disabled. (safety.viz pull request #381)
- The data pull request says participant 01-701-1028's last ALT on the profile demo moved from 13 to 180. On the gallery's participant profile page, release 1.11.3 put it at 183, a day worked out from the visit name. The 13, a visit number, is what the side panels plotted. (safety.viz pull request #378)
- Switching the outlier explorer's main axis clears the selected participant and closes the side panel.
- Not captured here: the Visit and Study day columns added to the hep-explorer and hep-waterfall listings (safety.viz #377), and the gsm.safety widgets, which follow in their own release (hub #438).
The requirements
- The objective: firm up the tools for the ISG relaunch (hub #429).
- Both visit and study day in the demo data (hub #435).
- One x-axis toggle between Visit and Study day (hub #436).
- hep-explorer's slider and 30-day timing in study days (hub #437).
- The design, approved 11 November (the x-axis toggle design).
The tasks and pull requests
- Demo data: the visit, study day and baseline flag (#365); the synthetic cohorts' days and one visit numbering (#366); the baseline rule reads the flag (#367). Pull request (#378).
- The toggle: one setting and control (#368); the profile (#369); the side panels (#370); the outlier explorer (#371); the QT drill-down (#372); the demo app (#373); axis names on the charts without it (#374). Pull request (#379).
- hep-explorer: the slider (#375); timing on study days only (#376); both columns in the liver listings (#377). Pull request (#381).
- Release preparation (#380), pull request (#382); the release notes; the release candidate (pull request #383); what its review found (#384), fixed in pull request (#387).