Test evidence
Correlation matrix
Every requirement of this module, the tests named for it, and what each test recorded the last time the evidence was rebuilt.
Summary
- Requirements
- 74
- Tests named for them
- 77 (25 unit, 52 browser)
- Result
- pass every test passing
- Screenshots
- 18
- Recorded
- 2026-10-04 19:02 UTC
- Environment
- linux 6.17.0-1022-azure · node v22.23.3 · playwright 1.61.1 · chromium 149.0.7827.55
The requirements are the rows of the module’s requirement matrix. A test is named for a requirement by starting its name with the requirement’s ID. The results are read from the committed evidence set; continuous integration reruns every test and fails when the committed set no longer matches.
Requirements and their tests
CM-KIT-001 pass
The chart is built from
SafetyViz.kit, found on the page: safety.viz's bundle and bio.viz's are two script tags, the shell, the sidebar and the controls are the kit's, and the small scatters are drawn with the kit's Chart.js constructor. On a page without safety.viz the chart refuses to be made, with a message saying thatSafetyViz.kitwas not found.CM-KIT-002 pass
bio.viz's committed bundles export
correlationMatrix, hold none of safety.viz, no Chart.js and no webR, and defining the chart needs no safety.viz.CM-KIT-003 pass
The chart is built from the parts every chart shares, in
src/shared/, and none of them is written a second time in its own files. Of another chart it imports one thing: the association scatter's public function, the one a page calls, to open a pair. It imports nothing under that chart's folder and nothing of the group comparison chart, and neither of those charts imports anything of this one. How a variable is written in settings and in a request is written once, insrc/shared/variables.js, for the scatter and the grid alike.CM-KIT-004 pass
The chart's source holds no statistical inference: no arithmetic of a correlation, an interval or a p-value is written in it, and nothing in it orders the pairs or the variables by a coefficient. What it works out from a coefficient R returned is a mark's width and lightness and the number to two decimals, and from the page, how wide a cell is.
CM-CFG-001 pass
The chart has the settings the reference lists, with these defaults: the core's column and baseline settings;
modebiomarkers, withvisit,biomarkers,measureandvisitsnull, so it opens on every biomarker at the first visit;value_typeraw;viewgrid;limit12;statisticAnalyze_CorrelationMatrix;methodpearson; andmin_pairsnull, which leaves the minimum to R.CM-CFG-002 pass
A setting that is not known, or a value a setting cannot take, is refused with a
TypeErrorwhose message beginsbio.viz:and names the setting; a list given as one name is taken as a list of one.CM-DATA-001 pass
Across biomarkers the grid's variables are the biomarkers chosen, in the Biomarkers control's order, each at the one visit and with the one value type; a baseline value is read with no visit. They are named
v1,v2, … in the grid's order.CM-DATA-002 pass
Across visits the grid's variables are the visits chosen of one biomarker, in visit order. For a change, a fold change or a percent change the one baseline visit is left out, because there the value is the same for everyone, and the chart says so; for a baseline value the chart says there is nothing to relate across visits.
CM-DATA-003 pass
The frame is the core's, one variable per column with none required: a participant who has some of the grid's values is kept, with a gap for each they have not. A participant with none is left out and counted. The filters choose participants before the frame is made.
CM-DATA-004 pass
With fewer than two variables, or across biomarkers for a change at the one baseline visit, there is no grid, and the chart says why and what to choose.
CM-DATA-005 pass
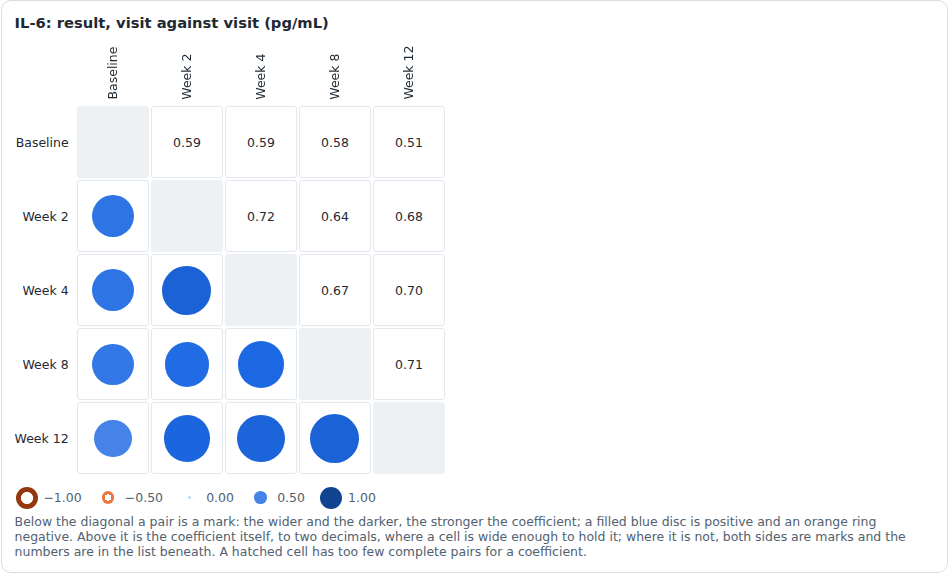
Every pair has two cells, one on each side of the diagonal: above it the pair is given as its number and below it as a mark; a cell on the diagonal is a variable with itself and holds nothing. A pair is found by its two variables in either order.
CM-DATA-006 pass
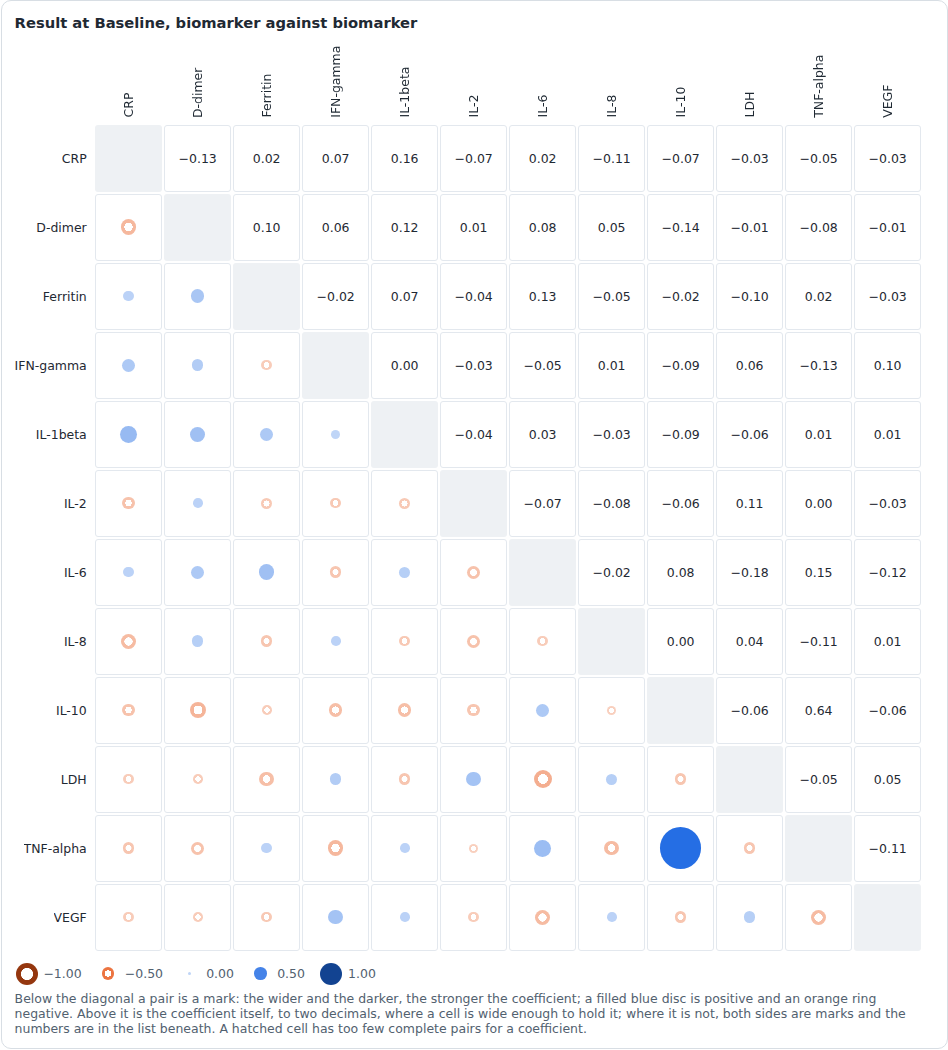
A mark is read off the coefficient R returned and nothing else: its width and its darkness both grow with the coefficient's size, equally for either sign, so it reads without its colour; the sign is the hue, and the shape as well, a filled disc for positive and a ring for negative. A number is printed to two decimals with a true minus sign, and nought is never minus nought.
CM-LIMIT-001 pass
The grid draws at most
limitvariables at a time, the first of those chosen in the control's order, and says how many it shows of how many and how to bring others in; with no more chosen than the limit it says that all are shown. On the fixture of thirty-six biomarkers the default draws twelve.CM-LIMIT-002 pass
On the fixture of thirty-six biomarkers the chart opens on the first twelve, 66 pairs, asks R for those twelve alone, and says
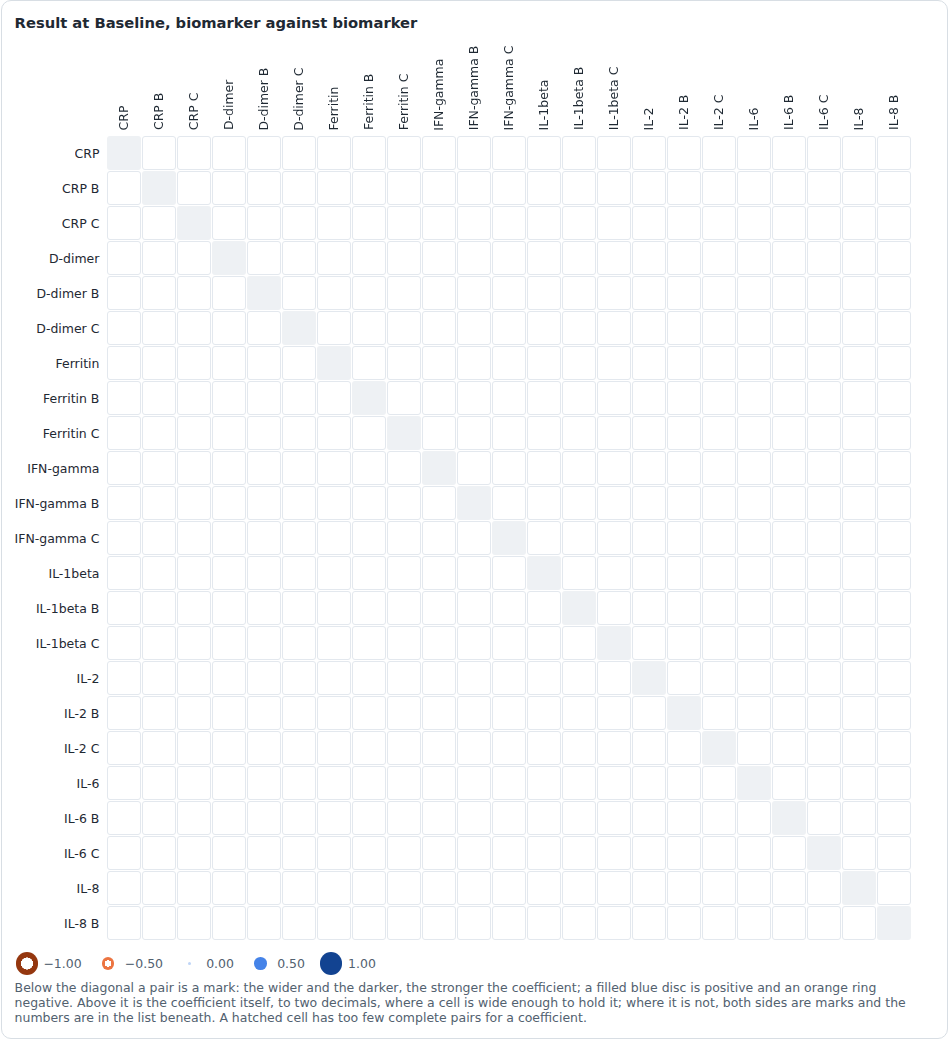
12 of 36 biomarkers shownwith how to choose others; unticking biomarkers brings others in. Withlimitraised it draws 276 and then all 630 pairs, in cells too narrow for numbers. How long each size takes to draw is measured and recorded.- pass browser CM-LIMIT-002: thirty-six biomarkers open on the first twelve, 66 pairs, and the chart says so and how to choose others; unticking brings others in; with the limit raised it draws all 630 pairs, too narrow for numbers; the drawing is timed (#27)
CM-LIMIT-003 pass
A cell is as wide as the room allows, between 18 pixels and 72. Below 34 pixels a cell cannot hold a number, and both sides of the diagonal are then marks.
CM-CTRL-001 pass
The sidebar offers what the design asks: which of the two the grid relates, the value type, the visit and the biomarkers or the biomarker and the visits, how the pairs are drawn, the method, the minimum pairs for a cell, a filter per category column of the participant table, and Reset chart. The controls under Relate are the mode's own, and a baseline value has no Visit control.
CM-CTRL-002 pass
A change to the mode, the value type, the visit, the biomarkers, the biomarker, the visits or a filter draws the grid again for what was chosen, and Reset chart returns every control to what the chart opened on.
CM-CTRL-003 pass
With the setting
statisticnull the chart has no Statistics controls, asks R for nothing and draws the grid's frame with empty cells.CM-DRAW-001 pass
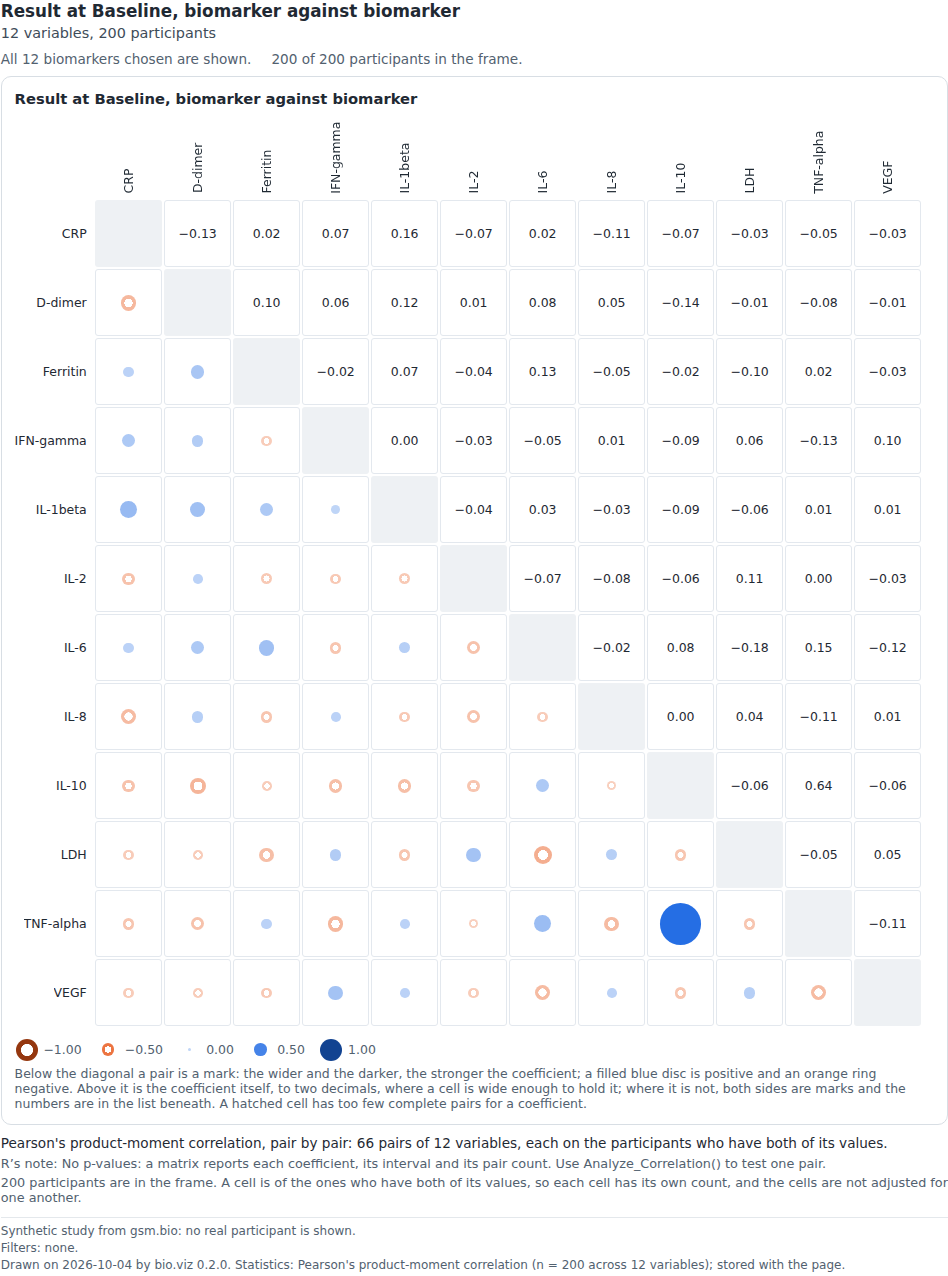
The chart opens on every biomarker the limit allows at the first visit: the heading says what the variables are, they are named along the top and down the side, and each pair below the diagonal is a mark whose width and colour are those of R's coefficient for it and above the diagonal R's coefficient to two decimals.
- pass browser CM-DRAW-001: it opens on every biomarker at the first visit: a mark below the diagonal whose width and colour are those of R’s coefficient, and R’s coefficient above it (#27)
CM-DRAW-002 pass
Every cell gives its pair count: its name and its title say the pair, the coefficient by its name with the interval R gave, and the number of complete pairs, and the same sentence is written under the grid while the pointer or the keyboard is on the cell. A cell on the diagonal says how many participants have a value for its variable, as R counted them.
CM-DRAW-003 pass
A key under the grid shows the mark for −1, −0.5, 0, 0.5 and 1 and says in words what width, darkness, colour and shape mean. Drawn in greyscale the marks of the key still differ by size and by lightness in the order of the coefficient's size, and by shape between the signs.
- pass browser CM-DRAW-003: a key shows the mark for −1, −0.5, 0, 0.5 and 1 and says what width, darkness, colour and shape mean; in greyscale its marks still differ by size, by lightness and by shape (#27)

CM-DRAW-004 pass
No p-value is printed anywhere in the chart, for either method: not in a cell, its name, the line under the grid, the list or the download.
CM-DRAW-005 pass
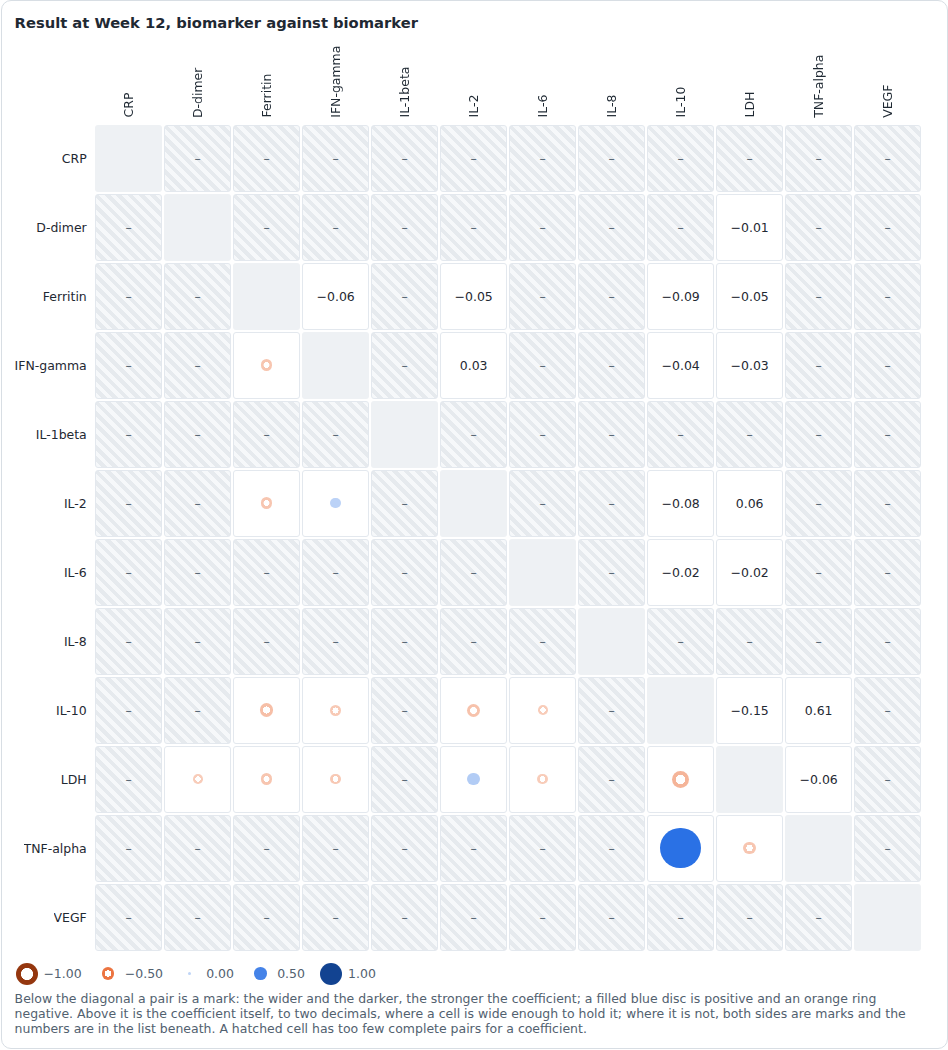
A cell with fewer complete pairs than the minimum shows R's reason and no number: it is hatched, holds a dash, and its name and the list give the reason as R worded it with the pair's count. The cells R did answer are drawn as ever.
- pass browser CM-DRAW-005: a cell with fewer complete pairs than the minimum shows R’s reason and no number, and the cells R did answer are drawn as ever (#27)
CM-DRAW-006 pass
Across visits the grid is one biomarker's visits in visit order; for a change from baseline the baseline visit is not a variable, and the note says so.
- pass browser CM-DRAW-006: across visits the grid is one biomarker’s visits in visit order; for a change from baseline the baseline visit is not a variable, and the note says so (#27)
CM-DRAW-007 pass
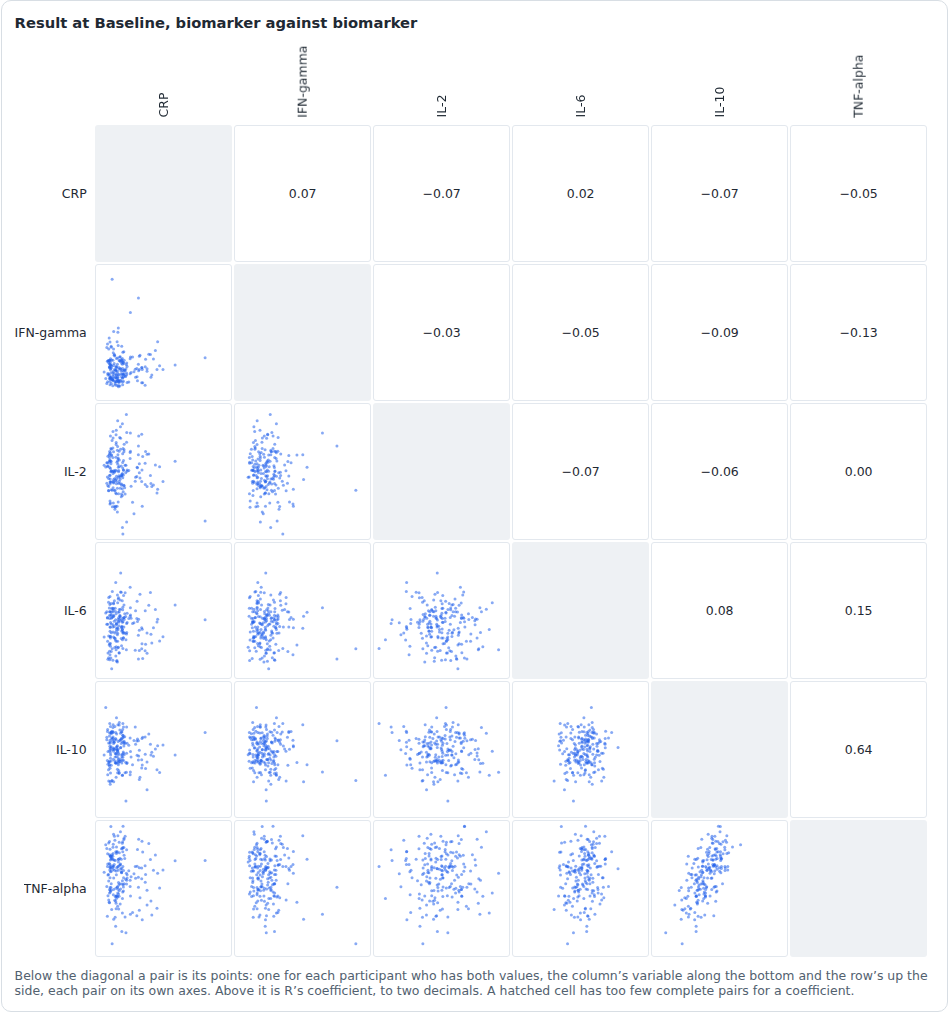
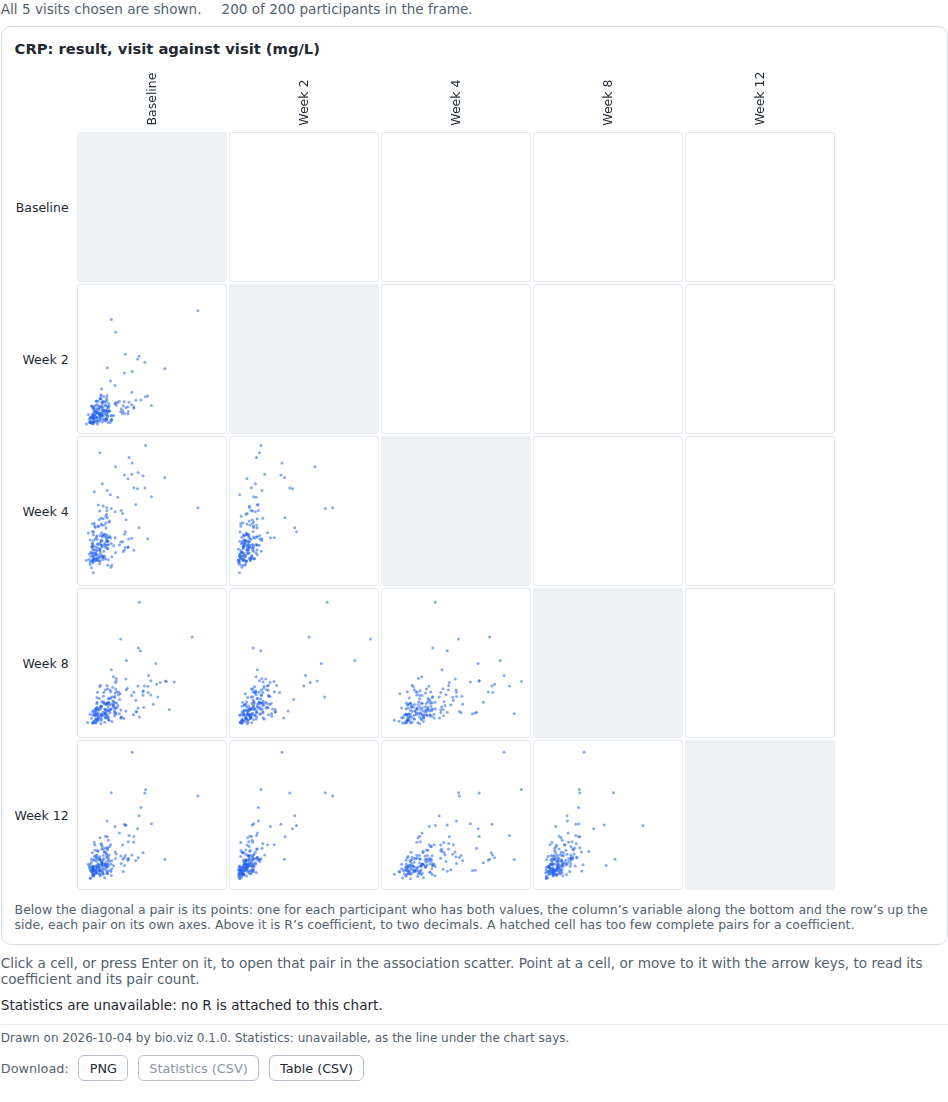
For six variables or fewer the pairs can be drawn as small scatters: below the diagonal each pair is its points, one per participant who has both values, above it R's coefficient. The view asks R for nothing more than the grid does, and it is not offered for more than six.
- pass browser CM-DRAW-007: for six variables or fewer the pairs can be drawn as small scatters, one point per participant with both values, with R’s coefficient above the diagonal; the view asks R nothing more, and is not offered for more than six (#27)
CM-DRAW-008 pass
Above the grid the chart says how many participants are in the frame of how many, and how many were left out for having none of the grid's values; under it, that each cell is of the participants who have both of its values and so has its own count. Where participants have gaps the cells' counts differ, and each is R's.
CM-FILTER-001 pass
On the demo, filters with nobody in common leave the chart reading
No participant passes the filters., in the words every chart uses, with the note that none of the participants pass; no grid and no list are drawn, R is asked nothing, the filters and Reset chart stay usable, nothing is written to the console, and loosening a filter draws again.CM-FILTER-002 pass
A filter reads its spec by the rule safety.viz's charts follow, through the kit's
reconcileFilters:startsets what it opens on and All is still offered; onlyall: falseremoves All, and its first value is then the one in force; a value the data lacks falls back to All with a console warning naming the filter; and the selection each control shows is the selection the chart filters by.CM-LIST-001 pass
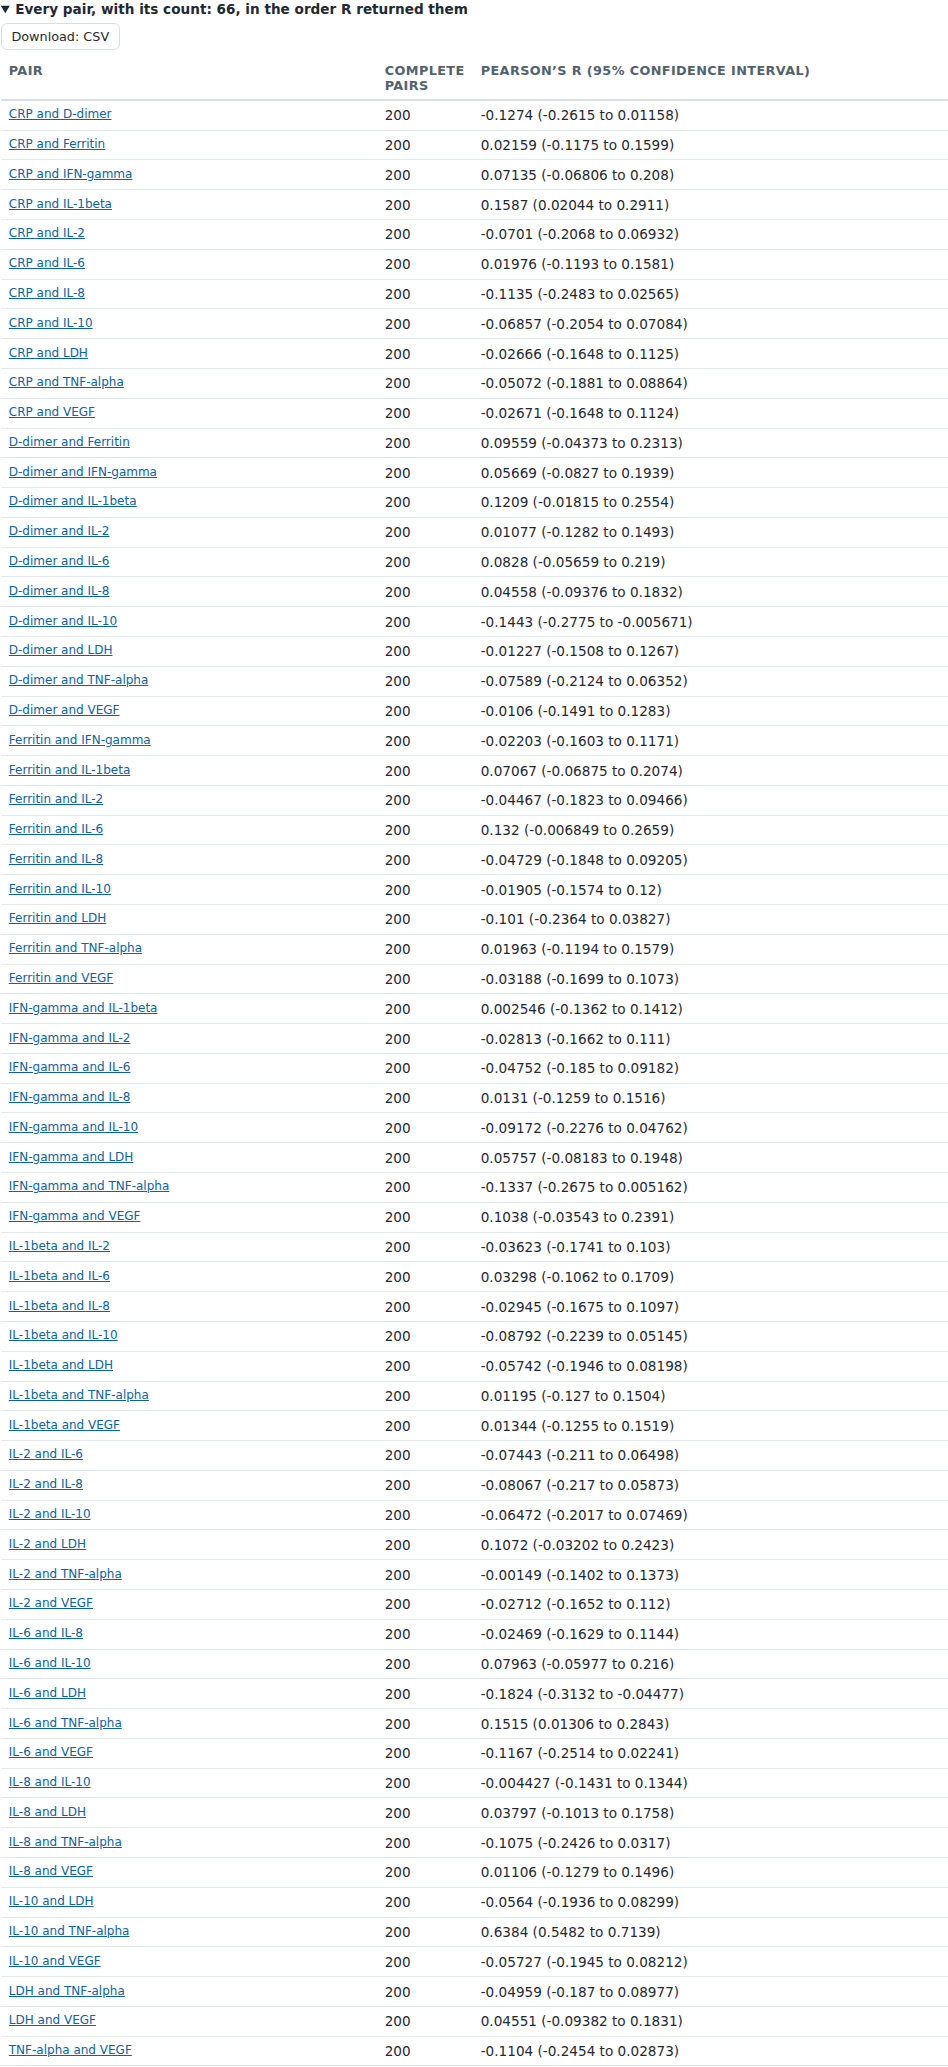
Under the grid is a list of every pair R returned, in R's order, each with its count and its coefficient with the interval R gave, or R's reason where it computed none. A pair's name in the list opens the pair as its cell does.
- pass browser CM-LIST-001: under the grid is every pair R returned, in R’s order, with its count and its coefficient with R’s interval; a pair’s name opens the pair (#27)
CM-LIST-002 pass
The list downloads as a CSV file under this chart's name, with the same three columns.
CM-STAT-001 pass
The grid asks R once, whatever the number of cells: the function named in
statistic, the frame, the names of the frame's columns aschrColsand the method asstrMethod.nMinPairsis sent only when the reader set a minimum; otherwise the argument is left out and R's own default applies. The identity of the frame names the chart, the variables in order as the settings write them, the baseline settings and the filters in force.- pass unit correlation matrix: what R is asked CM-STAT-001: one request for the whole grid: the function, the frame, the names of its columns and the method; a minimum only when the reader set one; and an identity that names the chart, the variables in order, the baseline settings and the filters in force (#27)
CM-STAT-002 pass
R's answer is described without computing anything: the method as R names it and how many pairs it returned; R's notes and warnings as R worded them; R's reason in place of the line where no pair has enough complete pairs; R's error as an error; and a result that names no method is refused.
- pass unit correlation matrix: how R’s answer is described CM-STAT-002: the method as R names it and how many pairs it returned; R’s notes and warnings as R worded them; R’s reason where no pair has enough; R’s error as an error; and a result with no method is refused (#27)
- pass unit correlation matrix: how R’s answer is described CM-STAT-002: with no R the line says statistics are unavailable, with stored results a view not stored says so, and the desk waits and never shows an answer to the question before (#27)
CM-STAT-003 pass
A cell's sentence is made by the shared formatter from the pair's row: the two variables by their labels, the coefficient by the name of the method asked for, the interval at the level R gave or none where R gave none, and the count. A row's p-value, if a result carried one, is neither read nor printed.
CM-STAT-004 pass
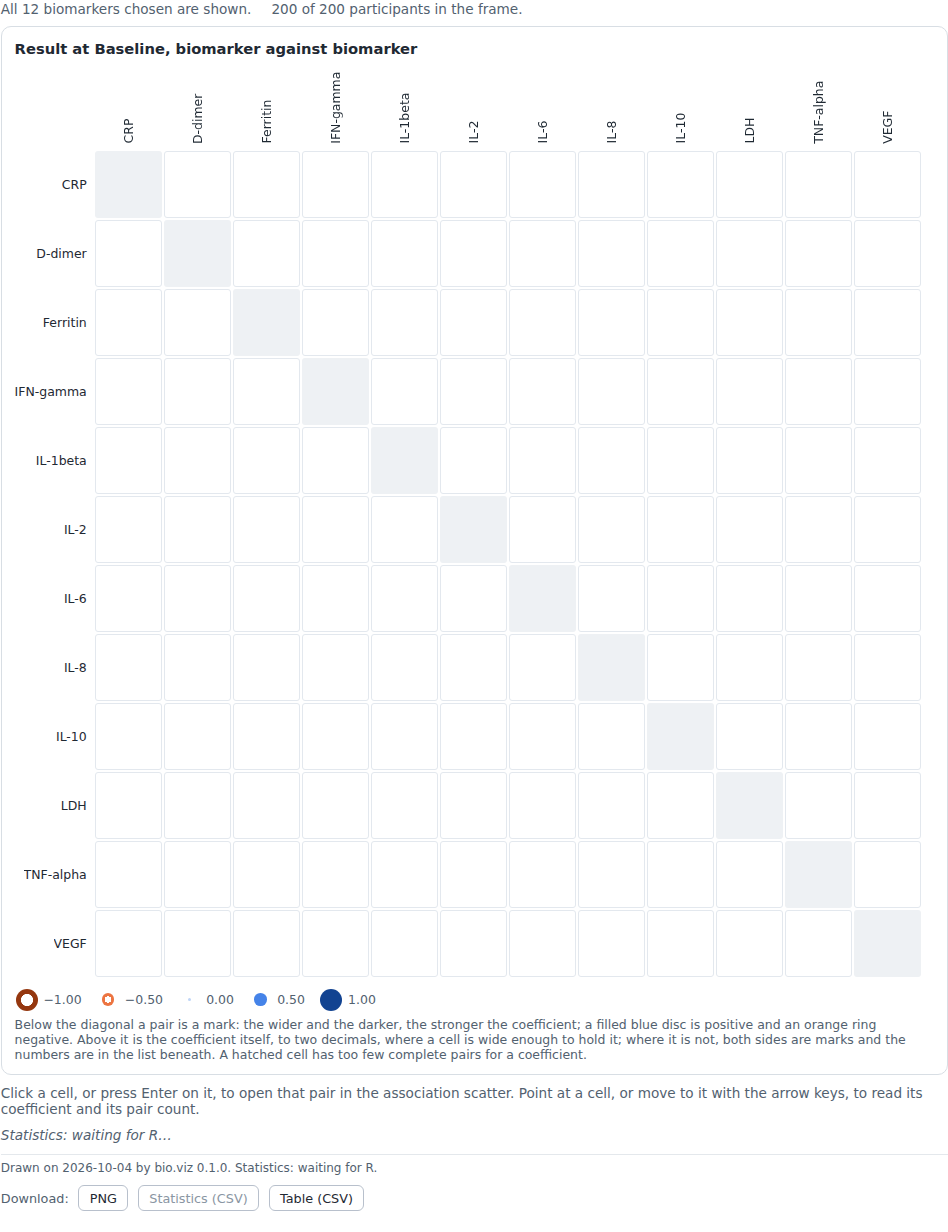
From the moment the grid is asked for until R answers, the line reads that it is waiting, with the page's note until R has answered once, and every cell is empty; then the cells, the list and the line are filled from R's answer.
- pass browser CM-STAT-004: until R answers the line reads that it is waiting, with the page’s note until R has answered once, and every cell is empty; then the cells, the list and the line are filled from R’s answer (#27)
CM-STAT-005 pass
A change to the mode, the value, the visit, the variables, the method, the minimum or a filter clears the cells, the list and the line and asks R again; an answer to the question before is dropped when it arrives, and is never shown.
CM-STAT-006 pass
With no R attached the grid's frame is drawn, with its variables and empty cells that still open their pairs, no coefficient and no list, and the line says that statistics are unavailable; nothing is fetched to say so.
- pass browser CM-STAT-006: with no R attached the grid’s frame is drawn with empty cells that still open their pairs, no coefficient and no list, and the line says that statistics are unavailable; nothing is fetched to say so (#27)
CM-STAT-007 pass
With R's answers stored in the page the grid is filled from them with no R and no request; a view no result was stored for says so and its cells stay empty, never filled with another view's numbers.
CM-STAT-008 pass
chart.statistics()returns what the chart asked R for the grid now drawn and what R answered: one entry, with the function, the arguments, the identity and the number of rows.CM-STAT-009 pass
For every case of the expected results, the function, the arguments, the identity and the row count that R wrote by the recipe in the reference are the ones the chart asks with; handed to a connection as stored results each is found by the chart's request, and by no other view's.
- pass unit what desktop R answered, and the key it wrote CM-STAT-009: for every case the function, the arguments, the identity and the row count R wrote by the recipe are the ones the chart asks with, and the recipe in the reference is the script’s (#27)
- pass unit what desktop R answered, and the key it wrote CM-STAT-009: handed to a connection as stored results, each of R’s answers is found by the chart’s request for its view, and by no other view’s (#27)
CM-STAT-010 pass
The frames desktop R is run on are written by the chart's own code from the demo's own tables and settings, and committed; deriving them again gives the committed files. A gap is an empty cell.
- pass unit the frames R is run on CM-STAT-010: a frame is the chart’s: one row per participant, the id and one column per variable of the grid, a gap an empty cell, and the demo’s settings read from the demo’s own script (#27)
- pass unit the frames R is run on CM-STAT-010: deriving each case’s frame again, with the chart’s own code from the demo’s own tables and settings, gives the committed files (#27)
CM-STAT-011 pass
The expected results name the script, the R version and the vendored statistics file that made them, and hold one result per case: both methods, both modes, gaps, a filter, a minimum some cells fall under and a view where every cell does. None of them holds a p-value.
CM-STAT-012 pass
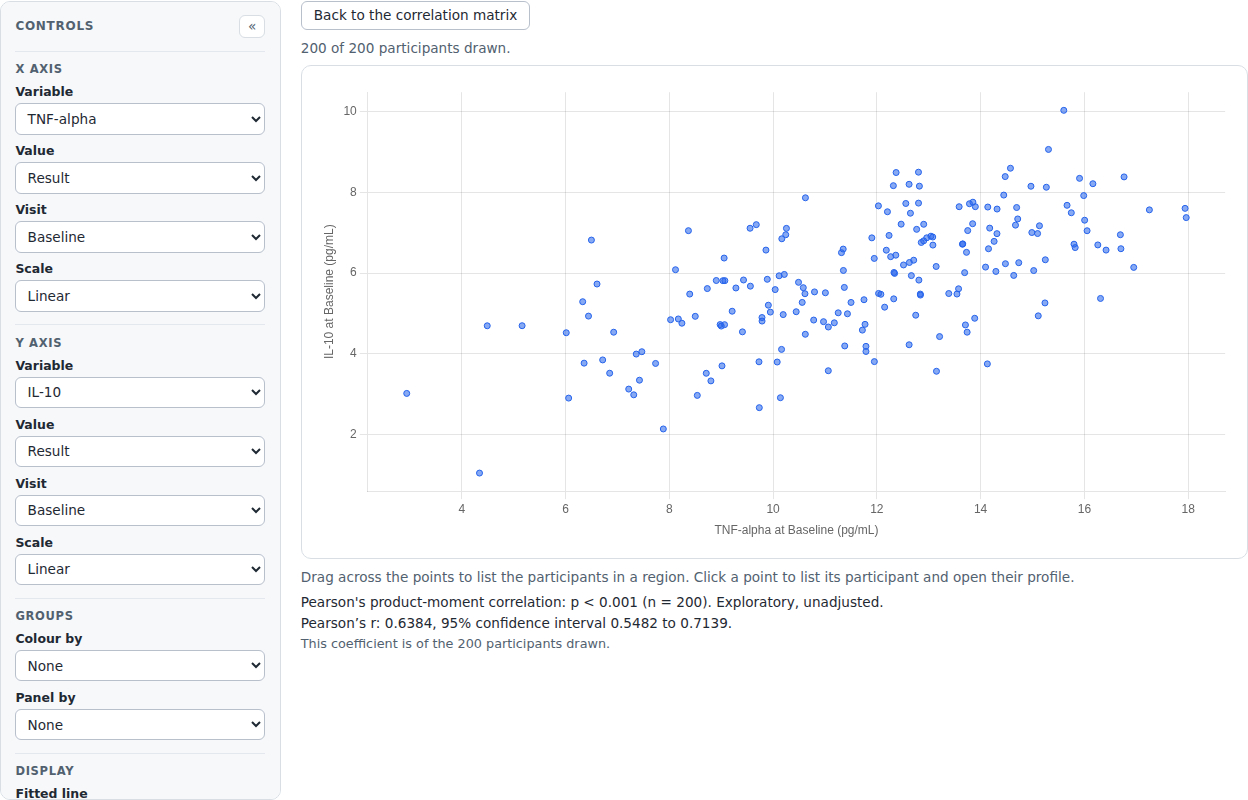
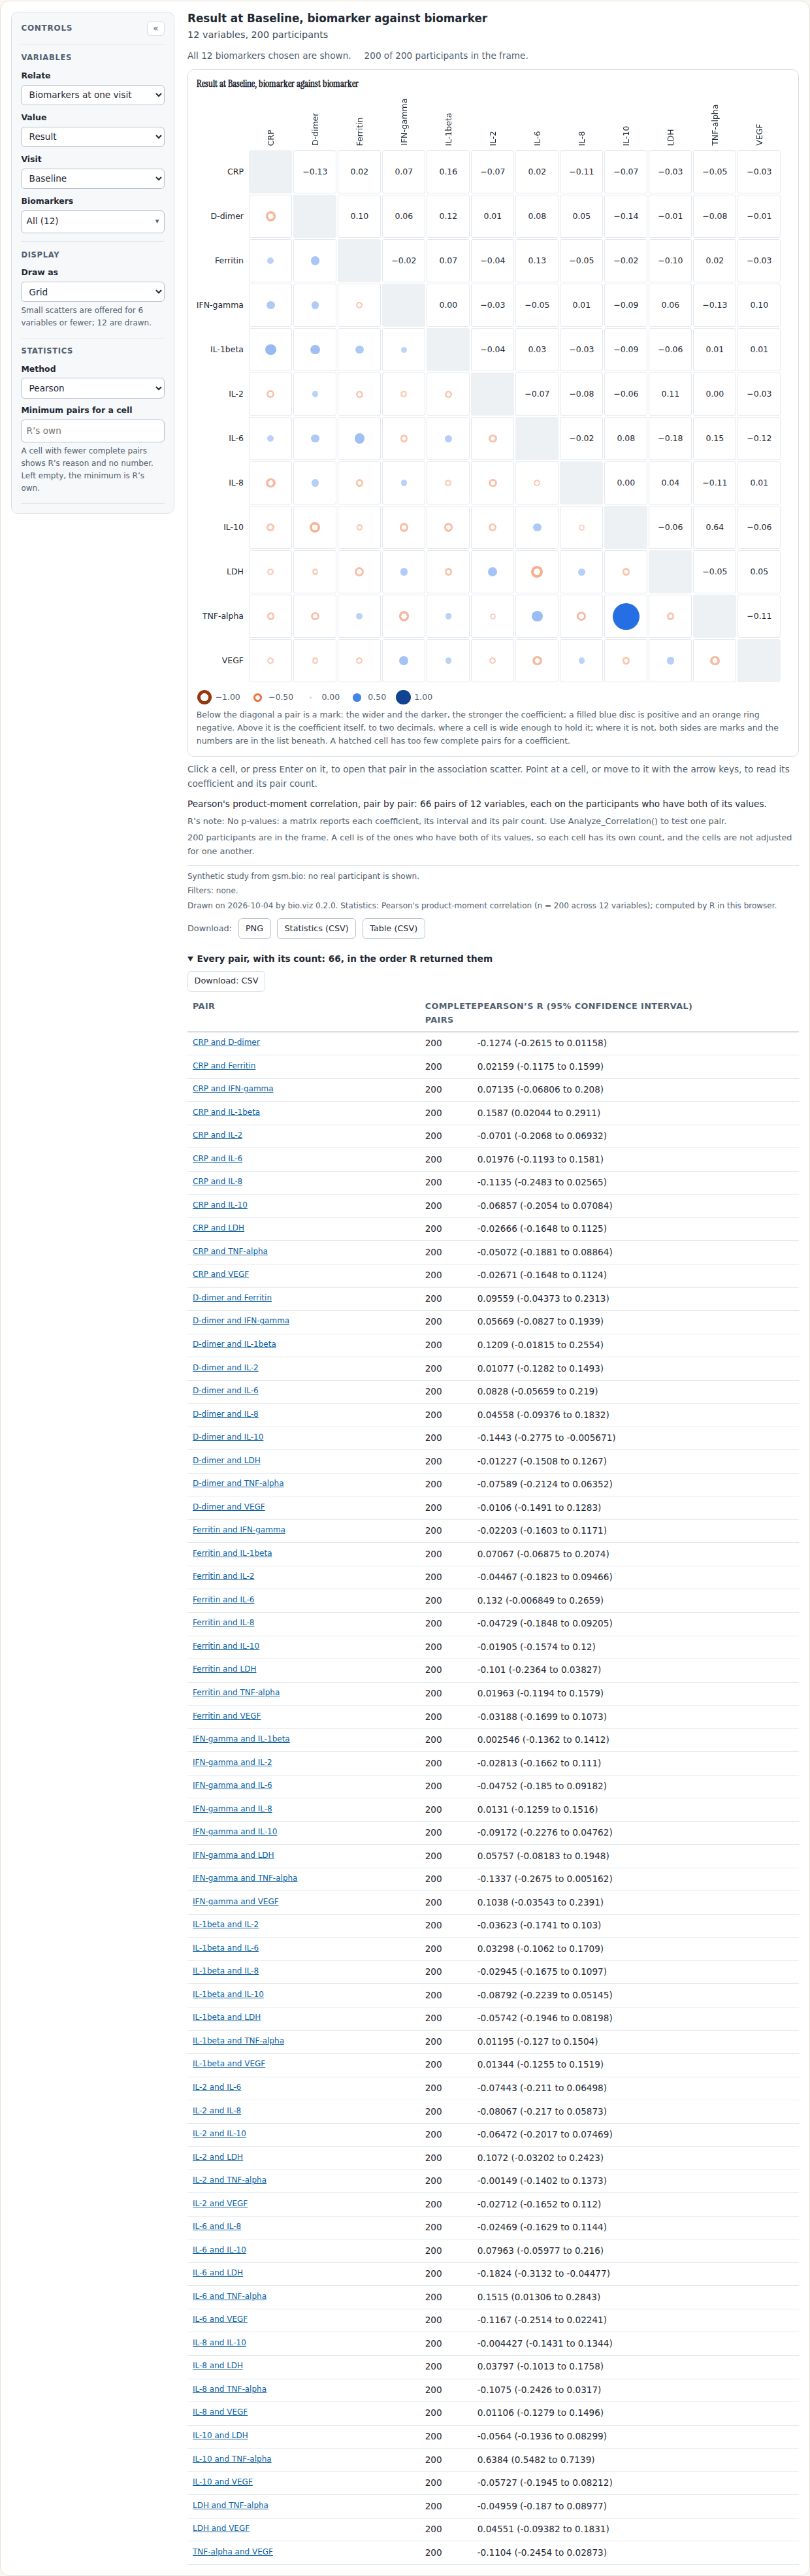
In desktop R's grid of every biomarker at Baseline, the cell of the planted pair, TNF-alpha with IL-10, holds 0.6 inside its interval, on all 200 participants.
CM-STAT-013 pass
For Spearman the cells and the list give R's rho with no interval, none being made up, and R's note that it reports none is printed with R's warning, as R worded them.
CM-STAT-014 pass
Where no pair has enough complete pairs the line prints R's reason and no number, every cell is hatched with its own reason, and the list gives each pair's count.
CM-DRILL-001 pass
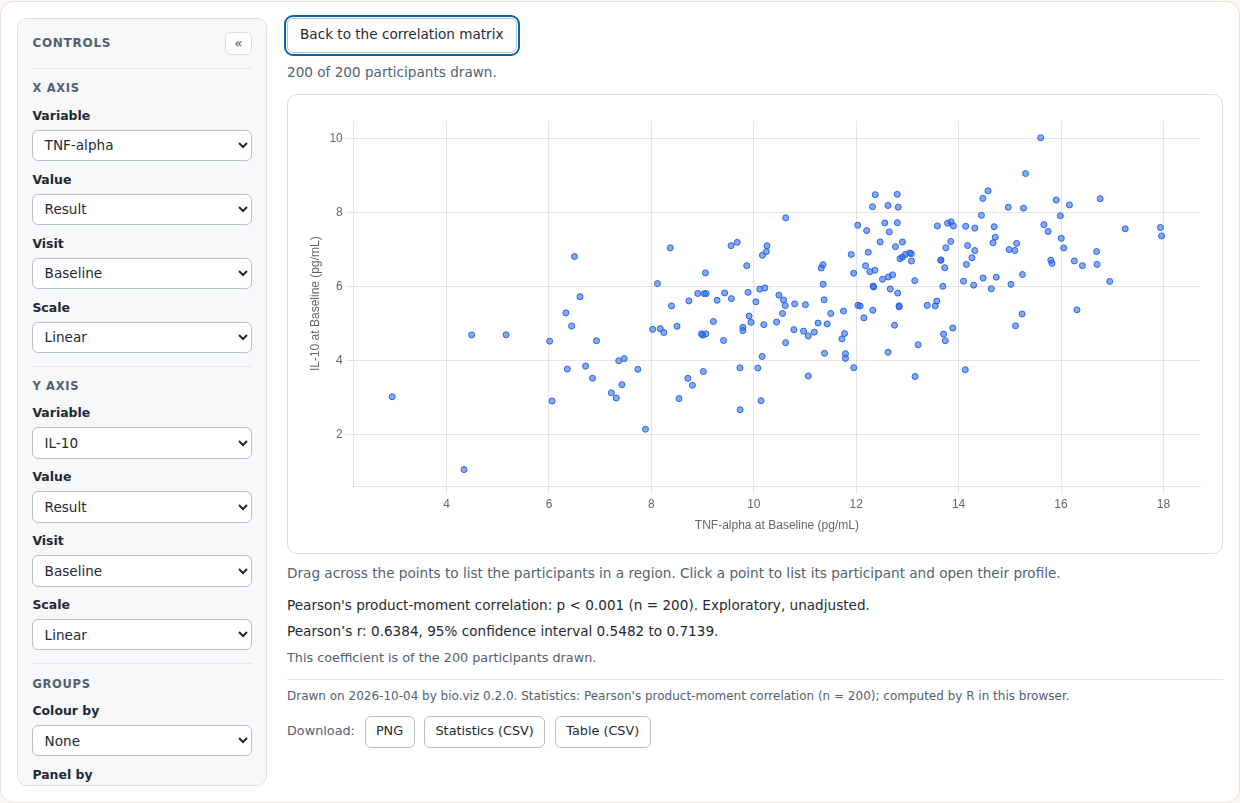
A click on a cell opens the association scatter for that pair in place of the grid: the column's variable on its x axis and the row's on its y axis, with a button back to the correlation matrix, which takes the keyboard's place.
- pass browser CM-DRILL-001: a click on a cell opens the association scatter for that pair in place of the grid, the column’s variable on its x axis and the row’s on its y axis, with a button back that takes the keyboard’s place (#27)
CM-DRILL-002 pass
From the keyboard the arrow keys move among the cells, stepping over the diagonal, and Enter or Space on a cell opens its pair; Enter or Space on the button back returns to the grid.
CM-DRILL-003 pass
The scatter is handed the grid's connection itself, its method, its column settings and its filters as they are set, and whatever the setting
scattergives it beneath those. With results stored in the page the scatter prints the pair's coefficient from the same connection, and it is the coefficient the cell holds.CM-DRILL-004 pass
Returning shows the grid exactly as it was: the same cells, list and line, the keyboard's place on the cell that was opened, and R is not asked again for the grid.
CM-DRILL-005 pass
chart.open(x, y)opens a pair by its two labels and returns the scatter,chart.scatter()gives it while it is open, andchart.close()returns to the grid; a label the grid does not have is refused with the labels it has. Drawing the grid again closes a scatter that is open.CM-LIFE-001 pass
init,setData,setSettings,render,resizeanddestroydrive the chart as they drive a safety.viz chart;setSettingsmoves the control of a setting that says what the chart opens on, anddestroytakes down the grid, a scatter a cell had opened and everything in the element.CM-LIFE-002 pass
Tables the chart cannot read are refused with a
TypeError, and the message is shown in the chart's place.CM-MOBILE-001 pass
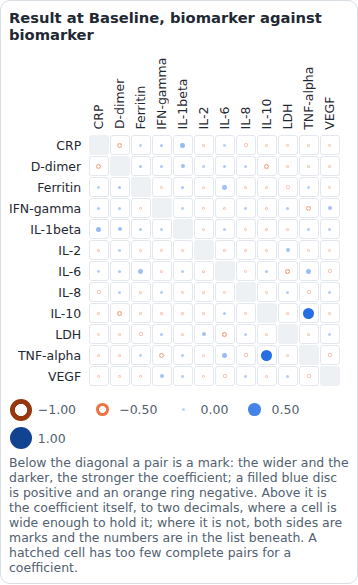
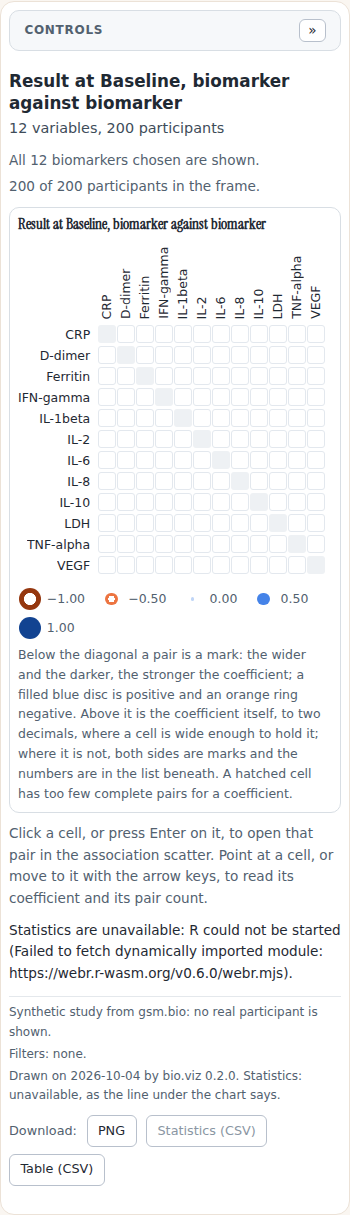
At a 390-pixel-wide viewport the chart fills the width with its controls folded away one tap from open. Twelve variables fit without the page scrolling sideways: the cells are too narrow for numbers, so both sides of the diagonal are marks, and the numbers, intervals and counts are in the list beneath. Six variables keep their numbers.
- pass browser CM-MOBILE-001: at 390px the chart fills the width with its controls folded away; twelve variables fit with marks on both sides of the diagonal and the numbers in the list beneath, and six keep their numbers (#27)
CM-MOBILE-002 pass
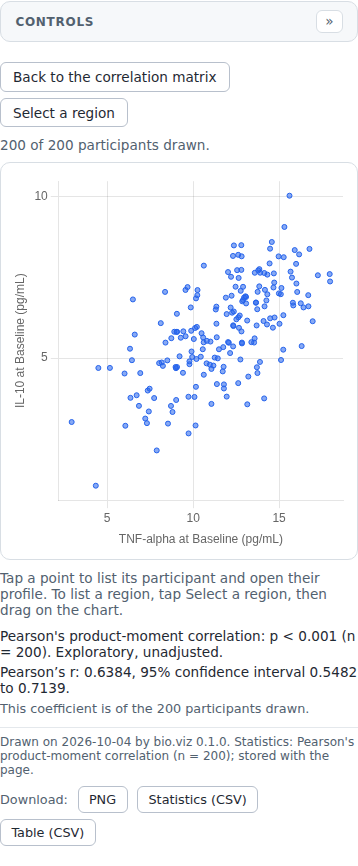
At a 390-pixel-wide viewport a tap on a cell, or on a pair in the list, opens the scatter, and its button returns; a grid of more variables than fit scrolls inside its own box; and the page does not scroll sideways at any point.
- pass browser CM-MOBILE-002: at 390px a tap on a cell, or on a pair in the list, opens the scatter and its button returns; a grid of more variables than fit scrolls inside its own box; the page never scrolls sideways (#27)
CM-SITE-001 pass
The gallery lists the correlation matrix with links to its live demo, its evidence page and its API reference.
CM-SITE-002 pass
The live demo draws the chart on the synthetic study, opening on its twelve biomarkers at Baseline, from safety.viz's vendored bundle and bio.viz's committed one, with R attached and gsm.bio's statistics file published beside it. Where R's host cannot be reached it still draws the grid's frame, and says that R could not be started.
CM-SITE-003 pass
The live demo holds at a 390-pixel-wide viewport with no horizontal scroll, with the grid drawn, the controls open and a pair opened in the scatter.
- pass browser CM-SITE-003: the live demo holds at a 390px-wide viewport with no horizontal scroll, with the grid drawn, the controls open and a pair opened in the scatter (#27)
CM-SITE-004 pass
The API reference has a table row for every setting the chart has, with the default the code has; the site build fails when one is missing.
CM-SITE-005 pass
The two demos point at each other: the correlation matrix's page says that a cell opens the association scatter, and the association scatter's page points to the correlation matrix as the overview.
CM-LIVE-001 pass
The gallery's demo draws the grid's frame first and starts R in the browser when the grid first asks, from webR's pinned version and gsm.bio's vendored statistics file, with no R package installed. The line waits, saying what the first start costs, and then every cell's coefficient, interval and pair count equal desktop R's for the same frame within 1 part in 10^8. The planted pair's cell holds 0.6 inside its interval, and no p-value is printed.
- pass browser CM-LIVE-001: the demo draws the frame first and starts R when the grid first asks; the line waits, saying what the first start costs, and then every cell’s coefficient, interval and pair count are desktop R’s; the planted cell holds 0.6 inside its interval, and no p-value is printed (#27)
CM-LIVE-002 pass
On the demo, Spearman's rho in every cell equals desktop R's, with no interval; where R's own wording differs between the desktop's version and the browser's, both are recorded and nothing else differs.
CM-LIVE-003 pass
On the demo, across the visits of one biomarker, every cell equals desktop R's: for the result, for the change from baseline with the baseline visit left out, and for Spearman on another biomarker.
CM-LIVE-004 pass
On the demo, a change shows the waiting state and then the new grid, which equals desktop R's, and never the old one: with gaps, where the cells' counts differ; with a filter; with six biomarkers; with a minimum some cells fall under, which print R's reason and no number; and where every cell falls under it.
CM-LIVE-005 pass
On the demo, a cell opens the scatter, which asks the same R, started once, and prints for the pair the coefficient the cell holds; returning shows the grid as it was and asks R nothing.
- pass browser CM-LIVE-005: a cell opens the scatter, which asks the same R, started once, and prints for the pair the coefficient the cell holds; returning shows the grid as it was and asks R nothing (#27)
CM-LIVE-006 pass
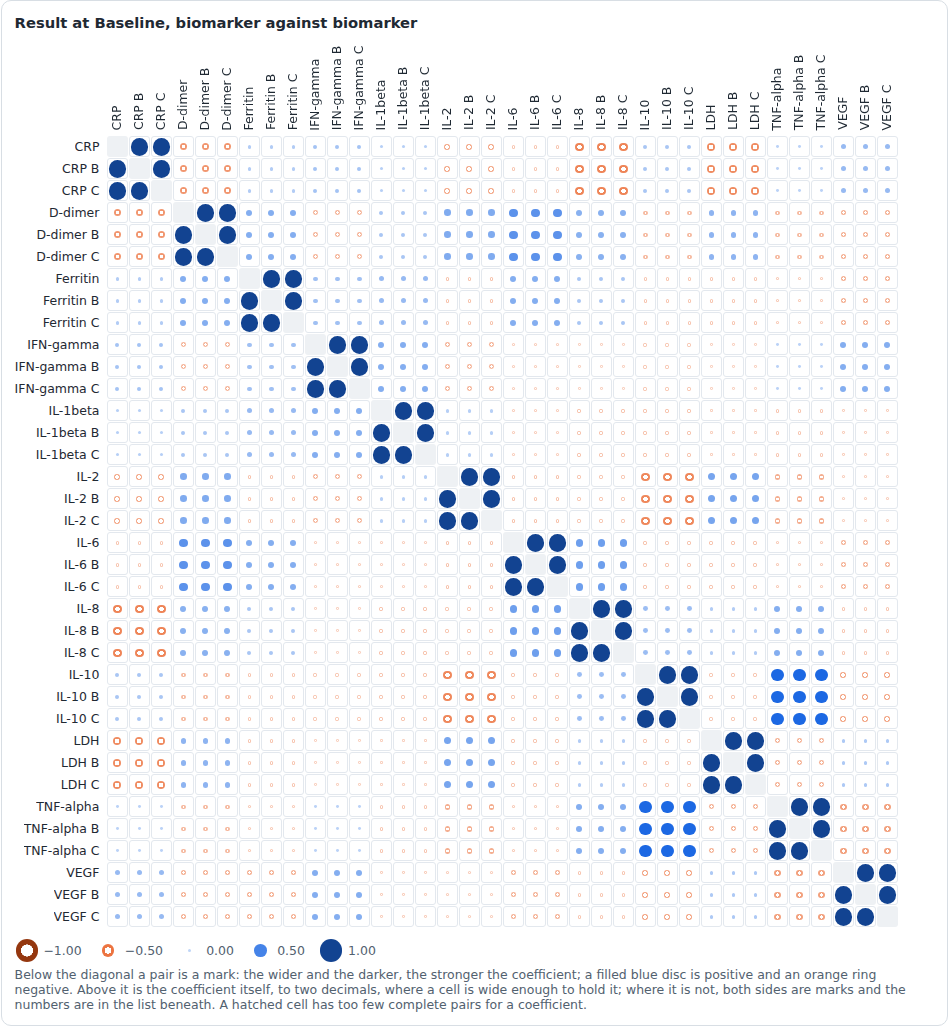
On the fixture of thirty-six biomarkers, with real R in the browser, grids of twelve, twenty-four and thirty-six variables are each filled from one answer of R's: 66, 276 and 630 pairs, every cell R's coefficient for its pair, with marks on both sides where the cells are too narrow for numbers and every pair in the list with its count. The seconds R takes for each are measured.
- pass browser CM-LIVE-006: on the fixture of thirty-six biomarkers, with real R, grids of twelve, twenty-four and thirty-six variables are each filled from one answer of R’s: 66, 276 and 630 pairs, with marks on both sides where cells are too narrow for numbers and every pair listed with its count (#27)
CM-LIVE-007 pass
The megabytes and seconds of the demo's first grid, and the seconds R takes for a grid of each size once started, are measured, printed in the run's log and written to a file with both versions' answers, and the megabytes are what the page tells its reader in the waiting text.
CM-LIVE-008 pass
On a phone the demo fills its grid from R, with marks on both sides of the diagonal, lists every pair with its count and coefficient, and the page does not scroll sideways.
- pass browser CM-LIVE-008: on a phone the demo fills its grid from R, with marks on both sides of the diagonal, lists every pair with its count and coefficient, and the page does not scroll sideways (#27)

CM-STAT-015 pass
When the connection is replaced (
setSettings({ connection })), an answer that arrives late from the connection it replaced is never shown: it changes neither the statistics line nor whatchart.statistics()reports, nor the grid's cells.CM-FAIL-001 pass
When drawing fails, the correlation matrix says so in its footnote (
This chart could not be drawn:and why), takes away what was drawn of the grid, ends the statistics round, empties the listing and the participant rail, says it in the danger colour and keeps its controls; once drawing works again it draws.CM-DROP-001 pass
With a participant table, a participant the results have and the table does not is left out and counted (
Not in the participant table), and a row of results with no participant id is counted (Row has no participant id); a participant table without the participant id column is refused with a sentence that names the column.CM-STAT-016 pass
The waiting note (what starting R costs) is said until R has answered once on the connection, so a pair the grid opens in the scatter after R has answered does not say it again.
CM-DROP-002 pass
With results for participants the participant table does not have and filters that let nobody through, the chart says
No participant passes the filters., as it does with no such rows.CM-DROP-003 pass
A setting that names a participant id column the participant table does not have (
setSettings({ participant_id_col })) is refused with the same sentence as the tables are, before anything changes, and the chart stays as it was drawn, a chart opened in place included (bio.viz#52).CM-STAT-017 pass
The R recipe run on a data frame with a visit column that holds numbers writes the identity as text, as the chart asks with, so a stored result written that way is found.
CM-DROP-004 pass
The participant table and the setting that names its id column change together:
setData(tables, settings)checks the tables against the settings it is given with them, lays the settings over, and draws.
Checking this page
npm ci
npm run evidence:check   # rerun every test and compare with the committed evidence set
npm run evidence         # rebuild docs/evidence/correlation-matrix/evidence.json