Test evidence
Cross-tabulation
Every requirement of this module, the tests named for it, and what each test recorded the last time the evidence was rebuilt.
Summary
- Requirements
- 31
- Tests named for them
- 31 (10 unit, 21 browser)
- Result
- pass every test passing
- Screenshots
- 9
- Recorded
- 2026-10-04 19:02 UTC
- Environment
- linux 6.17.0-1022-azure · node v22.23.3 · playwright 1.61.1 · chromium 149.0.7827.55
The requirements are the rows of the module’s requirement matrix. A test is named for a requirement by starting its name with the requirement’s ID. The results are read from the committed evidence set; continuous integration reruns every test and fails when the committed set no longer matches.
Requirements and their tests
CT-KIT-001 pass
The chart is built from safety.viz's kit on the page and draws its bars with the kit's Chart.js, bundling neither; without safety.viz on the page it is refused with a message saying what is missing.
CT-CFG-001 pass
Every setting has a default;
row_byandcol_byare each a column or a cut variable;percentisrow,colornone;testischisq,fisherornone; a setting that is not known, or a value it cannot take, is refused with a sentence naming it.CT-DATA-001 pass
The counts, the row and column totals and the grand total are desktop R's
table()of the same participants, each in R's category, for every case; a value that is empty or only white space is missing, as R's recipe reads it.CT-DATA-002 pass
Each cell's row and column percentages are its count of its row's or its column's total, as desktop R works them out.
CT-DATA-003 pass
A biomarker cut by the shared cut rule makes the rows or the columns, low to high, worked out on the participants the filters keep.
CT-DRAW-001 pass
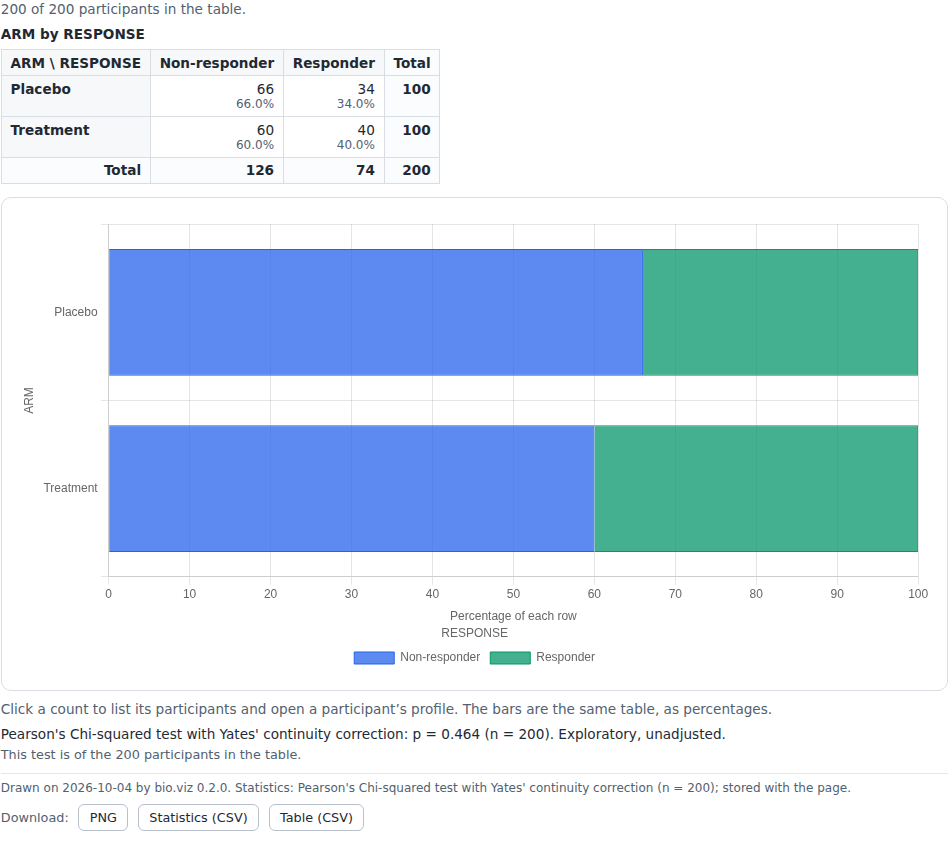
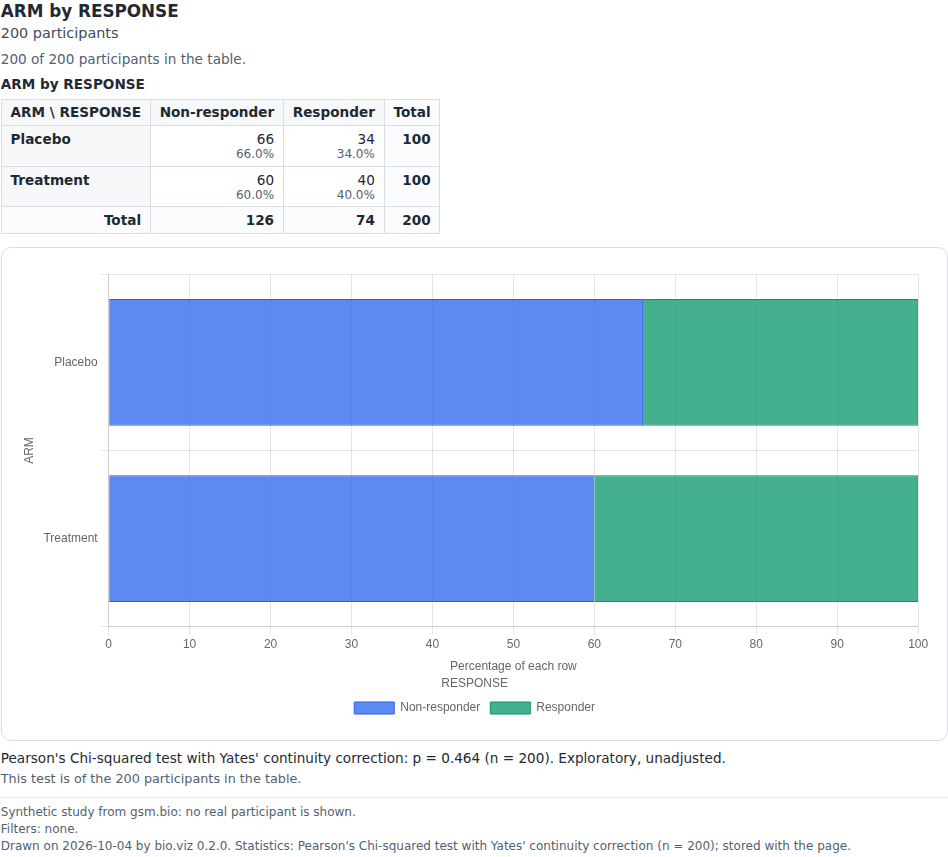
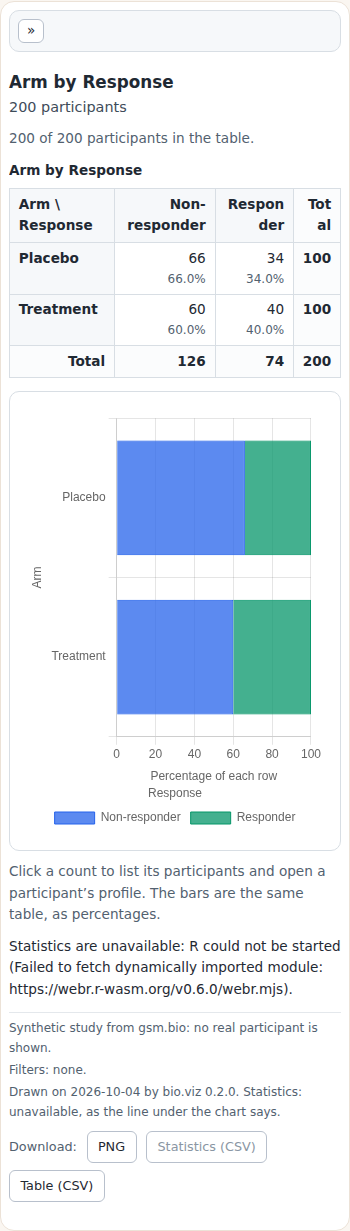
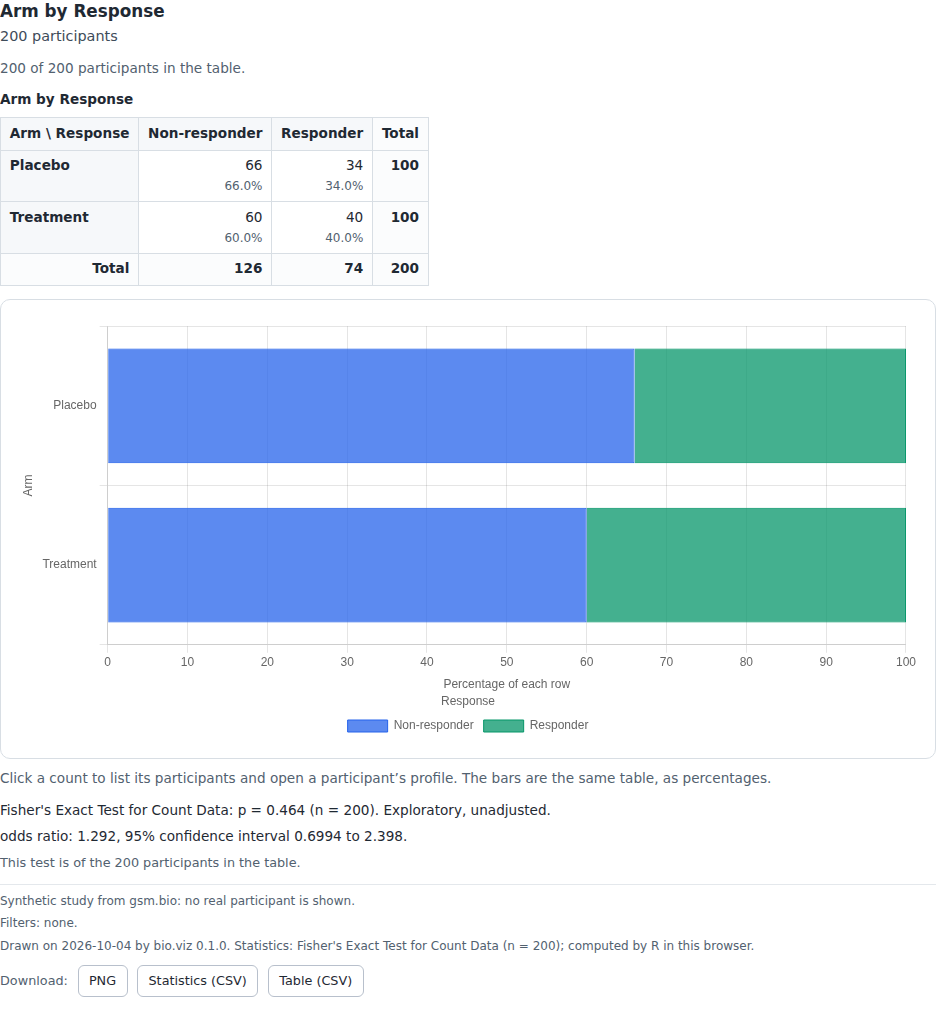
Arm by response on the synthetic study: every count, the totals and each row's percentages on the page are desktop R's, and the stacked bars are the same percentages, drawn to 100.
- pass browser CT-DRAW-001: arm by response: every count, the totals and each row’s percentages are desktop R’s, and the stacked bars are the same percentages (#44)
CT-DRAW-002 pass
With column percentages each cell's percentage is of its column's total and the bars stack each column by the rows; with none there are no percentages.
CT-DRAW-003 pass
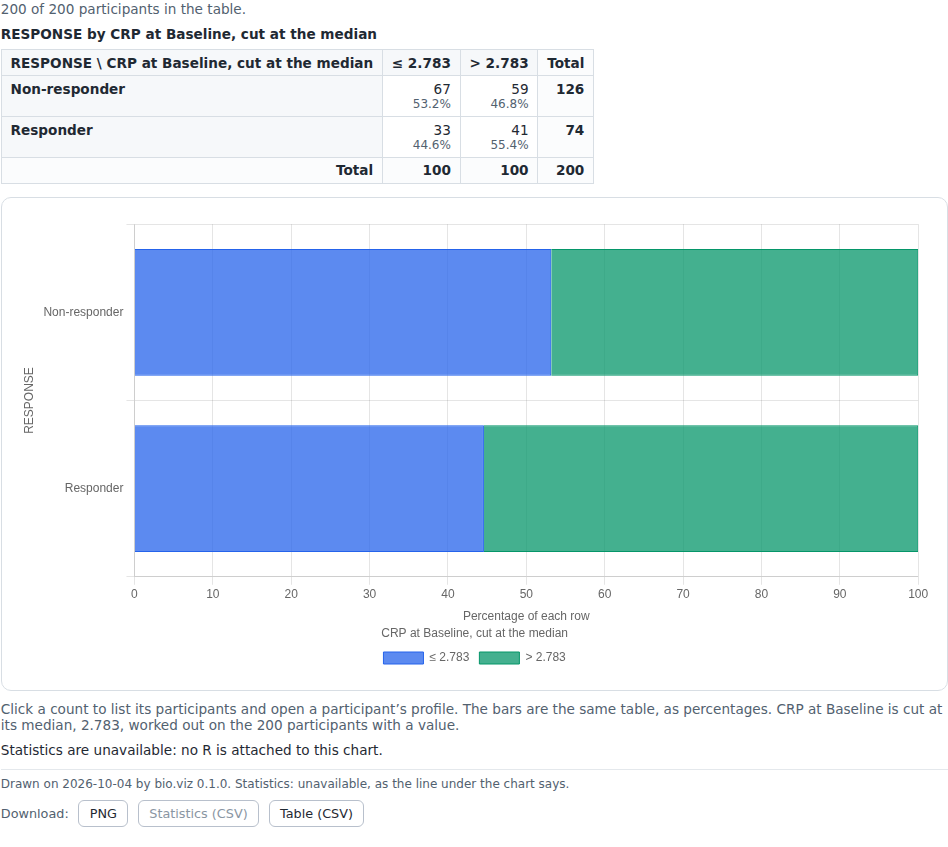
Response by CRP at Baseline cut at its median: the columns are the cut's groups, low to high, with desktop R's counts; the footnote states the cut; the Columns control offers the cut variables the settings name.
- pass browser CT-DRAW-003: a biomarker cut by the shared cut rule makes the columns, low to high, with desktop R’s counts, and the footnote states the cut; the Columns control offers it (#44)
CT-STAT-001 pass
R is asked once per table, with one row per participant, the function, the arguments, the identity and the row count that desktop R's recipe writes; a column's categories are named by code point and a cut's low to high, the same in every browser language, whatever order the table shows them in.
CT-STAT-002 pass
R's chi-square and Fisher results are printed with their method and counts, labelled exploratory and unadjusted, and Fisher's odds ratio with its interval.
CT-STAT-003 pass
The small-expected-count warning is R's: printed with the result as R worded it when R gives it, and not otherwise.
CT-STAT-004 pass
Handed to a connection as stored results, each of desktop R's answers is found by the chart's request for its table.
CT-STAT-005 pass
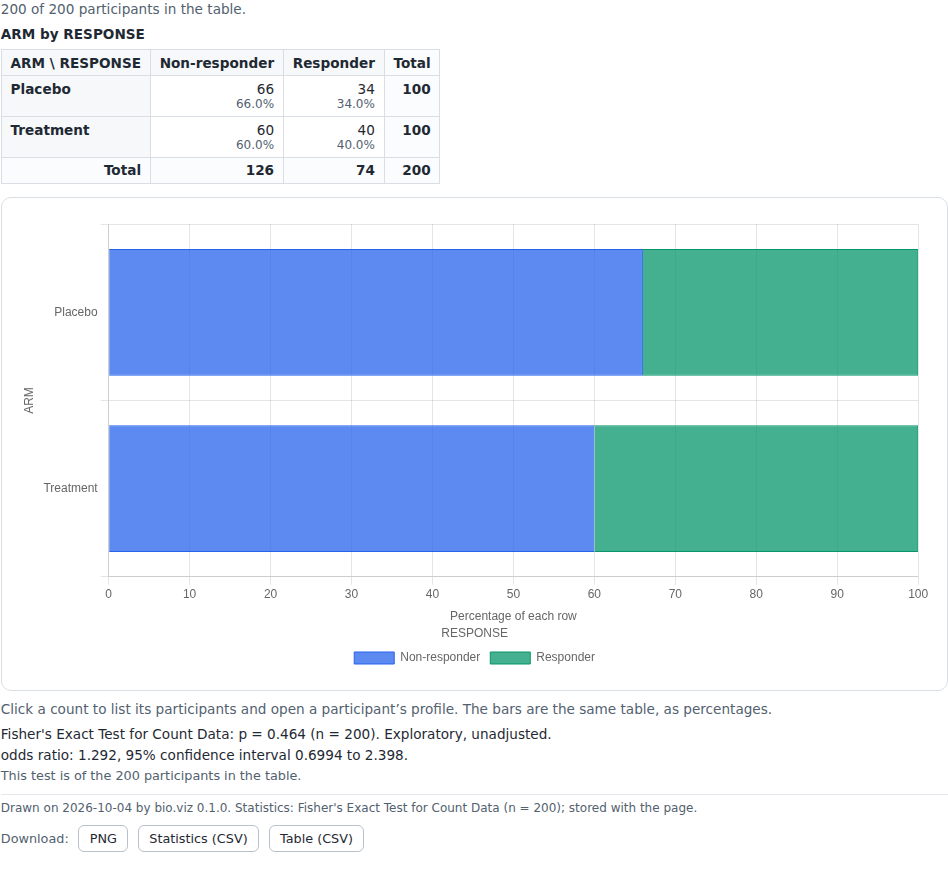
With R's answers stored in the page, the chi-square and the Fisher results print with their method and counts, Fisher's odds ratio with its interval, and what the chart asked is the key R wrote.
- pass browser CT-STAT-005: with R’s answers stored in the page, the chi-square and Fisher results print with their method and counts, Fisher’s odds ratio with its interval, and the identity R wrote is the chart’s (#44)
CT-STAT-006 pass
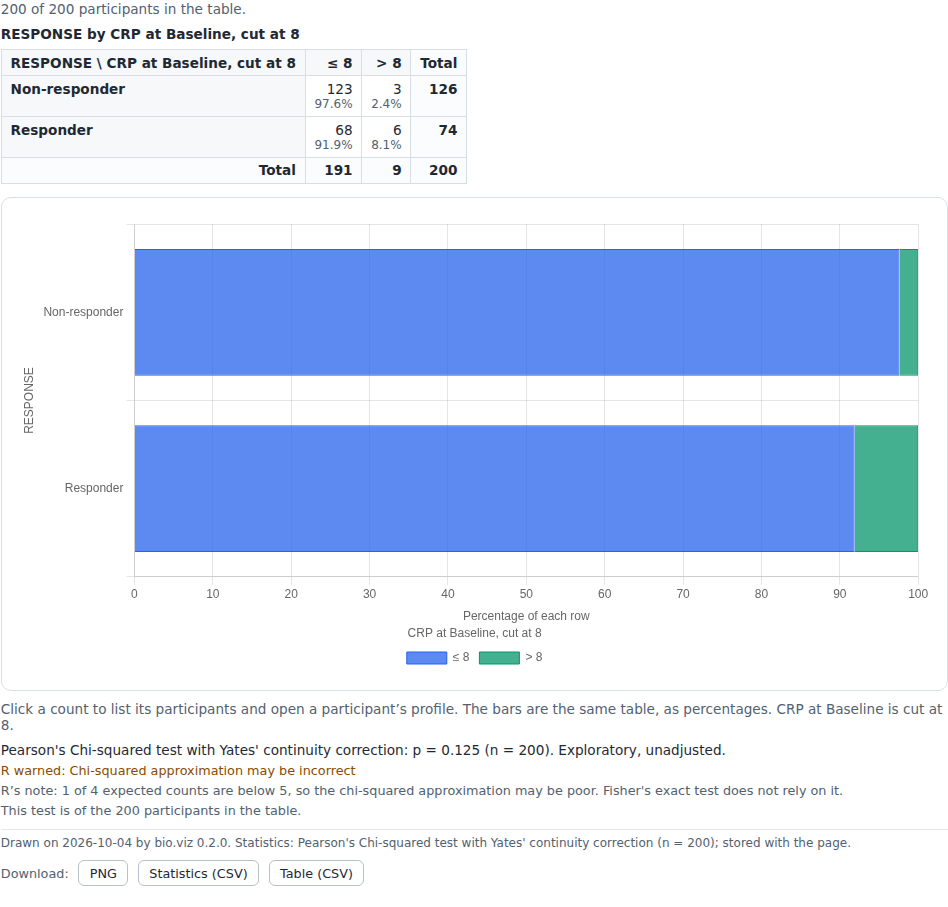
R's small-expected-count warning is printed with the result for a table with an expected count below 5 (response by CRP at Baseline cut at 8), and not for one without.
- pass browser CT-STAT-006: R’s small-expected-count warning is printed with the result for a table with an expected count below 5, and not for one without (#44)
CT-STAT-007 pass
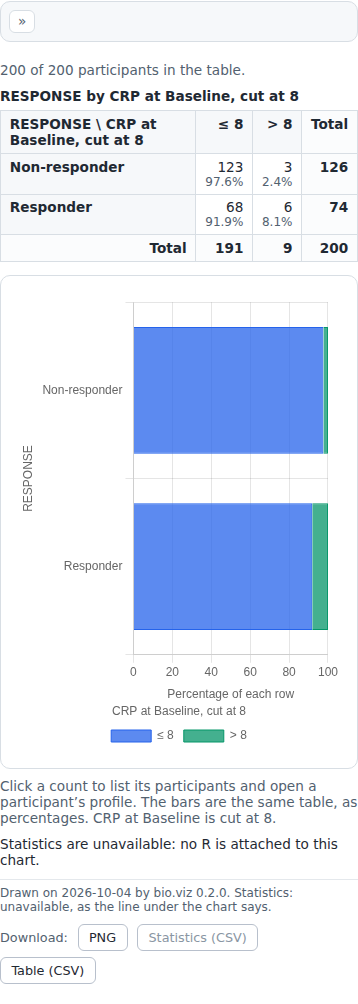
With no R attached the line says statistics are unavailable, the table and the bars are still drawn, and nothing is fetched; with no test chosen R is asked nothing.
CT-STAT-008 pass
The test is of the participants the filters keep, as desktop R gives it for the women alone, and the line says the filter.
CT-STAT-009 pass
Once the connection is replaced, a late answer from the old one changes neither the line nor what
chart.statistics()reports.CT-STAT-010 pass
A table R withholds, a category below its minimum size, prints R's reason with the table's variables named where R names the columns the chart handed it, and no number.
- pass unit cross-tabulation: what R is asked, and what the line says CT-STAT-010: a table R withholds, a category below its minimum size, prints R’s reason with the table’s variables named where R names the columns the chart gave it, and no number (#44, #58)
CT-STAT-011 pass
In the page, a withheld table's line reads R's reason with the variables named, and no p-value.
- pass browser CT-STAT-011: a table R withholds prints R’s reason, with the table’s variables named in it, and no number (#44, #58)
CT-STAT-012 pass
After a filter changes, the answer to the table no longer on screen is dropped when it arrives, and the line and
chart.statistics()hold the answer for the table drawn.- pass browser CT-STAT-012: after a filter changes, the answer to the table no longer on screen is dropped when it arrives; the line shows the answer for the table drawn (#44, #58)
CT-STAT-013 pass
Changing what the percentages are of redraws the table and the bars and asks R nothing: the line keeps R's answer for the table.
- pass browser CT-STAT-013: changing what the percentages are of redraws the table and the bars and asks R nothing: the line keeps R’s answer (#44, #58)
CT-LIST-001 pass
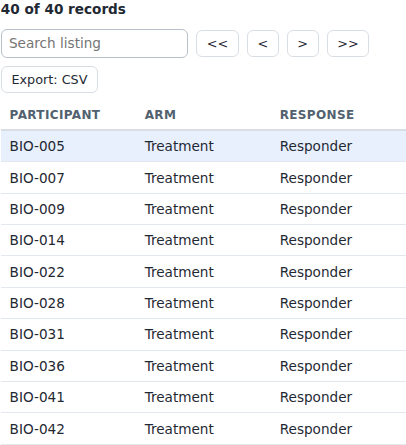
Clicking a count lists that cell's participants, the ones desktop R puts in that cell, in the kit's listing, and a row of it opens safety.viz's participant profile of that participant.
- pass browser CT-LIST-001: clicking a count lists that cell’s participants in the kit’s listing, and a row of it opens the participant’s profile (#44)
CT-FAIL-001 pass
When drawing fails the chart says so in its footnote, empties the listing and the rail, keeps its controls and leaves nothing half drawn, and draws again once it can.
CT-DROP-001 pass
With a participant table, participants it does not have and rows with no participant id are counted by reason; a participant table without the id column is refused with a sentence; filters that let nobody through say so; the id column and the table change together.
CT-MOBILE-001 pass
At 390 pixels the controls are folded away, the table fits or scrolls inside its own box, and the page does not scroll sideways.
- pass browser CT-MOBILE-001: at 390px the controls are folded away, the table fits or scrolls inside its own box, and the page does not scroll sideways (#44)
CT-SITE-001 pass
The live demo holds at a 390-pixel-wide viewport with no horizontal scroll, with the controls open.
- pass browser CT-SITE-001: the live demo holds at a 390px-wide viewport with no horizontal scroll, with the controls open (#44)
CT-SITE-002 pass
The gallery lists the chart with links to its live demo, its evidence page and its API reference; the demo opens on arm by response, draws the table where R cannot be reached and says so, and offers CRP at Baseline cut at its median.
CT-SITE-003 pass
The API reference has a table row for every setting the chart has, with the default the code has; the site build fails when one is missing.
CT-LIVE-001 pass
Against R started in the browser on the demo: arm by response, by chi-square and by Fisher's exact test, every count, statistic and p-value equals desktop R's within 1 part in 10^8.
- pass browser CT-LIVE-001: arm by response, by chi-square and by Fisher’s exact test, with R started in this browser: every count, statistic and p-value is desktop R’s (#44)
CT-LIVE-002 pass
Against R in the browser: response by CRP at Baseline cut at its median, by both tests, and cut at 8, where R warns of small expected counts, equal desktop R's, warning included.
CT-LIVE-003 pass
Against R in the browser: the women alone, by the filter, equals desktop R's.
Checking this page
npm ci
npm run evidence:check   # rerun every test and compare with the committed evidence set
npm run evidence         # rebuild docs/evidence/cross-tab/evidence.json