Test evidence
Group comparison
Every requirement of this module, the tests named for it, and what each test recorded the last time the evidence was rebuilt.
Summary
- Requirements
- 148
- Tests named for them
- 165 (89 unit, 76 browser)
- Result
- pass every test passing
- Screenshots
- 17
- Recorded
- 2026-10-04 19:02 UTC
- Environment
- linux 6.17.0-1022-azure · node v22.23.3 · playwright 1.61.1 · chromium 149.0.7827.55
The requirements are the rows of the module’s requirement matrix. A test is named for a requirement by starting its name with the requirement’s ID. The results are read from the committed evidence set; continuous integration reruns every test and fails when the committed set no longer matches.
Requirements and their tests
GC-KIT-001 pass
safety.viz's script-tag bundle is vendored as one file,
site/vendor/safety.viz/safety.viz.js, with a source record beside it that names the safety.viz repository, the commit and version it was copied from, and the file's path there.GC-KIT-002 pass
The vendored bundle matches its recorded checksum and size. A bundle that is changed, missing, or beside a file the record does not name fails the check, and a second check fails when it differs from safety.viz's file at the recorded commit.
- pass unit the vendored safety.viz bundle GC-KIT-002: the vendored bundle matches its recorded checksum and size (#9)
- pass unit vendoring a bundle: the copy and its check GC-KIT-002: a changed bundle, a missing one, and a file beside it that is not recorded each fail the check (#9)
- pass unit vendoring a bundle: the copy and its check GC-KIT-002: the copy writes the bundle exactly as the source holds it and records what was asked of it (#9)
GC-KIT-003 pass
The source record says whether the commit is on safety.viz's
devbranch and, when it is not, says why and that the copy is to be made again fromdev.GC-KIT-004 pass
The chart is built from
SafetyViz.kit, found on the page: safety.viz's bundle and bio.viz's are two script tags, and every chart is drawn with the kit's Chart.js constructor.GC-KIT-005 pass
On a page without safety.viz the chart refuses to be made, with a message saying that
SafetyViz.kitwas not found.GC-KIT-006 pass
bio.viz's committed bundles contain none of safety.viz and no Chart.js: the build takes in only files under
src/, the chart's source imports nothing from outside it, every file a committed bundle names as one it was made from is a file undersrc/, and the bundles hold no known marker of either library's code.- pass unit bundle: the chart ships, safety.viz and Chart.js do not GC-KIT-006: BioViz.groupComparison is exported by both committed bundles, and defining it needs no safety.viz (#9)
- pass unit bundle: the chart ships, safety.viz and Chart.js do not GC-KIT-006: the build takes in only files under src/, and no source file imports from outside it (#9)
- pass unit bundle: the chart ships, safety.viz and Chart.js do not GC-KIT-006: the committed bundles hold none of safety.viz and no Chart.js (#9)
GC-CFG-001 pass
Every setting has a default, and the column and baseline settings carry the core's names and defaults.
GC-CFG-002 pass
A caller's settings are laid over the defaults; a column list is read the same whether written as names or as
{ value_col, label }, and a single name the same as a list of one.GC-CFG-003 pass
A setting that is not known, or a value a setting cannot take, is refused with a message naming it.
GC-CFG-004 pass
The chart has no setting that chooses an adjustment, a confidence level, a minimum group size or a cut.
GC-CFG-005 pass
The test and the pairwise comparisons each have a setting with a stated default:
test, one oft,wilcoxon,anova,kruskalornone, defaultt, andpairwise, default false.waiting_noteis a sentence a page adds to the waiting text. A value none can take is refused with a message naming it.GC-BOX-001 pass
A quantile is worked out by linear interpolation between the two nearest values at position (n − 1)p: R's
quantile(type = 7), the rule safety.viz's box plots use.GC-BOX-002 pass
On the synthetic study the count, the 5th, 25th, 50th, 75th and 95th percentiles, the least and greatest value and the mean of every box equal what desktop R gives for the same cell.
GC-VIOLIN-001 pass
A violin's outline is a Gaussian kernel density of the cell's values at 64 heights from the least value to the greatest, with R's
bw.nrd0as its smoothing width; on the synthetic study both equal what desktop R gives.GC-VIOLIN-002 pass
On a logarithmic axis a violin's outline is worked out on the base-10 logarithm of the values; a box is drawn from the values themselves on either axis.
GC-VIOLIN-003 pass
A cell with one value, or with every value the same, has no outline; an outline is worked out only when violins are drawn.
GC-DATA-001 pass
A panel holds one cell per level of the group, and each cell holds the participants the core's frame resolved at that level.
GC-DATA-002 pass
The number of participants in each group is written beneath it, and with a colour the number in each colour.
GC-DATA-003 pass
A second grouping by colour splits each level of the group into cells side by side that share the level's place on the axis.
GC-DATA-004 pass
Panels by one further variable give one panel per level of it, and every panel is on the same value axis.
GC-DATA-005 pass
With more than one visit chosen each visit is a panel, crossed with the panel variable when there is one; a baseline value has no visit.
GC-DATA-006 pass
The levels chosen are the levels drawn: a level left out takes its participants with it.
GC-DATA-007 pass
On a logarithmic axis a value of zero or less is left out and counted.
GC-DATA-008 pass
A filter chooses participants: the ones filtered out are not drawn, and are not counted as missing a result.
GC-DATA-009 pass
With the results table alone a group comes from a column carried on the results rows, and the cells are the ones the participant table would give.
GC-DATA-010 pass
The value axis is named for the variable, with the unit its values are in; a fold change has no unit and a percent change is in percent.
GC-DATA-011 pass
A point's place across its group's slot is fixed by the participant's id, so it does not move from one drawing to the next.
GC-DATA-012 pass
The results-alone fixture is derived from the vendored study by a recorded rule: the results rows of two biomarkers, each with the participant's
ARMadded. Deriving it again gives the committed file.- pass unit the results-alone fixture GC-DATA-012: deriving the fixture again from the vendored study gives the committed file, byte for byte (#9)
- pass unit the results-alone fixture GC-DATA-012: every cell of the fixture is a cell of a vendored file: the results rows of two biomarkers, each with the participant’s arm (#9)
- pass unit the results-alone fixture GC-DATA-012: the fixture’s record names the vendored files it was derived from, by the checksums the study’s own record holds (#9)
GC-DATA-013 pass
With no column to group by, everyone is drawn as one group.
GC-CTRL-001 pass
With participant data, the columns offered to group, colour and panel by are the participant table's categories: its columns with at most
max_levelsdifferent values, other than the id.GC-CTRL-002 pass
With the results table alone, the columns offered are the ones carried on its rows that are not mapped by a setting and hold one value for each participant.
GC-CTRL-003 pass
Filters are the participant table's categories, or the columns named in settings that the participant table has; without a participant table there are none.
GC-CTRL-004 pass
The biomarkers, the visits in visit order and the visits the chart opens on, every one of them unless the settings name some, are read from the results table.
GC-CTRL-005 pass
The biomarker, the value type and the visit are chosen in the sidebar, and the chart follows; a baseline value has no Visit control.
GC-CTRL-006 pass
The levels of the group are chosen in the sidebar, and a level left out is not drawn.
GC-CTRL-007 pass
Reset chart returns every control and filter to what the chart opened on.
GC-DRAW-001 pass
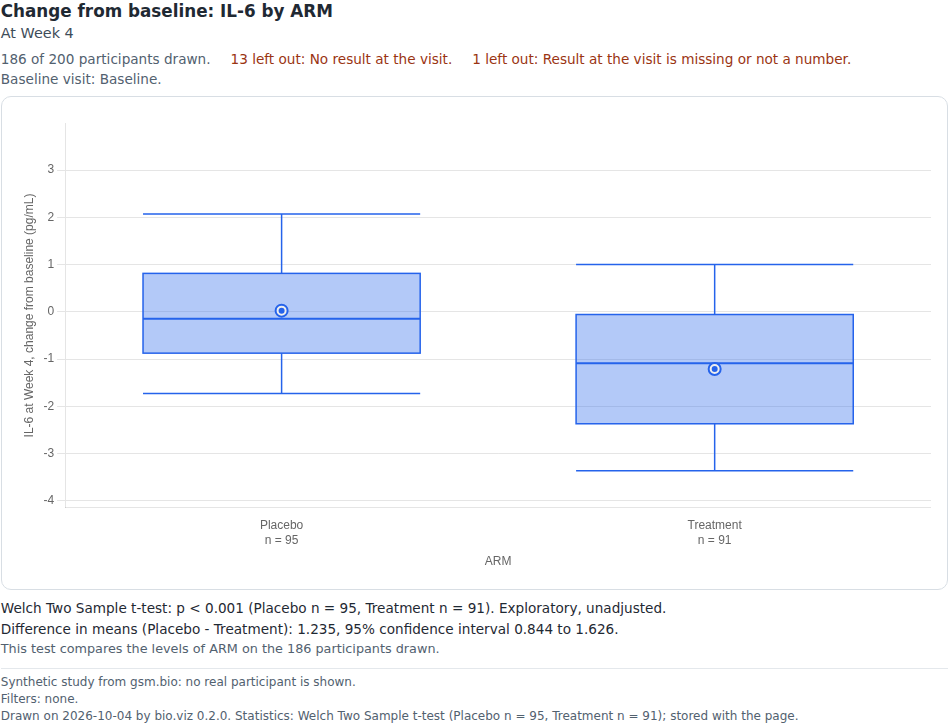
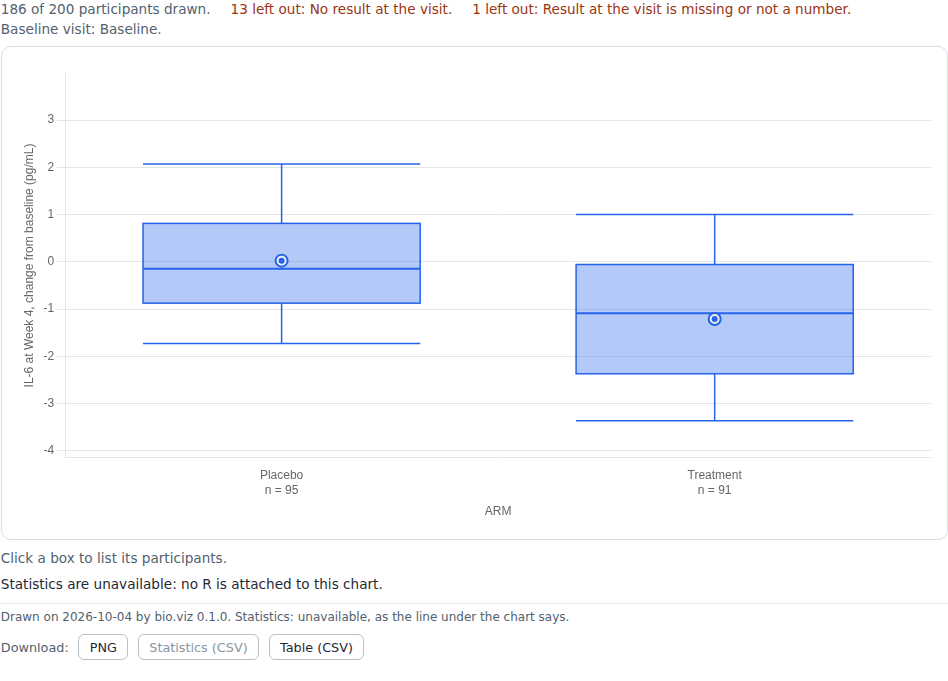
The chart draws a box per group with safety.viz's box drawing, with the number in each group beneath, and the quartiles on the page are the ones desktop R gives.
- pass browser GC-DRAW-001: a box per group, with the number in each group beneath, and the quartiles R gives (#9)
GC-DRAW-002 pass
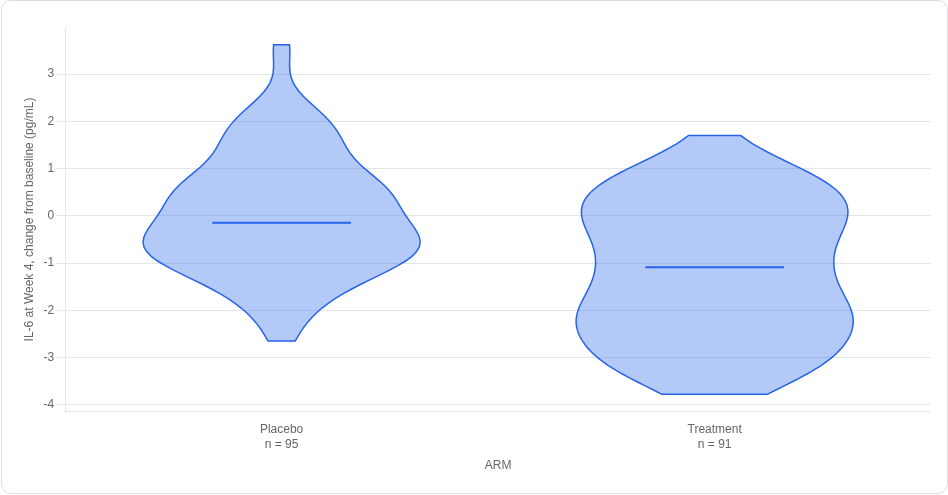
The chart draws a violin per group, by a plugin on the kit's Chart.js.
GC-DRAW-003 pass
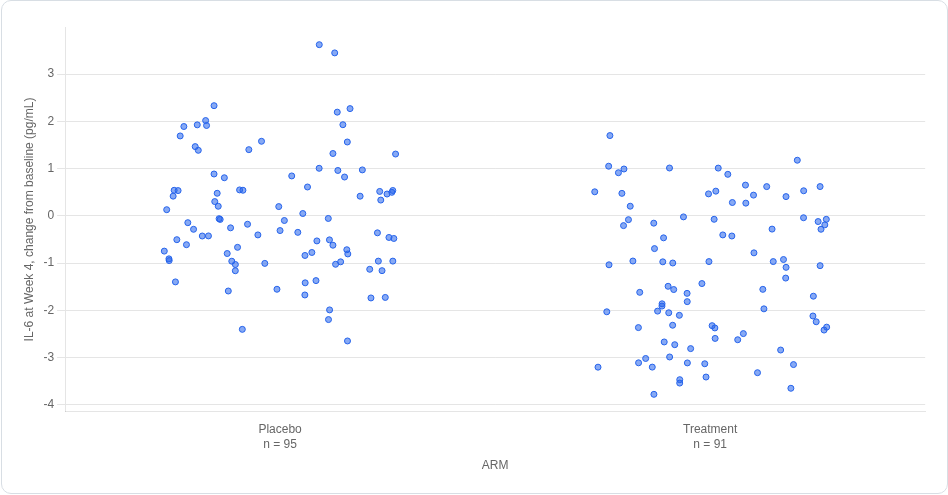
The chart draws points, one per participant, each at its value and within its group's place.
GC-DRAW-004 pass
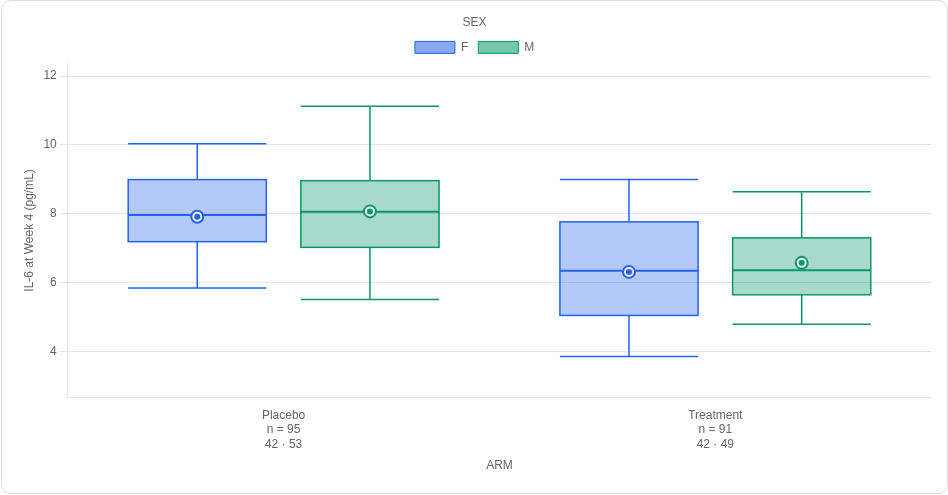
A second grouping by colour is drawn side by side with a legend and the count in each colour.
- pass browser GC-DRAW-004: a second grouping by colour draws the colours side by side, with a legend and the count in each (#9)
GC-DRAW-005 pass
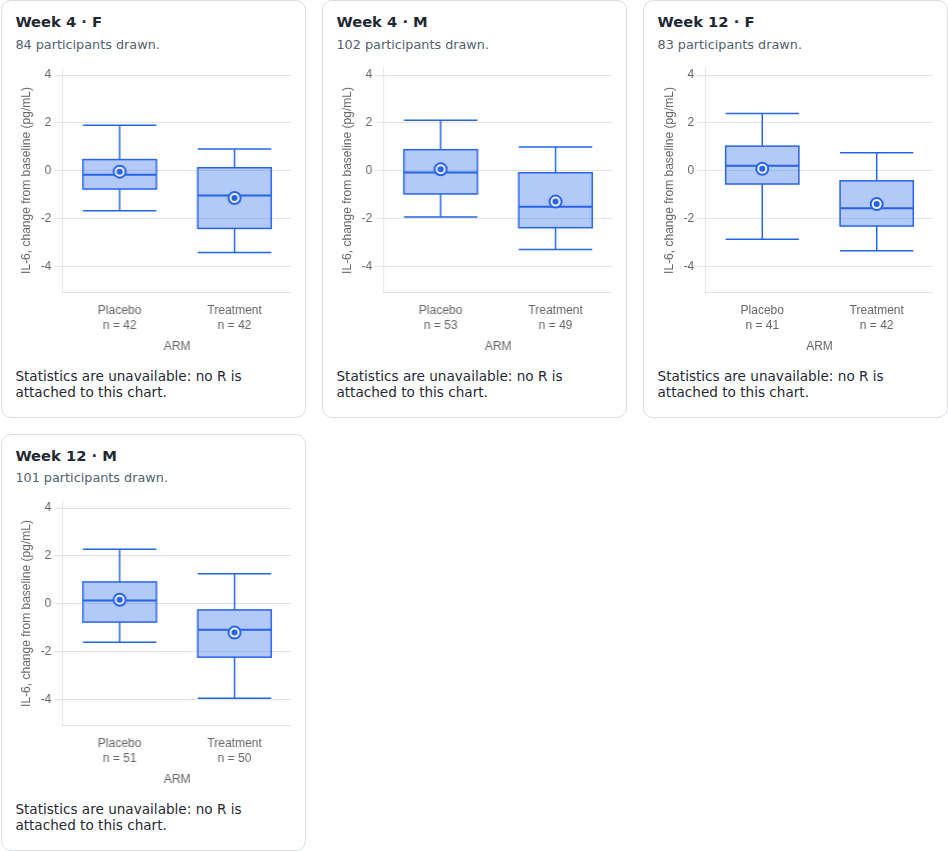
Panels by one further variable, and by visit, are each a chart of their own on one value axis.
- pass browser GC-DRAW-005: panels by one further variable, and by visit, each a chart of its own on one value axis (#9)
GC-DRAW-006 pass
The value axis can be logarithmic; values of zero or less are left out and the note above the chart counts them.
GC-FILTER-001 pass
Loaded with the results table alone the chart draws and shows no filters, and a group comes from a column carried on the results rows.
GC-FILTER-002 pass
Loaded with the synthetic results as vendored, which carry no group column, the chart says that no column can make a group and draws everyone as one group, with no filters.
GC-FILTER-003 pass
Loaded with participant data the chart shows a filter per category column and offers the participant-level variables to group, colour and panel by.
GC-FILTER-004 pass
A filter narrows the participants drawn, and the counts beneath the groups and the note above the chart follow.
GC-FILTER-005 pass
When the filters together let no participant through, the chart hands the core no results table of no rows, which the core refuses as malformed: one biomarker and the overview have no panels and say that nobody passed. With no kit on the page an empty selection is not a filter in force and lets everyone through.
- pass unit group comparison: filters that let nobody through GC-FILTER-005: with no kit on the page an empty selection lets everyone through, as it is not a filter in force (#29)
- pass unit group comparison: filters that let nobody through GC-FILTER-005: with no participant through the filters the chart asks the core for no frame and draws no panel, one biomarker or the overview, and the core still refuses a results table with no rows (#29)
GC-FILTER-006 pass
On the demo, filters with nobody in common leave the overview and one biomarker reading
No participant passes the filters., with the note that none of the participants pass; nothing is drawn, R is asked nothing, the filters and Reset chart stay usable, nothing is written to the console, and loosening a filter draws again.GC-FILTER-007 pass
A filter reads its spec by the rule safety.viz's charts follow, through the kit's
reconcileFilters:startsets what it opens on and All is still offered; onlyall: falseremoves All, and its first value is then the one in force; a value the data lacks falls back to All with a console warning naming the filter; and the selection each control shows is the selection the chart filters by.GC-LIST-001 pass
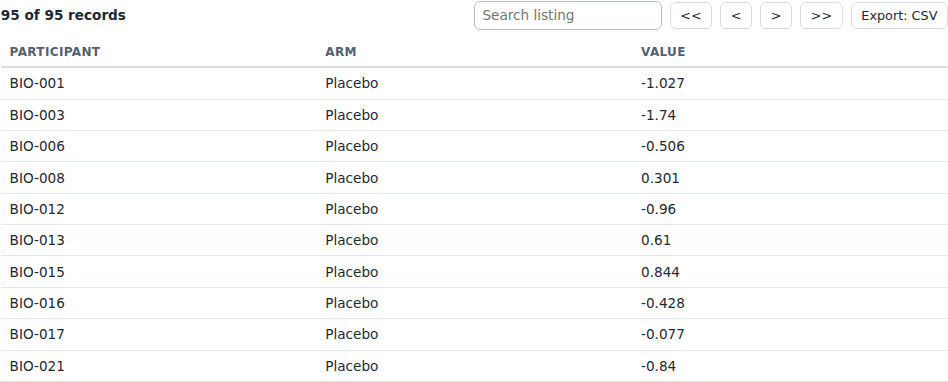
Clicking a box lists its participants in the kit's record listing, whose search and paging work on them.
GC-LIST-002 pass
A change to a control or a filter empties the listing, so it never lists a box that is no longer drawn.
GC-LIST-003 pass
The listing's export downloads the listed rows as CSV under this chart's name.
GC-LIST-004 pass
Clicking a point lists its participant and opens their profile.
GC-PROF-001 pass
A row of the listing selects its participant: the chart raises safety.viz's
participantsSelectedevent with the participant's id, and safety.viz's participant profile opens on it with the participant's own columns and biomarkers. Clearing the profile clears the selection.GC-STAT-001 pass
With no R attached the statistics line reads exactly what the connection answers.
GC-STAT-002 pass
From the moment a result is asked for until it arrives, the line says it is waiting; the answer is printed through the shared formatter.
GC-STAT-003 pass
R is asked with the rows that were drawn and the names of their fields.
GC-STAT-004 pass
An answer that arrives after the chart has been drawn again is never shown.
GC-STAT-005 pass
What R declined to compute, what the formatter refuses, and what R reports as an error are each printed as such.
GC-STAT-006 pass
On the page, with no R attached, the statistics line of every panel reads that statistics are unavailable, and nothing is fetched to say so.
GC-STAT-007 pass
On the page, with a connection given in settings, the line shows that it is waiting until R answers and then prints the answer; R is asked for the rows that are drawn.
- pass browser GC-STAT-007: the line shows that it is waiting until R answers, and then prints the answer through the shared formatter (#9)

GC-STAT-008 pass
On the page, a filter change clears the line before asking again, and an answer for the rows before the change is never shown.
GC-STAT-009 pass
The tests offered are the ones that fit the number of groups drawn: a Welch t-test or a Wilcoxon rank-sum test for two, a one-way ANOVA or a Kruskal-Wallis test for more, and none for fewer than two. A test that does not fit gives way to its counterpart of the same kind, means with means and ranks with ranks, so R is never sent a test it would refuse for the number of groups.
GC-STAT-010 pass
What R is asked for a panel is the function named in settings, the panel's rows, and four arguments:
strValueCol,strGroupCol,strMethodandbPairwise. Pairwise comparisons are asked for only when the switch is on and the rows hold more than two groups. Nothing else is sent: the adjustment, the confidence level and the minimum group size are R's defaults.GC-STAT-011 pass
The identity of a panel's rows states what was drawn by the settings' names: the biomarker, the value type, the visit, the baseline settings, the group column, the groups in the rows, the colour column, the panel, the filters in force, and whether zero or less was left out. A member that is not set is left out, lists are sorted by code point, and a change to anything that changes the rows changes the identity.
- pass unit group comparison: what R is asked GC-STAT-011: a change to anything that changes the rows changes their identity (#16)
- pass unit group comparison: what R is asked GC-STAT-011: the groups are the ones in the rows, and text is sorted by code point, the order R’s radix sort gives (#16)
- pass unit group comparison: what R is asked GC-STAT-011: the identity of a panel’s rows states what was drawn, by the settings’ names, and leaves out what is not set (#16)
GC-STAT-012 pass
The result is printed through the shared formatter with its method and counts, labelled exploratory and unadjusted, for each of the four tests, with no star and never the word significant.
GC-STAT-013 pass
For two groups the difference in means is printed with its interval, from R's
estimates, with what it is the difference of. With more than two groups R gives none and none is printed.GC-STAT-014 pass
Pairwise comparisons are printed as a table of each pair, its two counts and its adjusted p-value, under a caption that names the method and labels them adjusted, by the name of the adjustment R used. Where R used more than one method among the pairs each pair names its own, and a pair R could not compute says why.
GC-STAT-015 pass
R's warnings and notes are printed with the result, as R worded them.
GC-STAT-016 pass
A group below the minimum size prints R's reason once and no number, and a result R marked as an error prints R's message.
GC-STAT-017 pass
With fewer than two groups to compare, in the chart or in one panel, the line says that a test compares two or more groups, and what was found.
GC-STAT-018 pass
What one test covers is said under it: the participants drawn in that panel, that each panel has a test of its own and they are not adjusted for one another, that a second grouping by colour is not part of it, and the filters in force.
GC-STAT-019 pass
The waiting text carries the page's note on what starting R costs until R has answered once, and not after.
GC-STAT-020 pass
A view with no stored result reads that statistics are unavailable for this view, in the chart's own words.
GC-STAT-021 pass
The rows desktop R is run on are the chart's: each case is one panel of the gallery's demo in one view, its rows made by the chart's own code from the demo's own tables and settings, and deriving them again gives the committed files.
- pass unit the rows R is run on GC-STAT-021: deriving each case’s rows again, with the chart’s own code from the demo’s own tables and settings, gives the committed files (#16)
- pass unit the rows R is run on GC-STAT-021: the rows are the chart’s: one per participant, the fields the chart hands R, and the demo’s settings read from the demo’s own script (#16)
GC-STAT-022 pass
The expected results name the script, the R version, and the commit and checksum of the vendored statistics file that made them, and hold one result per case: the four tests, the pairwise comparisons and a group below the minimum size among them.
GC-STAT-023 pass
A stored result written from R by the documented recipe is one the chart finds: for every case the function, the arguments, the identity and the row count R wrote are the ones the chart asks with, and handed to a connection each answer is found by its panel's request and by no other view's.
- pass unit what desktop R answered, and the key it wrote GC-STAT-023: for every case the function, the arguments, the identity and the row count R wrote by the recipe are the ones the chart asks with (#16)
- pass unit what desktop R answered, and the key it wrote GC-STAT-023: handed to a connection as stored results, each of R’s answers is found by the chart’s request for its panel, and by no other view’s (#16)
GC-STAT-024 pass
gsm.bio's statistics file is vendored as one file,
site/vendor/gsm.bio/statistics.R, with a source record beside it naming the gsm.bio repository, the commit and the file's path there. It defines the function the chart asks for, attaches no package, and names the survival package only inside its survival functions.- pass unit the vendored statistics file GC-STAT-024: gsm.bio’s statistics file is in site/vendor/gsm.bio/ with a record naming the repository, the commit and the file it was copied from (#16)
- pass unit the vendored statistics file GC-STAT-024: the file is sourced with base R alone: it attaches no package, and names survival only inside its survival functions (#16)
GC-STAT-025 pass
The vendored statistics file matches its recorded checksum and size. A file that is edited, missing, or beside a file the record does not name fails the check, and a second check fails when it differs from gsm.bio's file at the recorded commit.
- pass unit the vendored statistics file GC-STAT-025: the vendored file matches its recorded checksum and size (#16)
- pass unit vendoring the statistics file: the copy and its check GC-STAT-025: an edited file, a missing one and a file beside it that is not recorded each fail the check, and a file that differs from gsm.bio’s at the recorded commit fails the check against the source (#16)
- pass unit vendoring the statistics file: the copy and its check GC-STAT-025: the copy writes the file exactly as gsm.bio holds it and records the commit, the licence and the version (#16)
GC-STAT-026 pass
On the page, the Test control offers only the tests that fit the number of groups drawn, and the pairwise switch is there only with more than two groups; R is sent only a test the control offered.
GC-STAT-027 pass
On the page, with one group drawn, with no column to group by, with one group in a panel, or with no test chosen, R is not asked, and the line says why.
GC-STAT-028 pass
On the page, a change to the test, the pairwise switch, a filter or a variable each clears the line and asks R again for what is then drawn, and the answer to the question before is never shown.
GC-STAT-029 pass
On the page, each panel asks R for itself, on its own rows and under its own identity, and is answered for itself: one biomarker at two visits is two requests, and one panel prints while the other still waits.
GC-STAT-030 pass
On the page, with R's answers stored and no R attached, a view an answer was stored for prints it with no request to R's hosts, each panel from its own stored result, and a view none was stored for reads unavailable, never another view's numbers.
GC-STAT-031 pass
On the page, the line prints what R returned: the result, the difference in means, the pairwise table, R's warnings and notes, and R's reason for a group too small.
GC-STAT-032 pass
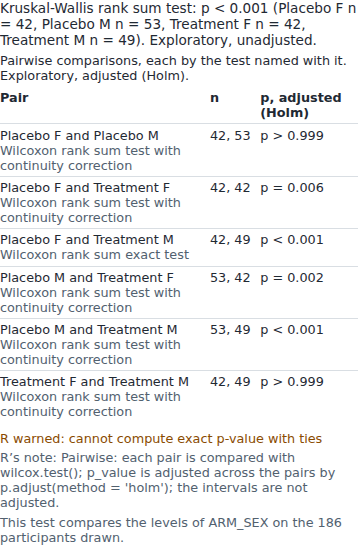
At a 390-pixel-wide viewport the chart with a pairwise table under it holds, and the page does not scroll sideways.
- pass browser GC-STAT-032: with a pairwise table under it the chart holds at a 390px-wide viewport, and the page does not scroll sideways (#16)
GC-STAT-033 pass
With R attached and no test chosen the page fetches nothing for R; the first test chosen starts R and fetches its file of functions, once.
GC-STAT-034 pass
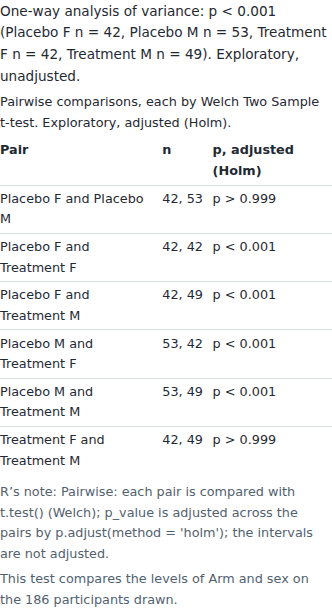
The gallery's demo draws first and starts R in the browser when its first panel asks for a test, from webR's pinned version and gsm.bio's vendored statistics file, with no R package installed. The line waits, saying what the first start costs, and then prints the Welch t-test, which equals desktop R's for the same rows within 1 part in 10^8.
GC-STAT-035 pass
On the demo, the Wilcoxon rank-sum test equals desktop R's for the same rows, and R is not started again.
GC-STAT-036 pass
On the demo, with four groups, the one-way ANOVA equals desktop R's for the same rows.
GC-STAT-037 pass
On the demo, the Kruskal-Wallis test equals desktop R's for the same rows.
GC-STAT-038 pass
On the demo, the pairwise comparisons, adjusted by Holm, equal desktop R's. Where R's own answer differs between the desktop's version and the browser's,
wilcox.testwith ties in groups of fewer than 50, both answers are recorded side by side, the difference is confirmed to be that case, and every other number is still held equal.GC-STAT-039 pass
On the demo, a filter change shows the waiting state and then the new result, which equals desktop R's, and never the old one.
GC-STAT-040 pass
On the demo, a group below the minimum size prints R's reason, once, and no number.
GC-STAT-041 pass
The megabytes and seconds of the demo's first test are measured, printed in the run's log and written to a file with both versions' answers, and are what the page tells its reader in the waiting text.
GC-STAT-042 pass
On a phone the demo prints R's result and a pairwise table, and the page does not scroll sideways.
- pass browser GC-STAT-042: on a phone the demo prints R’s result and a pairwise table, and the page does not scroll sideways (#16)
GC-OVW-001 pass
With no visit named in settings the chart opens on every visit, in visit order; visits that are named are the ones it opens on, as before. With no biomarker named it opens on none alone. Both settings default to null.
GC-OVW-002 pass
The most biomarkers the overview draws at a time is a setting,
overview_limit, twelve by default, a whole number of one or more; a value it cannot take is refused.GC-OVW-003 pass
The overview has one row per biomarker, in the Biomarker control's order, and in each row one panel per visit chosen, in visit order. A row is named for its biomarker and the unit of its values.
GC-OVW-004 pass
Every panel of the overview is the panel that biomarker's own view draws at that visit: one record per participant from the core's frame, with the number in each group beneath. Nothing is pooled across visits or across biomarkers.
GC-OVW-005 pass
Each biomarker has its own value axis, shared across its visits.
GC-OVW-006 pass
The group, the levels, the colour, the scale and the filters apply to every row of the overview. Panels by a further variable are not applied there, because the panels are the visits.
GC-OVW-007 pass
A baseline value has no visit, so each biomarker has one panel. For a change, a fold change or a percent change from baseline, the one baseline visit is not drawn, in the overview or in one biomarker's view: there the value is the same for every participant. With several baseline visits every visit is drawn.
GC-OVW-008 pass
A page of the overview holds at most the limit of biomarkers, in the control's order; every biomarker is on exactly one page; a page that does not exist is the nearest that does; and the overview says how many biomarkers it shows of how many.
GC-OVW-009 pass
The levels the overview offers are the group column's own, read from the table that holds it.
GC-OVW-010 pass
The many-biomarkers fixture is derived from the vendored study by a recorded rule: the results of the first forty participants at two visits, written three times, twice with a letter added to each biomarker's name, which makes thirty-six biomarkers. Deriving it again gives the committed file.
- pass unit the many-biomarkers fixture GC-OVW-010: deriving the fixture again from the vendored study gives the committed file, byte for byte, and it holds three times the overview’s limit of biomarkers (#17)
- pass unit the many-biomarkers fixture GC-OVW-010: every row of the fixture is a row of the vendored results, under its own biomarker’s name or that name with a letter added (#17)
GC-OVW-011 pass
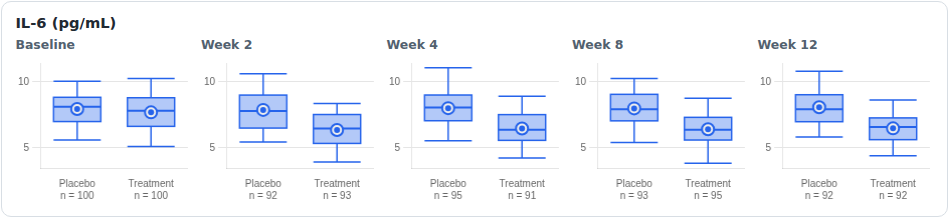
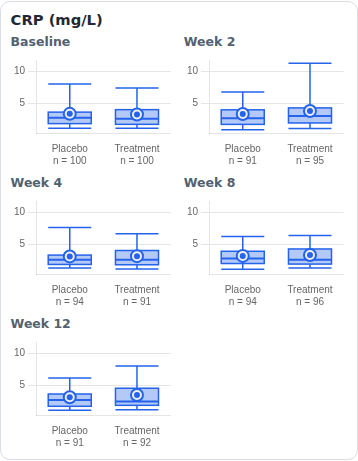
On the page, with no biomarker named, the chart opens on the overview: the Biomarker control reads All Biomarkers and the Visit control all visits; the twelve biomarkers of the synthetic study each show their five visits as small panels, drawn with the kit's Chart.js, with the number in each group and one value axis per biomarker; and there is no statistics line.
- pass browser GC-OVW-011: with no biomarker named the chart opens on every biomarker at every visit: a row each, a panel per visit, the number in each group, and no statistics line (#17)
GC-OVW-012 pass
A biomarker's row is a button named for it that opens the biomarker alone, by a click or by Enter or Space, with its visits as panels and a statistics line under each. All Biomarkers in the control returns to the overview, Reset returns to what the settings open on, and a setting that names a biomarker opens it.
GC-OVW-013 pass
The overview asks R for nothing, with R attached and R's hosts in reach: no call, no request to R's hosts, no waiting text and an empty
chart.statistics(), however it is redrawn. Opening a biomarker asks once per visit panel, each panel waits and is answered for itself while the page goes on answering clicks, and an answer that arrives after the overview is back is dropped.GC-OVW-014 pass
On the page the group, the levels, the colour, the mark, the scale, the value, the visits and the filters apply to the overview. Panel by is switched off there and says why, and there is no Statistics section until a biomarker is open.
GC-OVW-015 pass
With more biomarkers than the limit the overview draws a page of them, says how many of how many, and reaches the rest by Previous and Next above and below the rows; the charts alive at once are one page's; a biomarker opened from a page returns to that page; and the limit is a setting.
GC-OVW-016 pass
At a 390-pixel-wide viewport a biomarker's row is a card as wide as the page with its visits two to a line and every label level, a tap on it opens the biomarker at the chart's top, and the page does not scroll sideways.
- pass browser GC-OVW-016: at 390px a biomarker’s row is a card as wide as the page, its visits two to a line, and a tap on it opens the biomarker; the page does not scroll sideways (#17)
GC-OVW-017 pass
The first draw of twelve biomarkers at five visits, sixty charts, is timed at a desk's width and at a phone's, printed in the run's log and written to a file, and stays under a generous bound.
GC-OVW-018 pass
The gallery's demo opens on the overview, twelve biomarkers at five visits, with neither a biomarker nor a visit named, and fetches nothing for R, with R's hosts in reach, until a biomarker is opened.
GC-OVW-019 pass
On the demo, with real R in the browser, the overview starts no R; opening a biomarker starts it once, its five visit panels each wait and print the test, which equals desktop R's for that panel's rows within 1 part in 10^8; and returning to the overview and opening another biomarker fetches nothing more.
GC-LIFE-001 pass
init,setData,setSettings,render,resizeanddestroydrive the chart as they drive a safety.viz chart.GC-LIFE-002 pass
Tables the chart cannot read are refused with a message, shown in the chart's element.
GC-LIFE-003 pass
The chart can be mounted inside another chart's element on one biomarker, with a way back: the setting
backputs a button above the chart that calls the caller's function with the chart, by a click or from the keyboard; without it there is no button.GC-MOBILE-001 pass
At a 390-pixel-wide viewport the chart fills the width with its controls folded away one tap from open, panels stack one to a row, and the page does not scroll sideways.
- pass browser GC-MOBILE-001: at 390px the chart fills the width with its controls folded away one tap from open, and the page does not scroll sideways (#9)
GC-MOBILE-002 pass
At a 390-pixel-wide viewport a box can be tapped, its listing read and a profile opened below the chart, and the page still does not scroll sideways.
GC-SITE-001 pass
The gallery lists the group comparison chart with its picture and links to its live demo, its evidence page and its API reference.
GC-SITE-002 pass
The live demo draws the chart on the synthetic study from safety.viz's vendored bundle and bio.viz's committed one, with R attached and gsm.bio's statistics file published beside it. Where R's host cannot be reached it still draws, and its statistics line says that R could not be started.
GC-SITE-003 pass
The live demo holds at a 390-pixel-wide viewport with no horizontal scroll.
- pass browser GC-SITE-003: the live demo holds at a 390px-wide viewport with no horizontal scroll (#9)

GC-SITE-004 pass
The API reference has a table row for every setting the chart has; the site build fails when one is missing.
GC-STAT-043 pass
When the connection is replaced (
setSettings({ connection })), an answer that arrives late from the connection it replaced is never shown: it changes neither the statistics line nor whatchart.statistics()reports.GC-FAIL-001 pass
When drawing fails, the group comparison says so in its footnote (
This chart could not be drawn:and why), takes away what was drawn of the panels, ends the statistics round, empties the listing and the participant rail, says it in the danger colour and keeps its controls; once drawing works again it draws.GC-DROP-001 pass
With a participant table, a participant the results have and the table does not is left out and counted (
Not in the participant table), and a row of results with no participant id is counted (Row has no participant id); a participant table without the participant id column is refused with a sentence that names the column.GC-STAT-044 pass
A stored result written by the R recipe from a data frame whose panel column holds numbers is found by the chart: the recipe writes the panel, the measure, the visits, the groups and the filters as text, as the chart does (
chart_text).GC-DROP-002 pass
With results for participants the participant table does not have and filters that let nobody through, the chart says
No participant passes the filters., as it does with no such rows.GC-DROP-003 pass
A setting that names a participant id column the participant table does not have (
setSettings({ participant_id_col })) is refused with the same sentence as the tables are, before anything changes, and the chart stays as it was drawn.GC-STAT-045 pass
The recipes'
chart_textwrites each value as the chart'sString()does: logicals astrueandfalse, numbers in the fewest digits that read back the same, in full from 1e-6 to below 1e21 and with an exponent outside that.GC-FAIL-002 pass
A failure while the controls are built, where the Levels control reads the groups, is said like any other: the footnote says the chart could not be drawn, and nothing is thrown.
GC-DRAW-007 pass
With one biomarker open at several visits, the groups' labels under each visit's panel do not run into one another, at 1280 and at 390 pixels wide: they stay level when they fit and turn when they would not.
GC-CTRL-008 pass
With one biomarker open, the Visit control offers, and the chart draws, only the visits that biomarker has values at, in visit order; the overview offers every visit.
GC-DROP-004 pass
The participant table and the setting that names its id column change together:
setData(tables, settings)checks the tables against the settings it is given with them, lays the settings over, and draws.GC-OVW-020 pass
In the overview every visit keeps its panel in every row, so a biomarker with no result at one visit has an empty panel there and its row lines up with the others; only the one-biomarker view draws only that biomarker's visits.
GC-DRAW-008 pass
With five long arm names, the groups' labels under each visit's panel do not run into one another at 1280 pixels wide.
GC-STAT-046 pass
The recipes'
chart_textwrites NaN asNaN, and holds to the chart'sString()for numbers of 13 significant digits, the most its claim covers.GC-CUT-001 pass
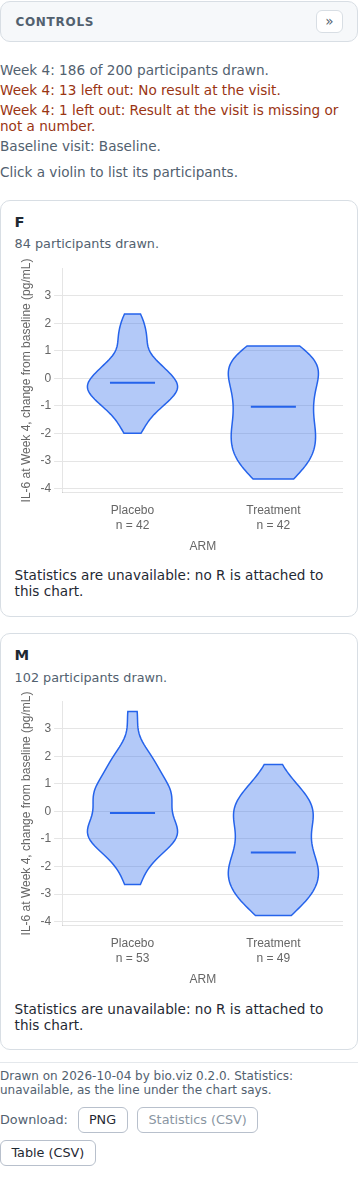
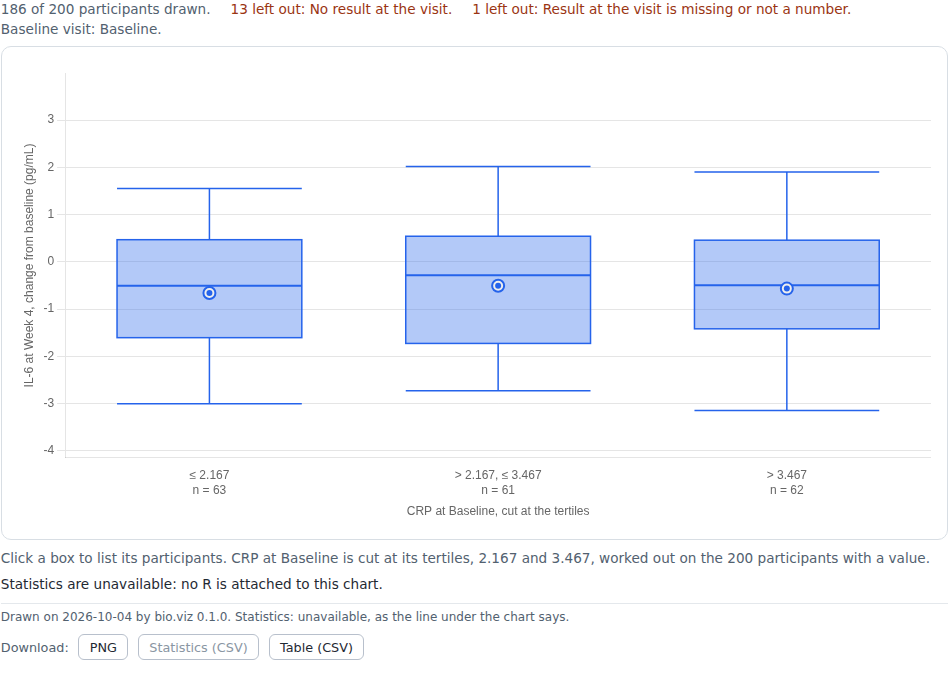
The chart draws a biomarker by a cut biomarker as its category: IL-6's change to Week 4 by CRP at Baseline cut at the median, the tertiles, the quartiles and typed points, on the synthetic study, the groups low to high with the number in each beneath, each participant in the group desktop R puts them in.
- pass browser GC-CUT-001: IL-6’s change to Week 4 by CRP at Baseline cut at the median, the tertiles, the quartiles and typed points: the groups low to high, each with R’s count beneath (#43)
- pass unit group comparison: a cut biomarker GC-CUT-001: the panels’ groups are the cut’s, low to high, each participant in the group R puts them in (#43)
GC-CUT-002 pass
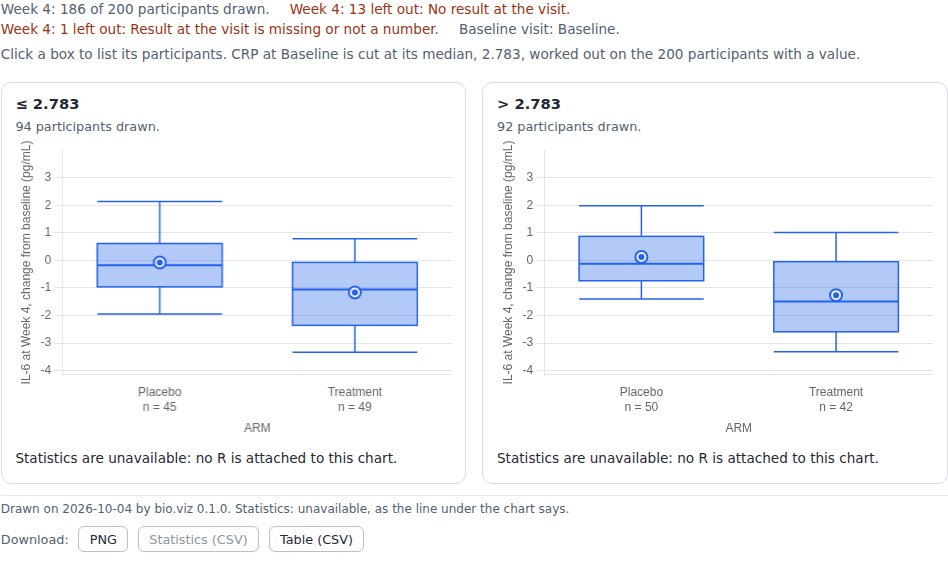
With a cut category or panel the footnote states the cut and its points, and how many participants' values they were worked out on.
GC-CUT-003 pass
A cut biomarker can make the panels, in its order low to high, each panel holding the participants desktop R puts in that group.
GC-CUT-004 pass
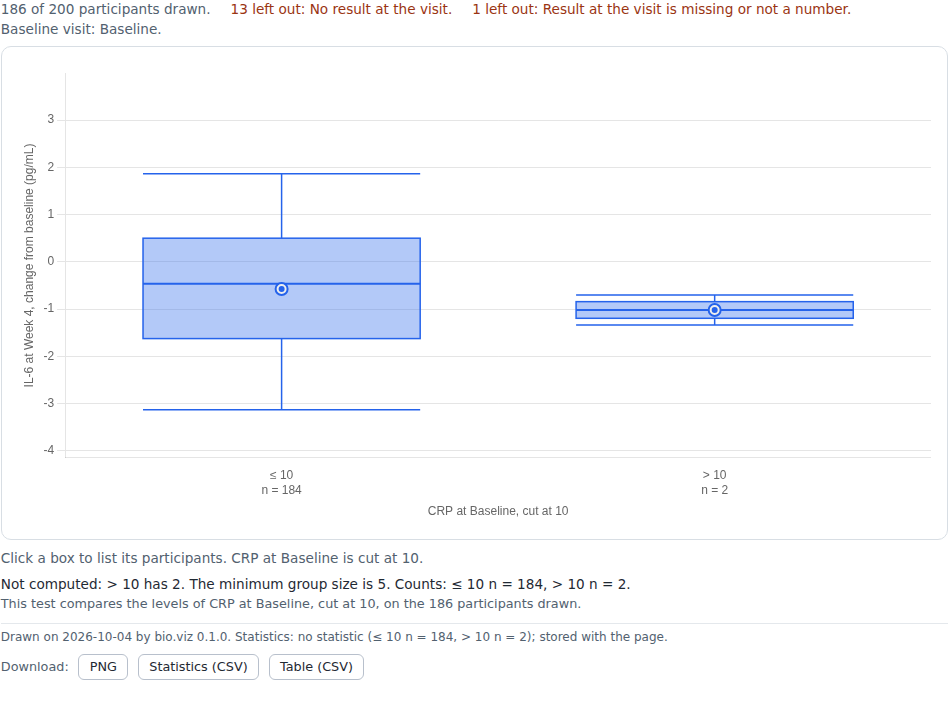
When repeated cut points collapse, or points written alike merge groups, the footnote says so and how many groups they make instead; a cut variable with no value says it makes no groups.
- pass unit group comparison: a cut biomarker GC-CUT-004: the footnote says the points, how many values they were worked out on, and when repeated points collapsed or points written alike merged groups (#43, #46)
GC-CUT-005 pass
group_byandpanel_bytake a column or a cut variable, which the settings keep as the core writes one; a variable with no cut, or a malformed cut, is refused with a sentence, and so is a cut of a biomarker or a column the tables do not have;color_bystays a column.- pass unit group comparison: a cut biomarker GC-CUT-005: `group_by` and `panel_by` take a column or a cut variable, written as the core writes one; a variable with no cut, a malformed cut, or a cut of what the tables do not have, is refused with a sentence (#43, #46)
GC-CUT-006 pass
A cut's points are worked out on the participants the filters keep who have a value of the cut variable, whether or not they have a value to draw, so a visit's panels share one set of groups; they move when the filters do.
GC-CUT-007 pass
The statistics request names a cut category in the identity of its rows as the cut variable written by the settings' own names, and the groups by their labels, so a stored result written from R is found.
GC-CUT-008 pass
A cut category has no Levels control: every group it makes is drawn, and the controls say so.
GC-CUT-009 pass
R is handed a cut category's groups low to high (
chrGroups), so its result names them in the order they are drawn and a difference in means is of the lower minus the higher; the identity of the rows keeps them sorted by code point, and a column's groups are not named, so v0.1.0's keys are unchanged.- pass unit group comparison: a cut biomarker GC-CUT-009: R is handed a cut’s groups low to high, so its result names them in that order, while the identity of the rows keeps them sorted by code point; a column’s groups are left to R (#43, #46)
GC-CUT-010 pass
With R's stored answers for cut groups, the statistics line names the groups low to high, and a group below R's minimum size prints R's reason and counts, as R worded them.
- pass browser GC-CUT-010: with R’s stored answers for cut groups R made itself, the result names the groups low to high, and a group below R’s minimum size prints R’s reason and counts (#43, #46)
Checking this page
npm ci
npm run evidence:check   # rerun every test and compare with the committed evidence set
npm run evidence         # rebuild docs/evidence/group-comparison/evidence.json