gsm.safety provides R bindings for the safety.viz JavaScript chart library: nine interactive clinical safety displays as htmlwidgets — one for every renderer the library ships — plus bundled example data and report workflows for Good Statistical Monitoring. It mirrors the gsm.kri / gsm.viz architecture.
Gallery
Each thumbnail links to a live, interactive example rendered from the bundled demo data.
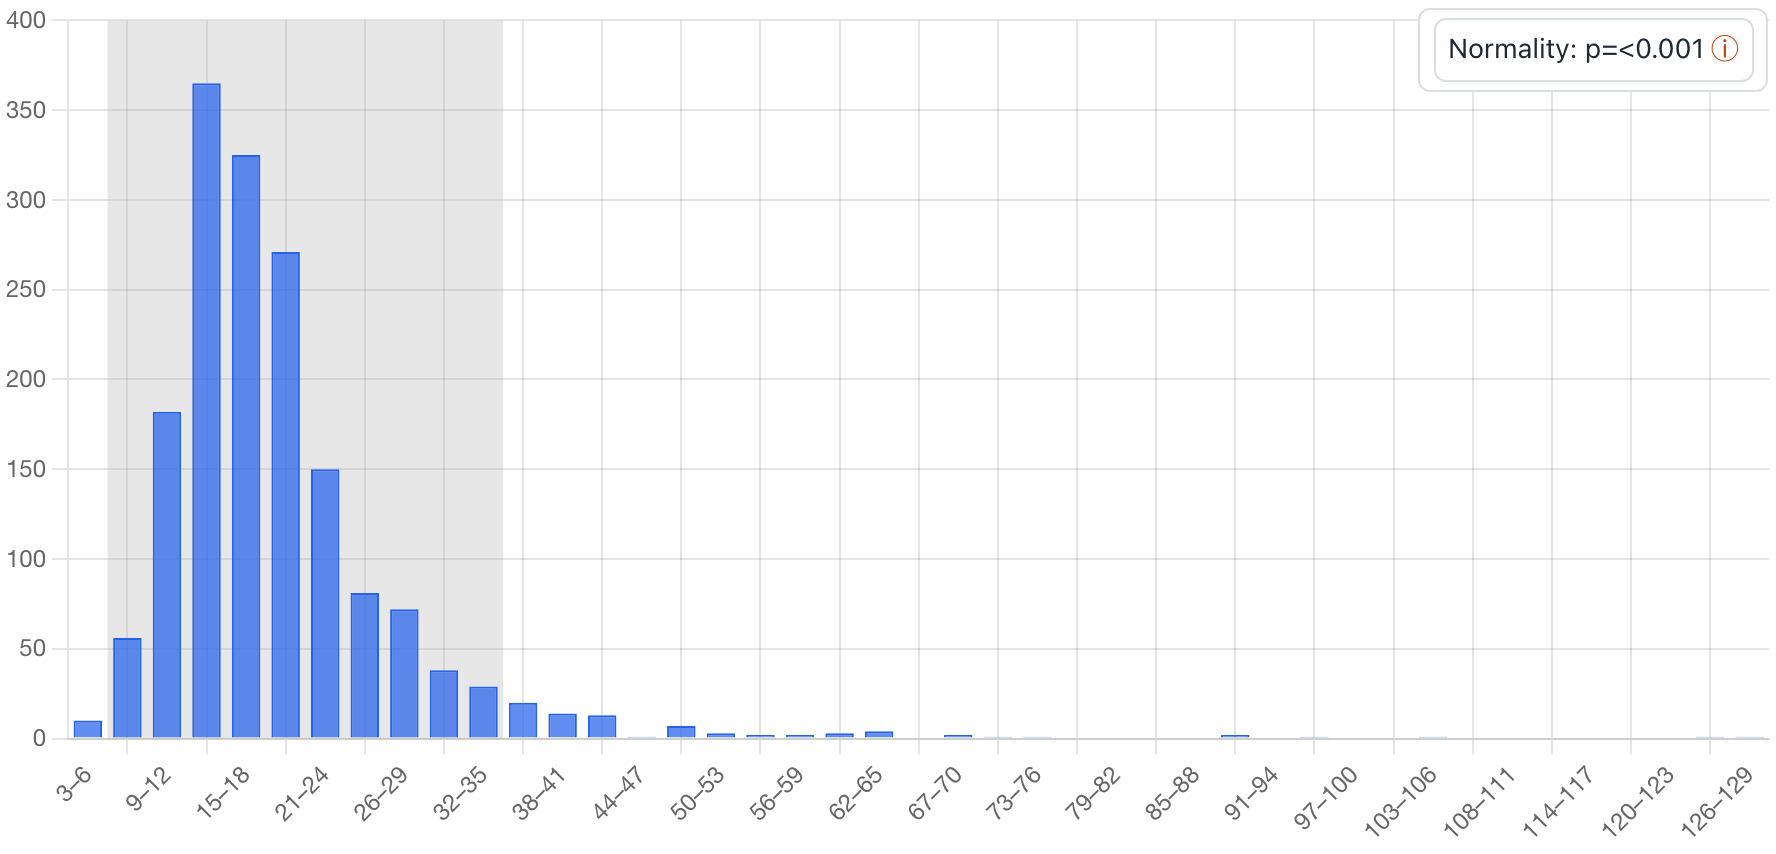
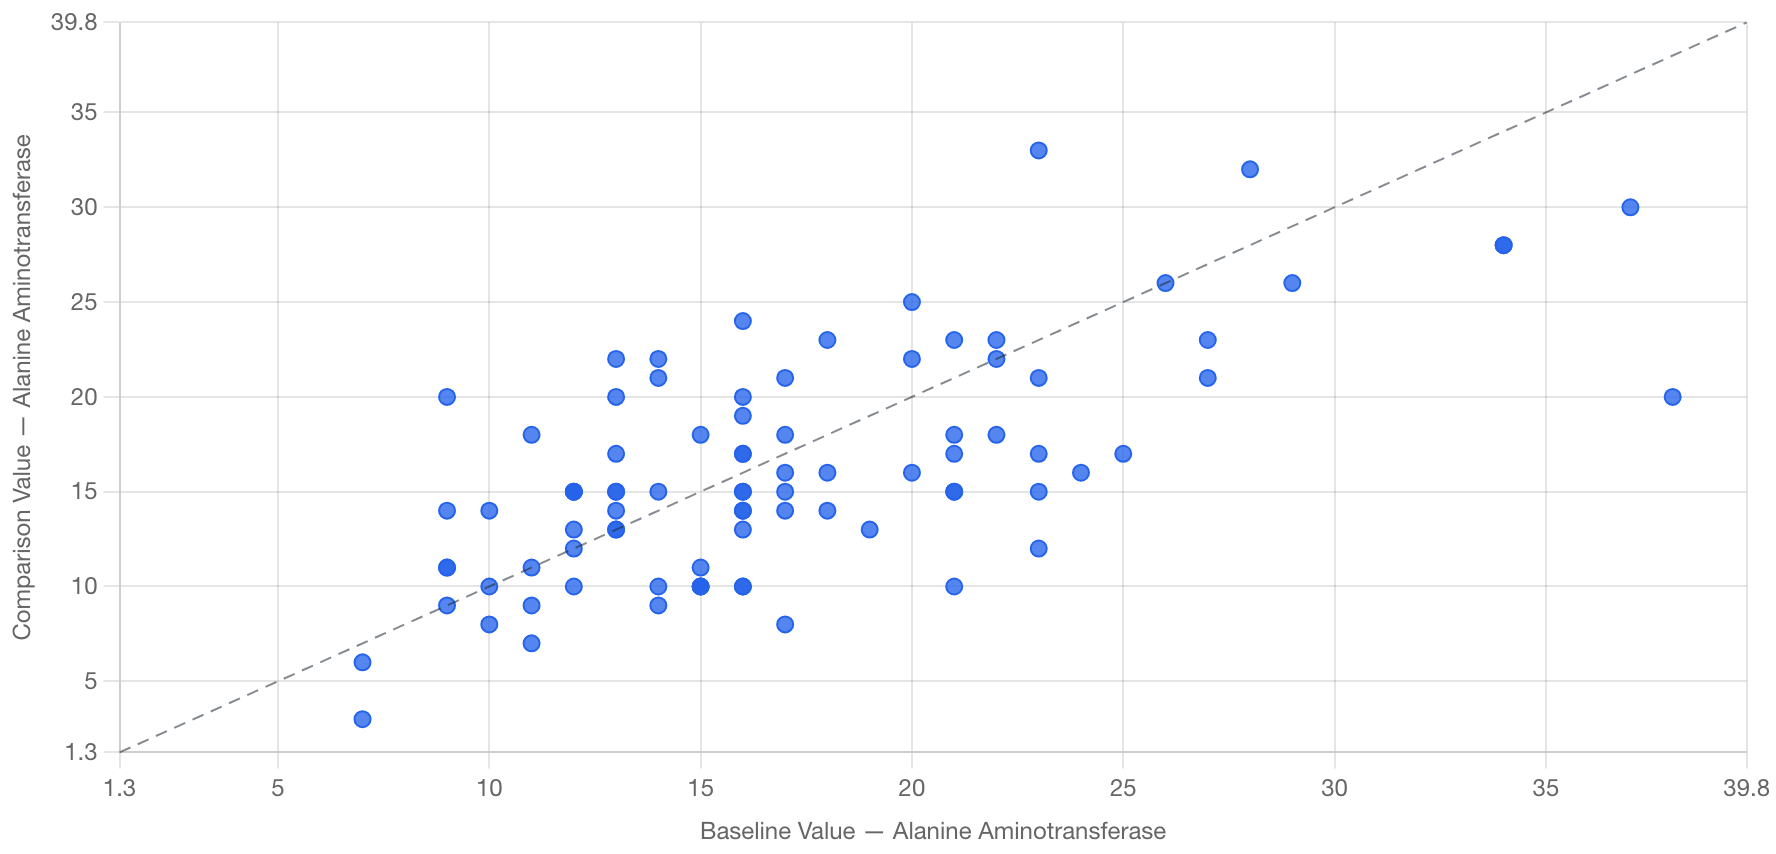
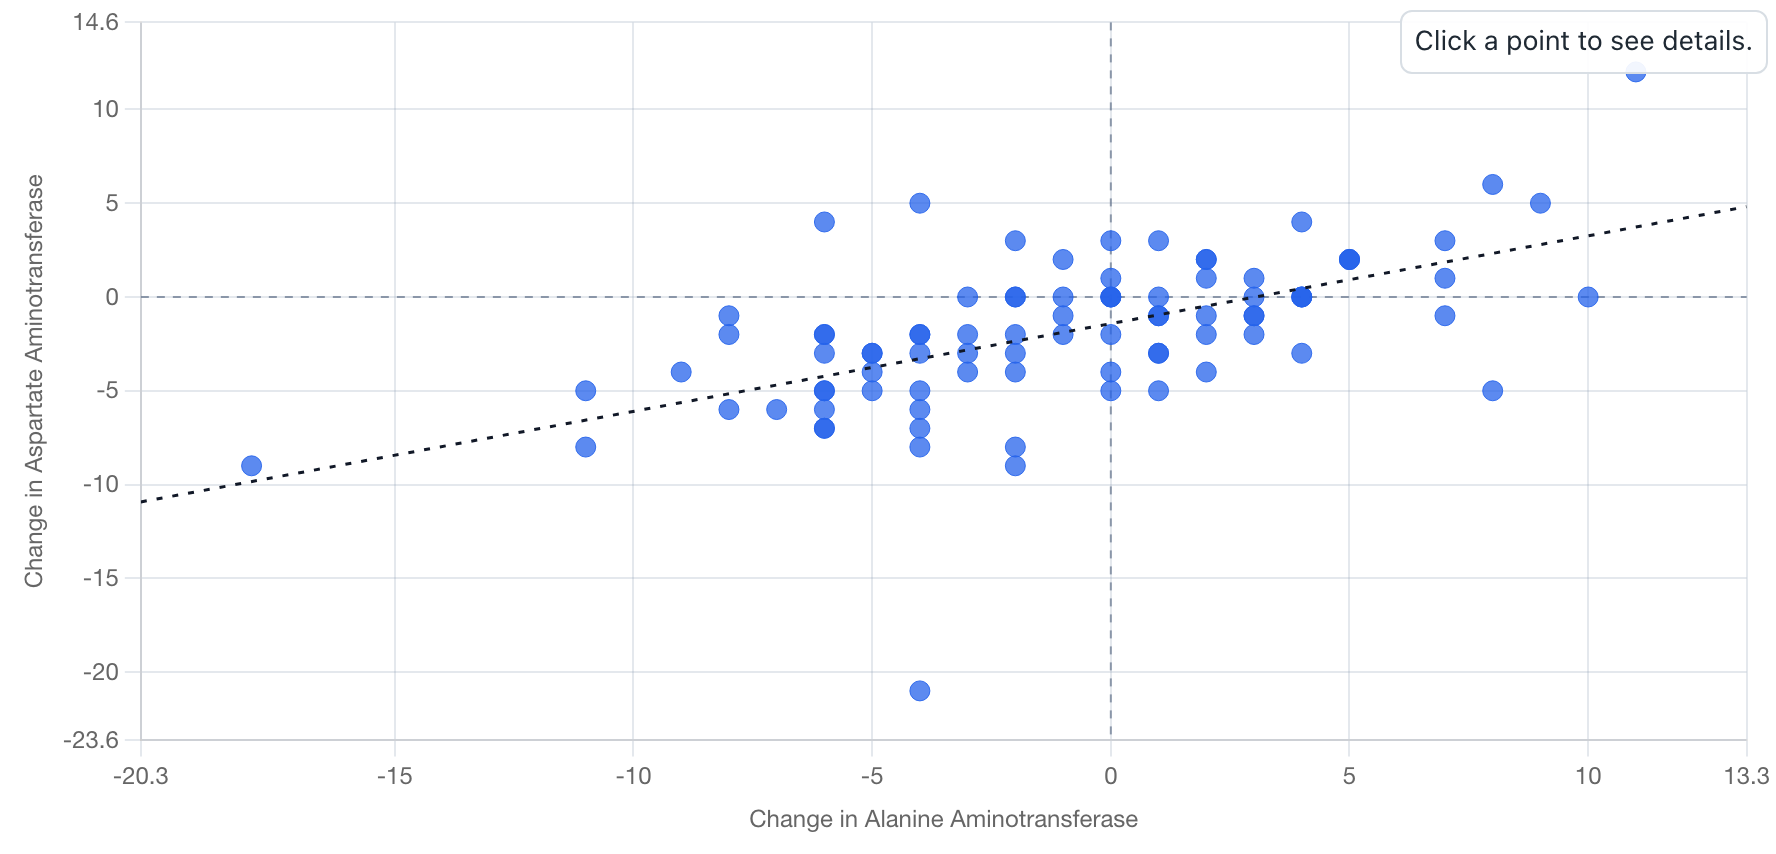
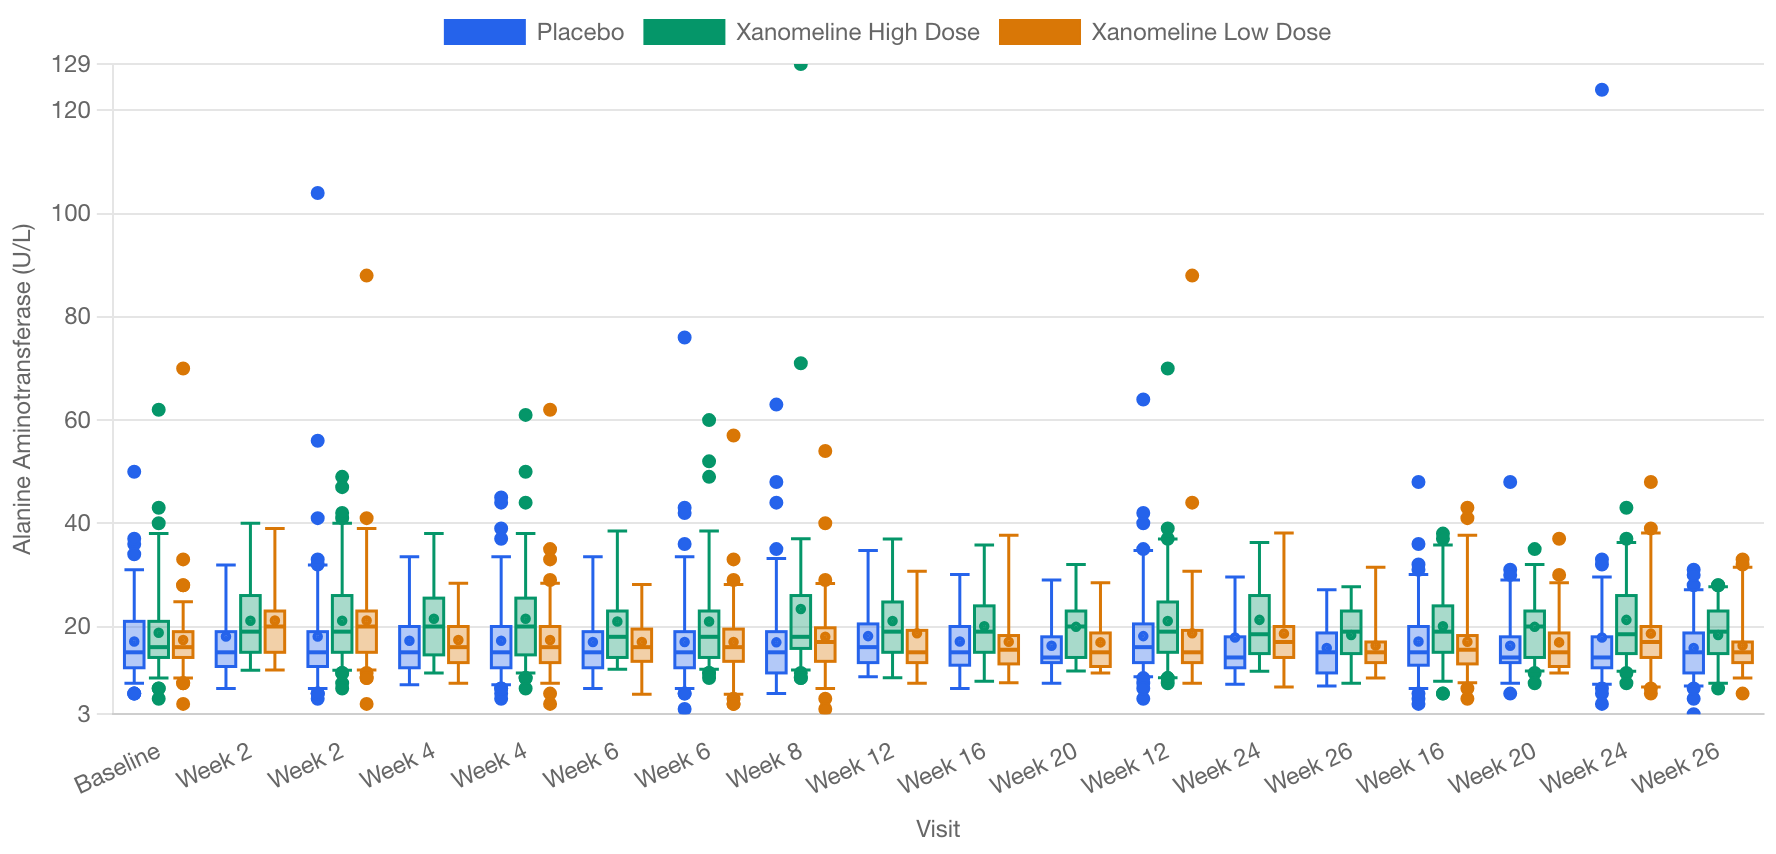
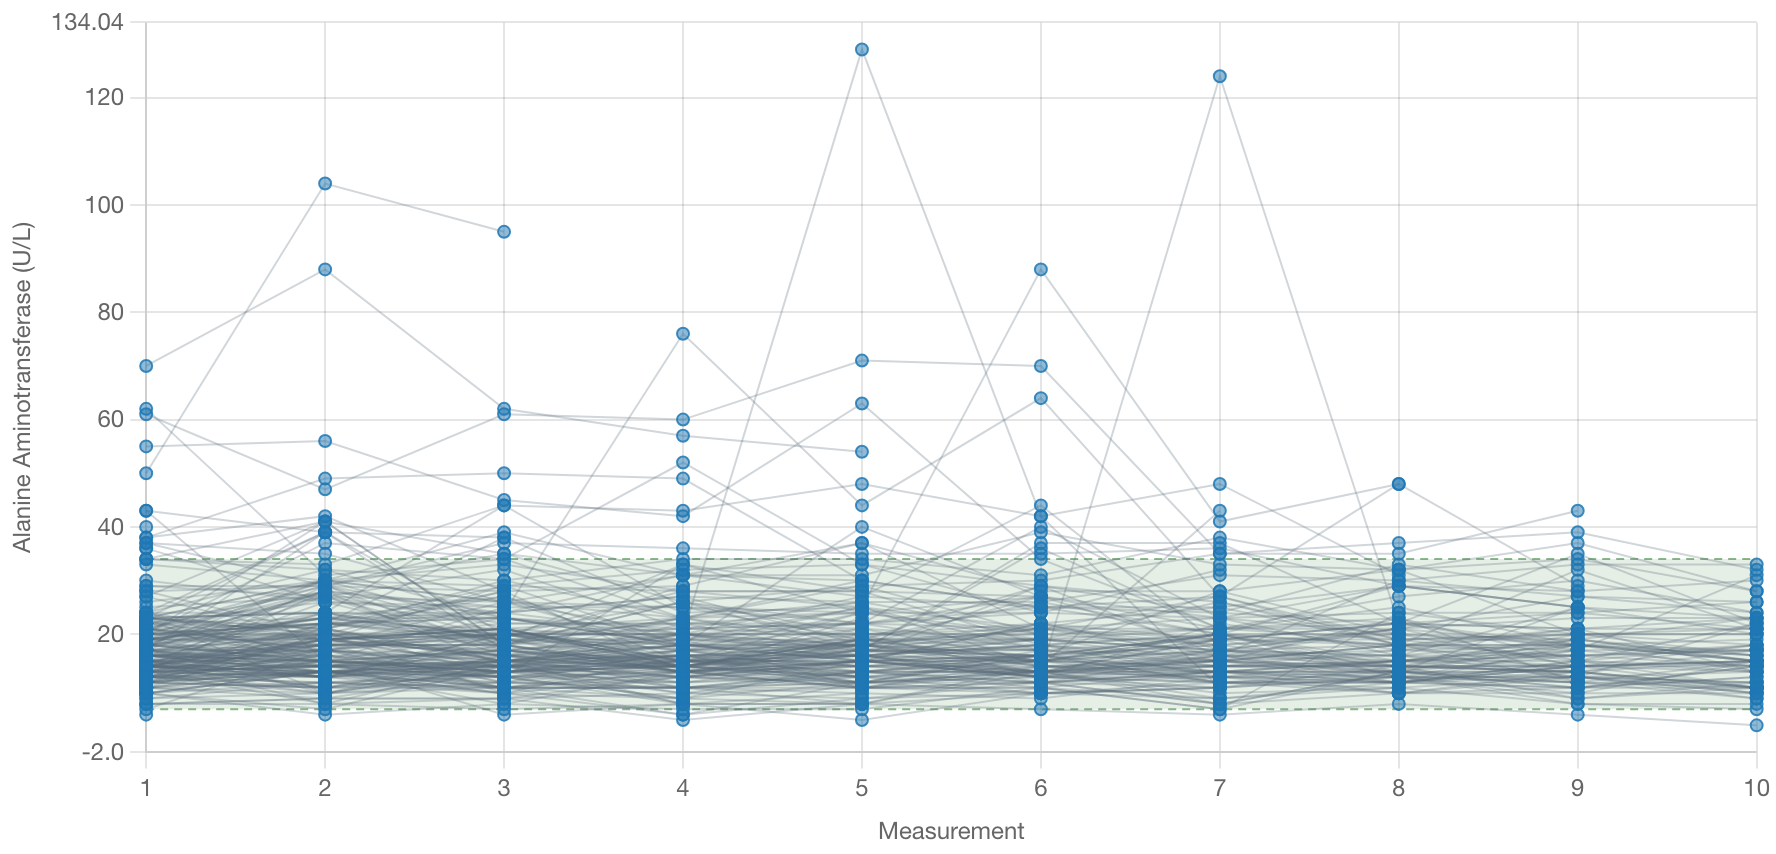
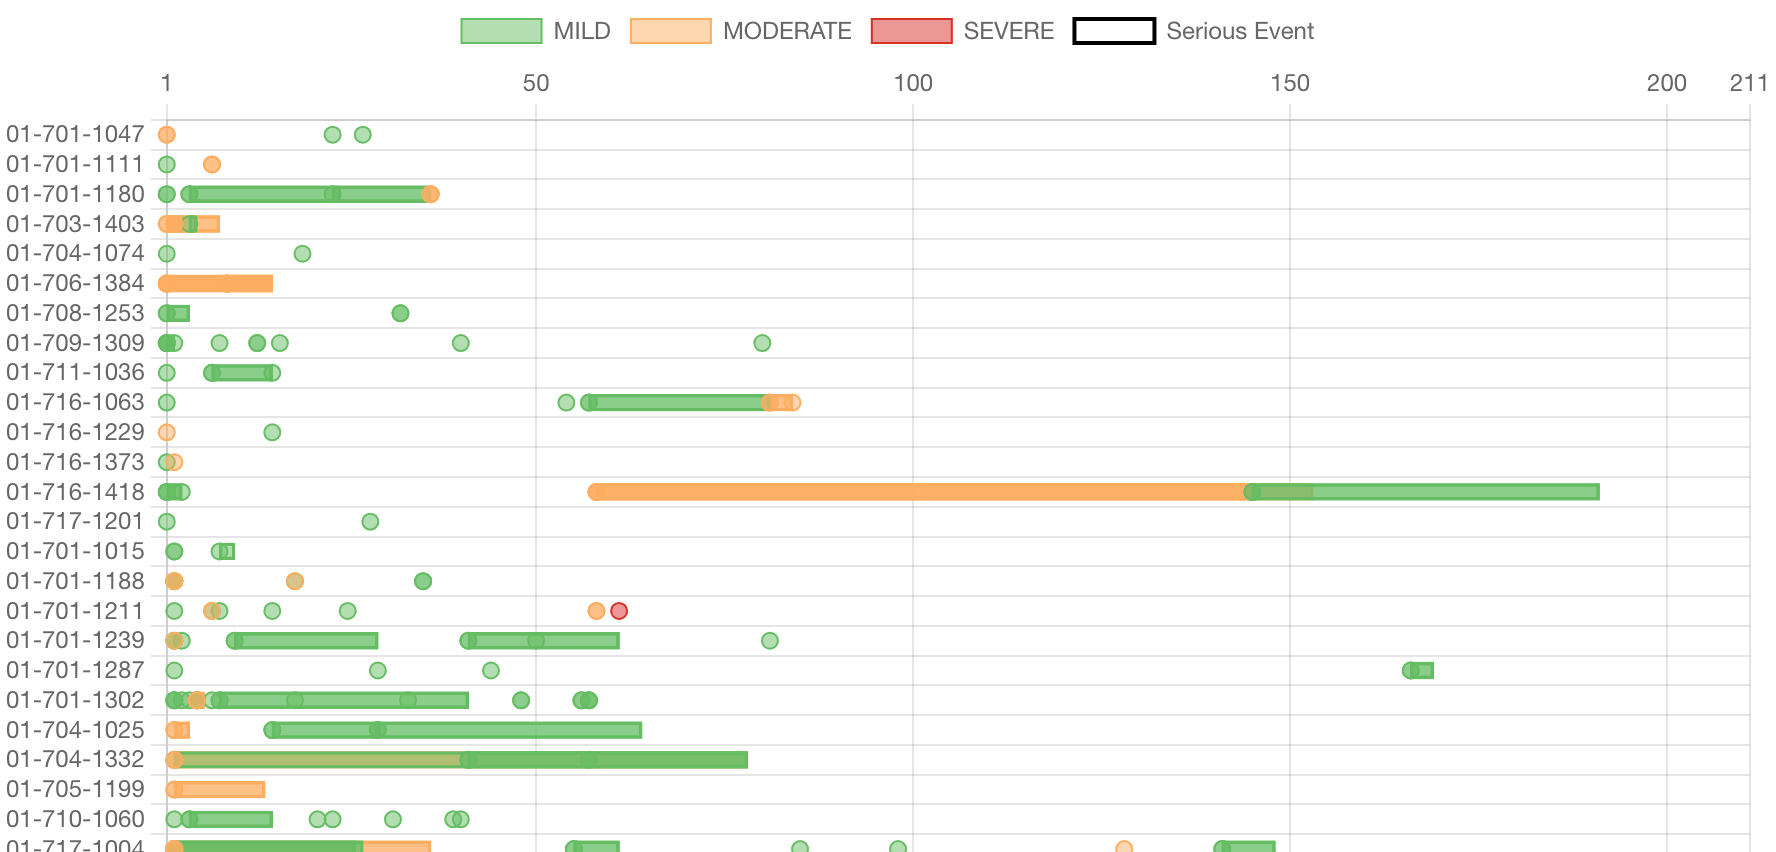
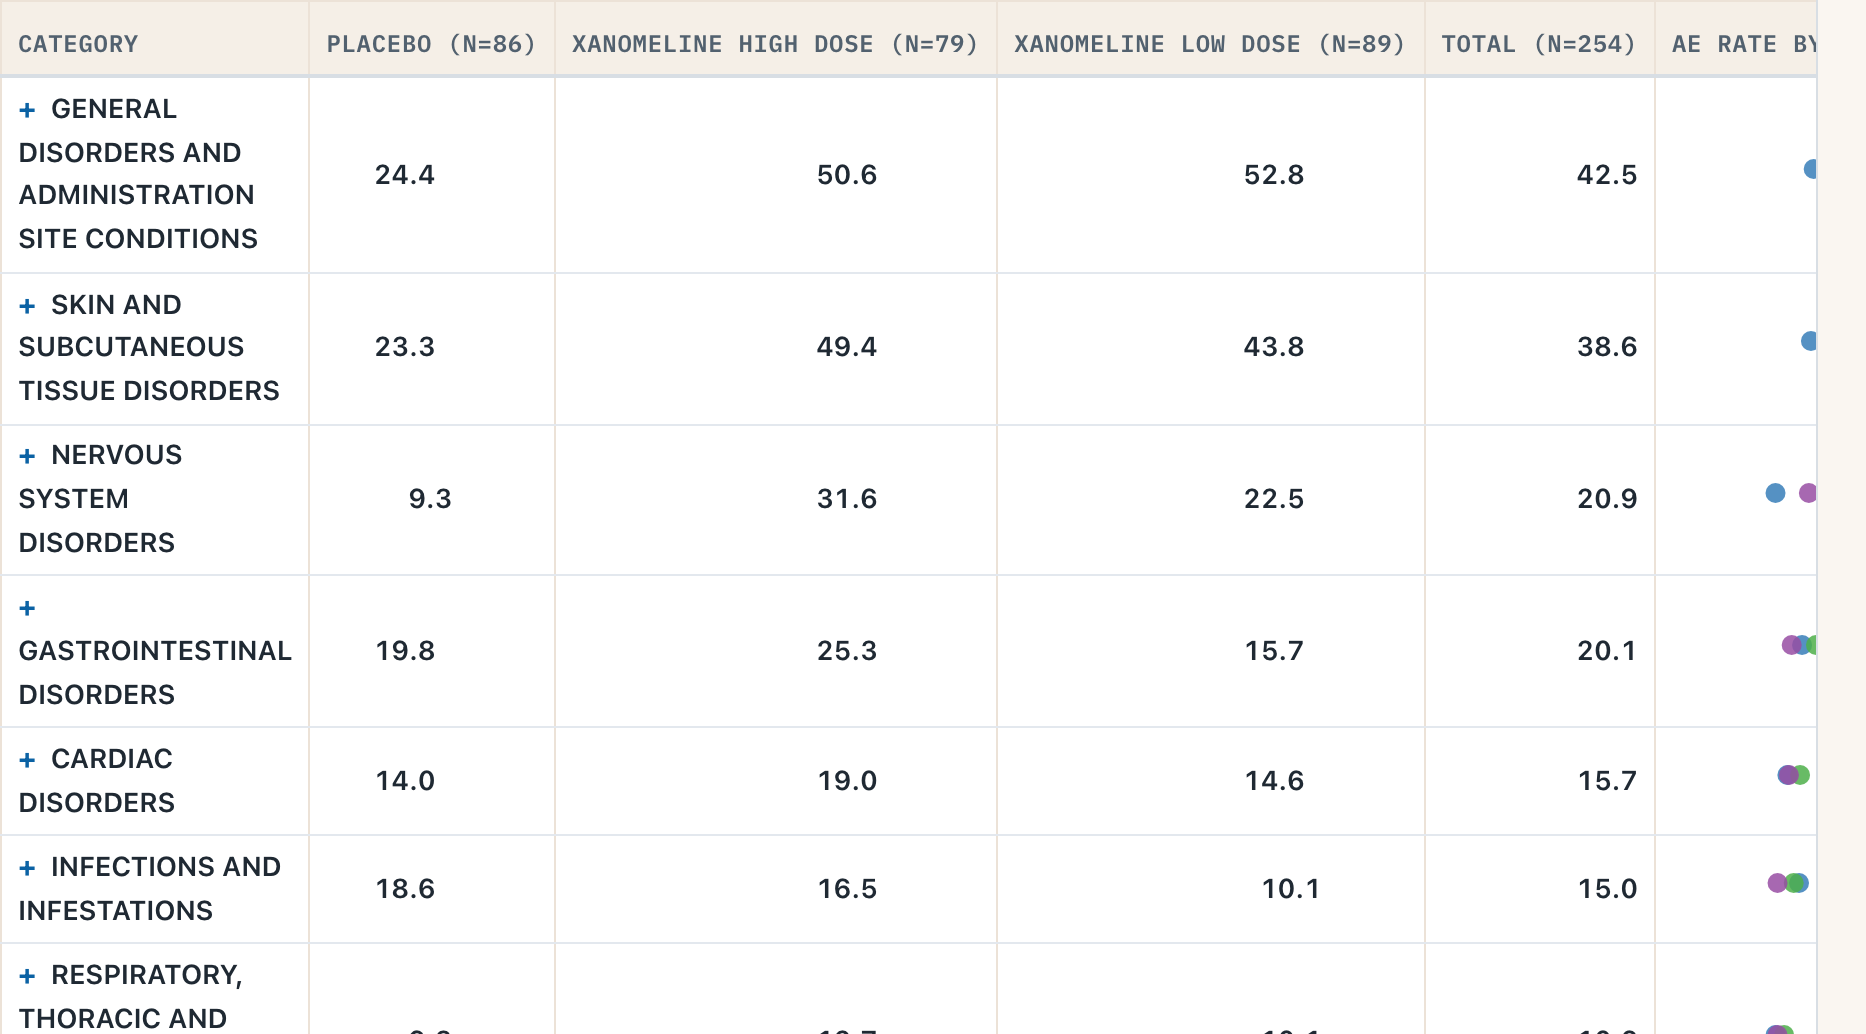
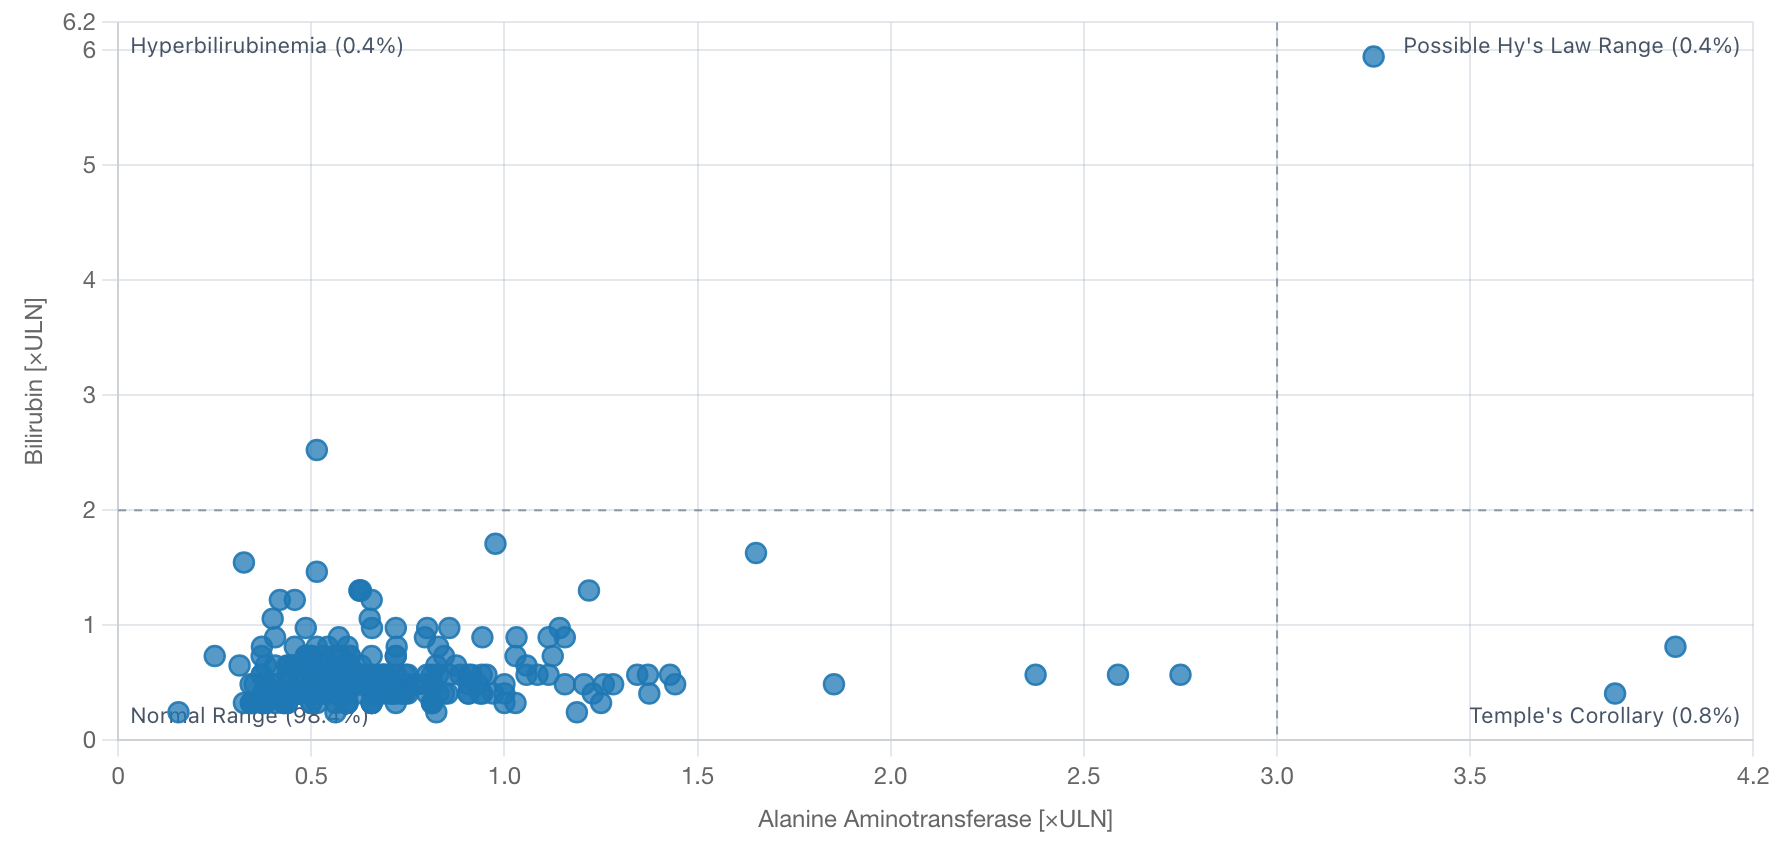
Widgets
| Widget | safety.viz module | Data | Report workflow |
|---|---|---|---|
Widget_Histogram() |
histogram | adbds |
safety_histogram.yaml |
Widget_ShiftPlot() |
shiftPlot | adbds |
safety_shift_plot.yaml |
Widget_DeltaDelta() |
deltaDelta | adbds |
safety_delta_delta.yaml |
Widget_ResultsOverTime() |
resultsOverTime | adbds |
safety_results_over_time.yaml |
Widget_OutlierExplorer() |
outlierExplorer | adbds |
safety_outlier_explorer.yaml |
Widget_AeTimelines() |
aeTimelines | adae |
ae_timelines.yaml |
Widget_AeExplorer() |
aeExplorer | adae |
ae_explorer.yaml |
Widget_HepExplorer() |
hepExplorer | adbds |
hep_explorer.yaml |
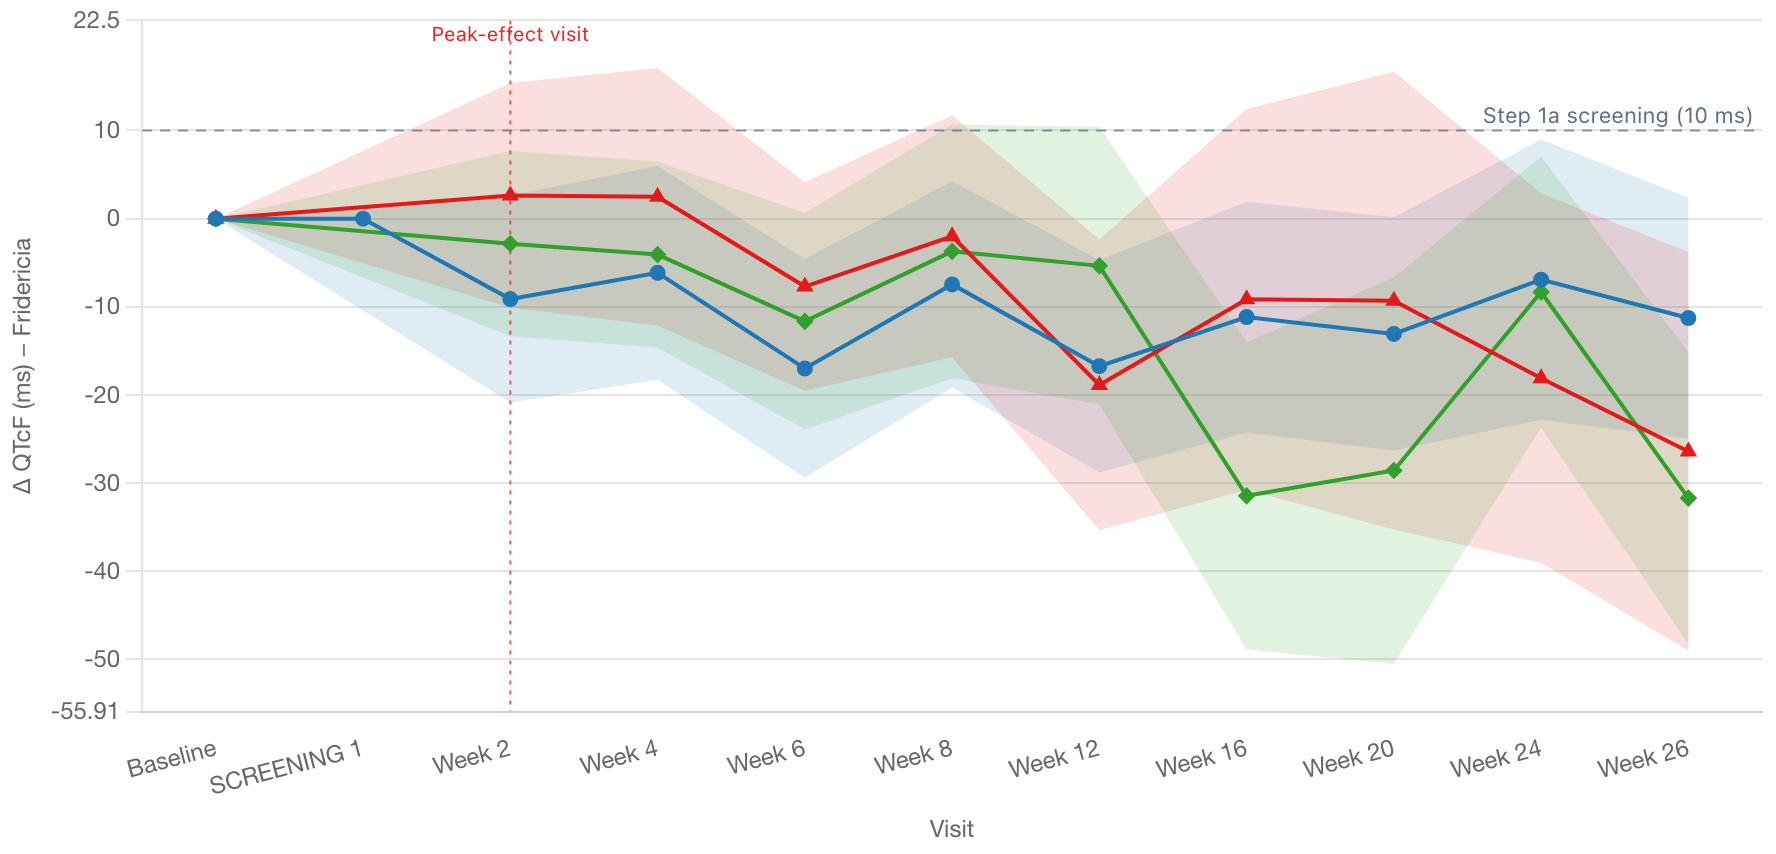
Widget_QtExplorer() |
qtExplorer | adeg |
qt_explorer.yaml |
Each widget validates its data and settings against the module’s vendored JSON data contract (inst/schema/) before rendering, so column-mapping mistakes fail fast in R.
Usage
library(gsm.safety)

# Bundled pharmaverseadam-derived demo data (same data as the safety.viz site demos)
dfResults <- ExampleData("adbds") # long-format labs and vitals
dfAE <- ExampleData("adae") # adverse events
dfEG <- ExampleData("adeg") # ECG: QTcF, QTcB, heart rate

# Render a widget in the viewer
Widget_Histogram(dfResults, lSettings = list(group_by = "ARM"))

# Or save any widget as a self-contained HTML report
SaveWidgetReport(
  Widget_Histogram(dfResults),
  strOutputDir = tempdir(),
  strOutputFile = "histogram"
)
Settings are merged onto each module’s defaults client-side, so only overrides are needed; the defaults already match the example data column names.
Participant-level metrics
inst/workflow/2_metrics/ holds three participant-level safety metrics, the gsm.safety counterpart to gsm.kri’s site- and country-level KRIs. Each scores one row per participant with an ordinal tier, follows the pat0015.yaml precedent (GroupLevel: Subject, Model: Identity, gsm.core::Analyze_Identity() plus deterministic gsm.core::Flag() thresholds), and emits the standard analyticsSummary contract.
| Metric | ID | Score | Cut-points |
|---|---|---|---|
| Hy’s Law candidate | saf0001 |
eDISH quadrant tier 0-3 |
inst/schema/hep-explorer.json — 3xULN aminotransferase, 2xULN bilirubin |
| QTcF prolongation | saf0002 |
ICH E14 outlier tier 0-3 |
inst/schema/qt-explorer.json — 450/480/500 ms absolute, 30/60 ms change |
| Serious / related AE | saf0003 |
AE review tier 0-3 | seriousness, causality, CTCAE grade |
Every cut-point lives in the workflow’s meta block, not in R, so a flag is traceable to the chart it came from and the threshold that produced it without reading source. Tier 0 is green, tiers 1-2 amber, tier 3 red.
Two of the three take their thresholds straight from the vendored JSON data contract of the chart they correspond to, so the metric and the chart cannot drift apart. The AE metric has no published cut-point to inherit — seriousness and relatedness are flags, not scales — so its tier ladder is a design decision documented in ?Input_SafetyAE.
The metrics score participants, not sites: they set GenerateRiskSignal: false so a participant queued for review never moves a site’s risk score.
Report workflows
Report workflows under inst/workflow/4_modules/ render each widget end-to-end via gsm.core::RunWorkflow(). Matching runner scripts live in inst/examples/:
4_modules is the standard gsm phase directory for meta.Type: Report workflows — the same one gsm.kri uses for report_kri_site.yaml. The four numbered phases are 1_mappings (gsm.mapping), 2_metrics, 3_reporting (gsm.reporting) and 4_modules, and gsm.safety now populates two of them: the participant-level metrics below and these report modules.