Adverse Event Explorer: test evidence Adverse Event Explorer is exploratoryQualifiedValidated for regulated use. Nothing in safety.viz is, yet.ExploratoryThis chartTested and documented. Confirm every result.ExperimentalTested and documented, but what it shows or how it behaves may still change.PrototypeAn early look, on the docs site only. Not in the demo app.What each rung means
Requirement-traced qualification evidence for the safety.viz ae-explorer module.
Requirement matrix ↗ — the reviewed source specification these tests trace to.
- Scope
- 41 coverage rows74 distinct requirement IDs
- Tests executed
- 1237 automated checks199 browser · 1038 unit
- Result
- pass all passing4 evidence screenshots
- Generated
- 2026-10-15 11:14 UTC
- Environment
linux 6.17.0-1022-azure · node v22.23.3 · playwright 1.61.1 · chromium 149.0.7827.55- Test run
- Actions run #38725854744
Scope & approach
Traceability for the ae-explorer module (a dependency-free DOM/SVG reimplementation of RhoInc/aeexplorer v3.4.1 matching the original renderer's behavior, under #60), per the convention in CONTRIBUTING.md. Requirement IDs are the AE-* rows of the harvested matrix at requirements/aeexplorer.md; rows are routed to Vitest (transforms) or Playwright (interaction/visual behavior) by judgment, since every source row is still typed planned.
Each table row traces one requirement to the automated test(s) that evidence it: the Requirement column shows the reviewed requirement text and its ID, the source-matrix rows link back to the specification, the issue column links the implementing work, and the result column shows the recorded outcome of every matching test from the committed evidence.json with its captured screenshots. Browser evidence is captured at fixed conditions (1280×800, device scale 1) on the canonical Linux CI environment.
Browser evidence (Playwright — tests/e2e/ae-explorer.spec.js)
19 requirement rows · 19 tests
| Requirement | Source matrix rows | Issue | Tests & evidence |
|---|---|---|---|
AE-DATA-003/AE-API-001 AE-DATA-003 No customization is needed to initialize a chart when the AE-API-001 A factory to create a custom | AE-DATA-003, AE-API-001 | #60 |
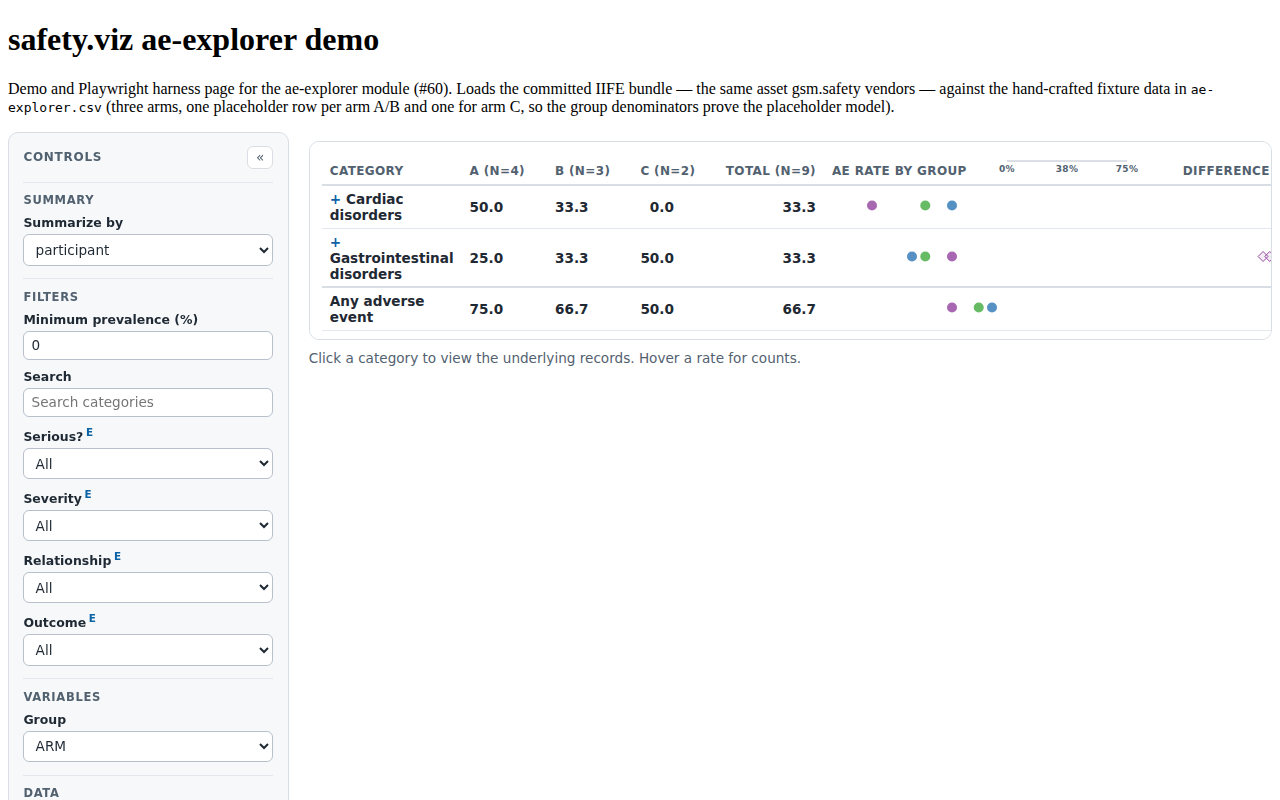 |
AE-DATA-001 (denominators) AE-DATA-001 AE Explorers are initialized using JSON data files that match the format created by d3.csv(). The chart requires a data set with one record per adverse event and optionally with placeholder rows for participants who didn't experience any adverse events over the course of the study. The chart uses column names from the ADAM data standard by default, but can be customized to work with any column names as long as the data structure is as expected. | AE-DATA-001 | #60 |
|
AE-USER-014/015, AE-REG-001/002 AE-USER-014 The preferred terms for a given system organ class are hidden on the default view. To show the hidden preferred terms rows, click on the '+' to the left of a given system organ class in the category column. This will expand the table to show the nested rows for this system organ class. AE-USER-015 The preferred terms for a given system organ class are hidden on the default view. After a category has been expanded, you can hide the nested rows by clicking on the '-' to the left of a given system organ class in the category column. This will collapse the table to hide the nested rows for this system organ class. AE-REG-001 Confirm that clicking on the "+" to the left of each category name expands the dataset AE-REG-002 Confirm that clicking on the “-“ to the left of each category name after it is expanded collapses the dataset | AE-USER-014, AE-USER-015, AE-REG-001, AE-REG-002 | #60 |
|
AE-REG-008 AE-REG-008 Confirm that summarizing by 'participant' displays the number of participants who experienced an AE of the corresponding category by group | AE-REG-008 | #60 |
|
AE-USER-006, AE-REG-009/033/035 AE-USER-006 This toggle option allows the user to view the adverse events data by participant or event. Summarizing AEs by participant presents the number of participants who experienced an AE of the corresponding category at least once by group. Summarizing AEs by event presents the number of events of the corresponding category by group. The chart defaults to display the participant data, which displays the adverse events. AE-REG-009 Confirm that summarizing by 'event' displays the number of events of the corresponding category by group AE-REG-033 Confirm that the following settings summarize the data by participant on default: AE-REG-035 Confirm that the following settings summarize the data by event on default: | AE-USER-006, AE-REG-009, AE-REG-033, AE-REG-035 | #60 |
|
AE-USER-001, AE-REG-007/012/013 AE-USER-001 This is a text box feature which is used to filter out all adverse events below the percentage entered. The default is 0%, but the default value can be adjusted according to the user's needs. Users can type any alphanumeric value into this box. Values must be numeric for the filter to work. After hitting Enter or clicking outside the box, the Explorer will hide the data rows where the prevalence for all groups is below the threshold entered. If any group has a prevalence at or above the threshold entered, it will be displayed on screen with all nested categories shown. To return to the default view, the user must either refresh the page or enter 0 into the filter box and again hit Enter or click outside the box. AE-REG-007 Confirm that entering a minimum prevalence will filter the data based on the entered threshold AE-REG-012 Confirm that the "Filter by prevalence" field no longer accepts letters in the prevalence input, and that the up and down buttons work as expected AE-REG-013 Confirm that the graphic updates after each keystroke in the search and filter by prevalence inputs (instead of after focus leaves the input altogether) | AE-USER-001, AE-REG-007, AE-REG-012, AE-REG-013 | #60 |
|
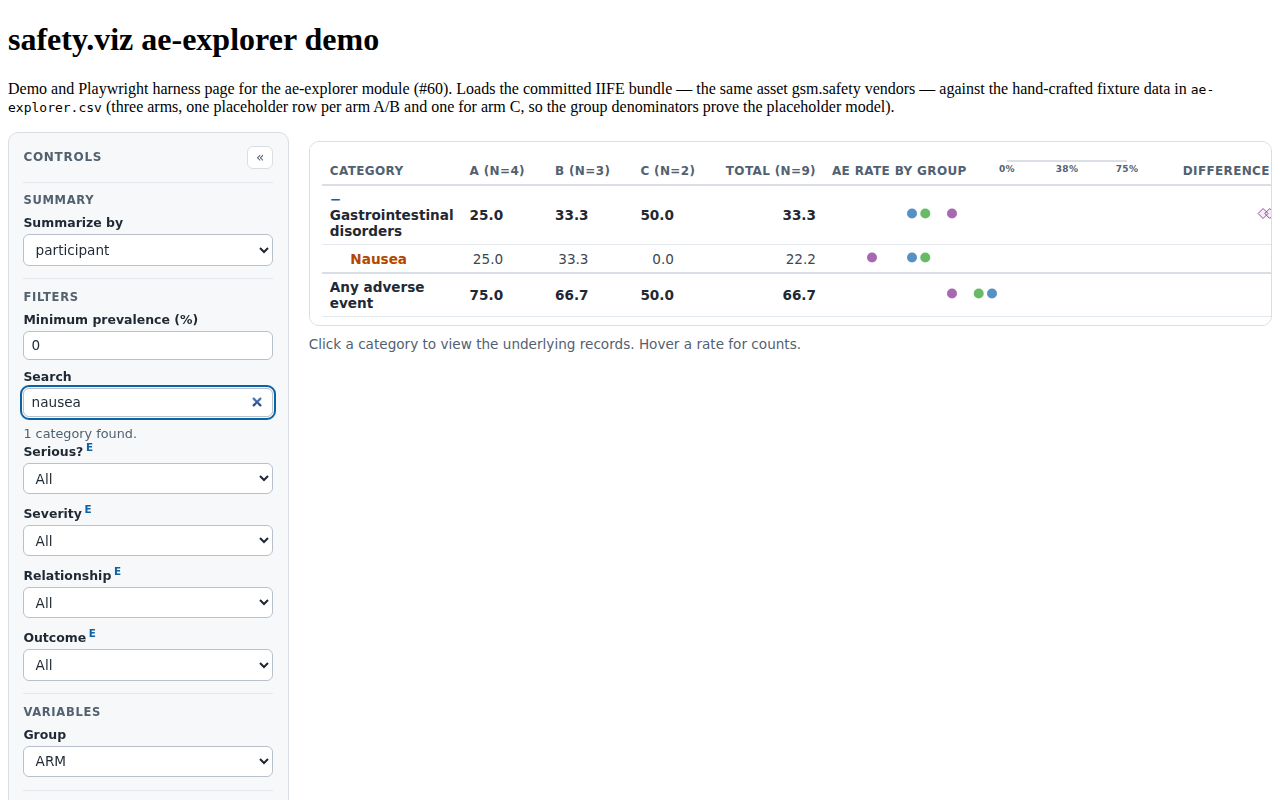
AE-USER-007, AE-REG-003/004 AE-USER-007 The Search box is used to search the category column of the table for terms of interest. Users can type any alphanumeric term into this box. After hitting Enter or clicking outside the box, the Safety Explorer will display only the categories that contain the search term entered. The search terms will also be highlighted in yellow within the category column. Text will also display next to the Search box indicating the number of categories returned with that search term. If there are no results matching the term entered, text will display next to the Search box indicating that no categories were returned with a matching search term. The table display will not change if there are no matches in the search. AE-REG-003 Type a value into the search box and confirm that the table updates to only show the categories that match the search term. Matching terms should be highlighted in bold, regal orange. AE-REG-004 Confirm that the number of matching terms displays to the left of the search box | AE-USER-007, AE-REG-003, AE-REG-004 | #60 |
 |
AE-USER-008, AE-REG-005 AE-USER-008 To reset to the default Explorer view after conducting a search, users can click on the red X button in the alert bar which displays next to the Search box. Alternatively, users can clear the text in the Search box and hit Enter or click outside the box. AE-REG-005 Delete the entered value from the search bar and confirm that table resets | AE-USER-008, AE-REG-005 | #60 |
|
AE-REG-006/018, AE-USER-002/003/018 AE-REG-006 Confirm that filters on events (e.g. Severity) are working as expected by filtering and then clicking on a category to display the underlying data listing to confirm that the data displayed matches the filtering AE-REG-018 Hover over the ‘E’ superscript beside one of the filter labels to display an explanation of an event filter AE-USER-002 This menu is used to filter by whether or not an event is serious in the data set. The default is set to include all events. AE-USER-003 This menu is used to filter by adverse event severity level in the data set. The current severity levels captured are mild, moderate, and severe. The default is to display all severity levels. AE-USER-018 The chart can be configured to have any number of data filters. Each specified filter has a drop-down menu that is used to filter the visit data that is displayed in the chart. | AE-REG-006, AE-REG-018, AE-USER-002, AE-USER-003, AE-USER-018 | #60 |
|
AE-REG-014 AE-REG-014 Confirm that if there are no AEs that match the current filters - the error message thrown says "Error: No AEs found for the current filters. Update the filters to see results." | AE-REG-014 | #60 |
|
AE-USER-021 AE-USER-021 When the summary table has no rows to draw, the Explorer states which kind of empty it is rather than one generic message: no participants in the current selection (naming how many participants the data holds), participants present but no adverse events recorded for them, or adverse events present but excluded by the active event filters. Each state is tagged with its kind so downstream pages can tell them apart. AE-REG-014 Confirm that if there are no AEs that match the current filters - the error message thrown says "Error: No AEs found for the current filters. Update the filters to see results." | AE-USER-021, AE-REG-014 | #136 |
|
AE-USER-022 AE-USER-022 When every participant in the analysis population is an AE-free placeholder row, the Explorer reports that no adverse events have been recorded and gives the participant count, distinguishing an event-free study from a selection that removed the participants; an event-free study reads as information, not as an error. AE-DATA-001 AE Explorers are initialized using JSON data files that match the format created by d3.csv(). The chart requires a data set with one record per adverse event and optionally with placeholder rows for participants who didn't experience any adverse events over the course of the study. The chart uses column names from the ADAM data standard by default, but can be customized to work with any column names as long as the data structure is as expected. | AE-USER-022, AE-DATA-001 | #136 |
|
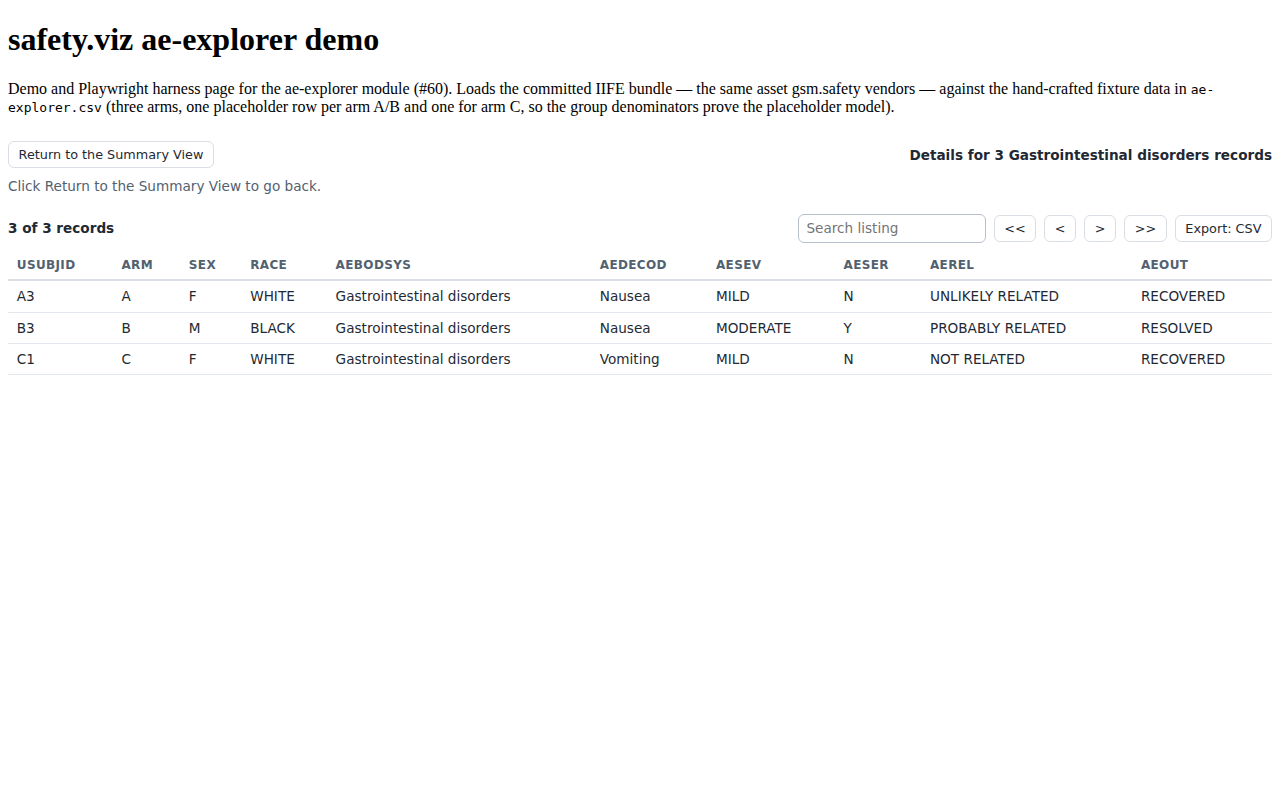
AE-USER-016, AE-REG-019/022 AE-USER-016 Clicking on a category or any of its preferred terms will open the Show Details view. This view displays the raw data for every adverse event under that system organ class and/or preferred term. AE-REG-019 Confirm that you can view a detailed listing of events by clicking on the category name of a given row in the table AE-REG-022 Confirm that there is a sentence in the header stating ‘Details for x category name records’ that displays both the correct ‘x’ value for the number of records in the listing and ‘category name’ | AE-USER-016, AE-REG-019, AE-REG-022 | #60 |
 |
AE-USER-017, AE-REG-020/021 AE-USER-017 The Return to the Summary View button is only visible if users have clicked on a category or preferred term to show the details view. Clicking on this button returns users to the default Safety Explorer view. AE-REG-020 Confirm that the ‘Return to the Summary View’ button brings you back to the original summary view. AE-REG-021 Confirm that the section labeled ‘The listing is filtered as shown:’ displays the filters that were selected in the original summary view | AE-USER-017, AE-REG-020, AE-REG-021 | #60 |
|
AE-USER-012, AE-REG-016 AE-USER-012 The column following the Groups columns shows the rate of an adverse event by group. Each group is represented by a color-coded dot that corresponds to the color of the treatment group. The rate of the event for each group is shown on a scale by percentage. When hovering over a colored dot, the exact percentage appears for the group. AE-REG-016 Hover over a value in ‘AE Rate by group’ to see the percentage of participants affected by group AE-USER-009 By moving a mouse cursor over certain sections of the table, users can display metadata for some variables. Hovering over the ‘E’ superscript beside one of the filter labels will display an explanation of an event filter. Hovering the cursor over a particular row will highlight the row in gray. Hovering over a value in a treatment group will display the number of participants affected out of n. Hovering over a colored data point in the AE Rate by Group column will present the percentage value for the group. Hovering over a diamond in the Difference Between Groups column will perform two actions: | AE-USER-012, AE-REG-016, AE-USER-009 | #60 |
|
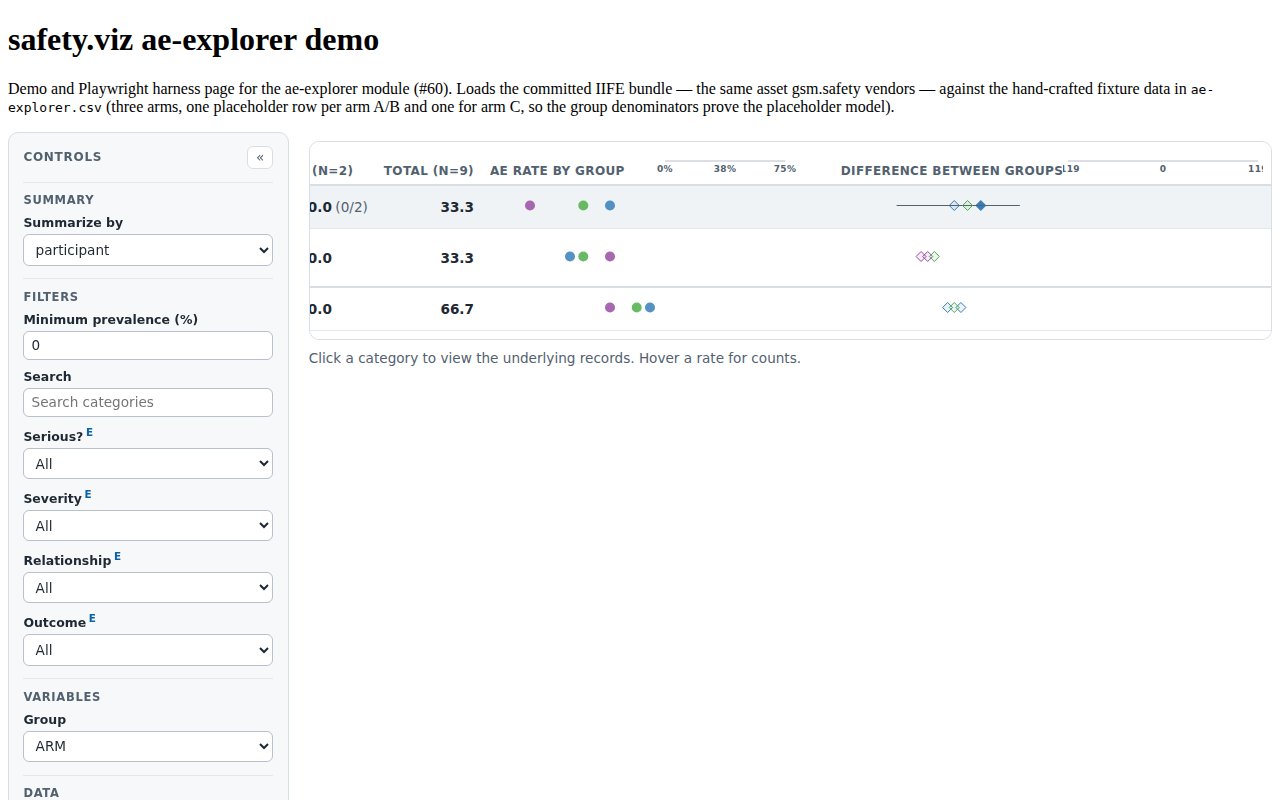
AE-USER-013/011, AE-REG-017 AE-USER-013 The column on the right-hand side of the table shows a graphical representation of the difference between groups in the data set. Group comparisons are represented with a color-coded diamond that corresponds to the colors of the treatment groups being compared. When hovering over a diamond, the ratios and percentages of occurrence for the event appears for the compared groups in addition to the difference between the two groups. AE-USER-011 Display the two treatments compared by percentage and the overall difference between them. AE-REG-017 Hover over a value in ‘Difference Between Groups’ to see two treatments compared and the overall difference between them. This will also highlight the bar containing the value in gray and reveal the count and percentage of both groups under their treatment name AE-USER-009 By moving a mouse cursor over certain sections of the table, users can display metadata for some variables. Hovering over the ‘E’ superscript beside one of the filter labels will display an explanation of an event filter. Hovering the cursor over a particular row will highlight the row in gray. Hovering over a value in a treatment group will display the number of participants affected out of n. Hovering over a colored data point in the AE Rate by Group column will present the percentage value for the group. Hovering over a diamond in the Difference Between Groups column will perform two actions: AE-USER-010 Display the raw data (numerator and denominator) used to calculate the adverse event prevalence percentage for each row in the table for the selected groups. AE-REG-015 Hover over a value in a treatment group to see the number of participants affected out of n | AE-USER-013, AE-USER-011, AE-REG-017, AE-USER-009, AE-USER-010, AE-REG-015 | #60 |
 |
AE-USER-019, AE-REG-037/039 AE-USER-019 The chart can be configured to show or hide any of the treatment groups found in the data. Showing only 1 treatment group will automatically hide the 'Difference Between Groups' column and the 'Total' column. AE-REG-037 Confirm that the following setting only shows treatment group totals and hides the 'Difference Between Groups' column: AE-REG-039 Confirm that the following setting only shows the placebo group and hides the 'total' and 'Difference Between Groups' columns: | AE-USER-019, AE-REG-037, AE-REG-039 | #60 |
|
AE-CFG-004, AE-REG-041/043/044 AE-CFG-004 An object that specifies valid options for the primary variable mappings (id, major, minor and groups). When 2+ options are specified for any given mapping, a control is drawn so that the user can interactively update chart to use any of the options. AE-REG-041 Confirm that adding 2+ values to each component (id, major, minor and groups) of the variableOptions array adds a new control. AE-REG-043 Confirm that the new variableOption controls work before and after filtering, searching, and changing the summarizeBy option. AE-REG-044 Confirm that the value for the default variable appears in the variable control even if it is not specified in config. That is, ARM appears in the groups control with these settings: | AE-CFG-004, AE-REG-041, AE-REG-043, AE-REG-044 | #60 |
|
AE-USER-020, AE-REG-026..030 AE-USER-020 By entering the following settings {"validation": true}, users can download the data as a CSV. The CSV file will contain all of the data if no filters have been utilized. If filters have been used, the CSV file will contain the resulting data. The CSV download will be named using the following convention: major term-minor term-summary variable. The summary variable can either be 'Participant' or 'Event", depending on what the user summarized the data by using the toggle in the menu. AE-CFG-009 adds a link to download the summarized data in a comma-separated format AE-REG-026 Confirm that entering the following settings in the CAT will show the option to download the data file: AE-REG-027 Confirm that when downloading a CSV, the file will save as major term - minor term - participant/event AE-REG-028 Confirm that when downloading a participant CSV, "participant" appears in the title AE-REG-029 Confirm that when downloading an event CSV, "event" appears in the title AE-REG-030 Confirm that filtering the data will appear as filtered in the CSV download | AE-USER-020, AE-CFG-009, AE-REG-026, AE-REG-027, AE-REG-028, AE-REG-029, AE-REG-030 | #60 |
|
Unit evidence (Vitest — tests/unit/ae-explorer/)
22 requirement rows · 62 tests
| Requirement | Source matrix rows | Issue | Tests & evidence |
|---|---|---|---|
AE-CFG-001/002/003, AE-DATA-003 AE-CFG-001 The most straightforward way to customize an AE Explorer is by using a settings object whose properties describe the chart's behavior and appearance. Parameters for the AE-CFG-002 Objects passed to AE-CFG-003 an object that specifies how to map columns from the data file to the chart settings AE-DATA-003 No customization is needed to initialize a chart when the | AE-CFG-001, AE-CFG-002, AE-CFG-003, AE-DATA-003 | #60 |
|
AE-USER-002..005 (default filters) AE-USER-002 This menu is used to filter by whether or not an event is serious in the data set. The default is set to include all events. AE-USER-003 This menu is used to filter by adverse event severity level in the data set. The current severity levels captured are mild, moderate, and severe. The default is to display all severity levels. AE-USER-004 This menu is used to filter by the relatedness categories in the data set. The options included in the chart are not related, unlikely related, probably related, definitely related. The default is to display all relationships. AE-USER-005 This menu is used to filter by the outcome categories in the data set. The options included in the chart are recovered; resolved without sequelae; resolved, recovered; and resolved with sequelae. The default is to display all outcomes. | AE-USER-002, AE-USER-003, AE-USER-004, AE-USER-005 | #60 |
|
AE-USER-018, AE-REG-031 (filter specs) AE-USER-018 The chart can be configured to have any number of data filters. Each specified filter has a drop-down menu that is used to filter the visit data that is displayed in the chart. AE-REG-031 Confirm that the following settings set the serious event filter to ‘Y’ and make it the only filter to be displayed by default: | AE-USER-018, AE-REG-031 | #60 |
|
AE-CFG-007/008, AE-REG-046 AE-CFG-007 an object containing default settings regarding appearance of the tables AE-CFG-008 Object to specify the appearance of the plots embedded in the table rows. AE-REG-046 Confirm in CAT that margins are drawn for the dot plot when plotSettings.margin is specified. Just tweak the following settings object, and confirm that the margin changes as expected: {plotSettings: {margin: {left: 40, right: 40}}} | AE-CFG-007, AE-CFG-008, AE-REG-046 | #60 |
|
AE-REG-033/035 (summary bases) AE-REG-033 Confirm that the following settings summarize the data by participant on default: AE-REG-035 Confirm that the following settings summarize the data by event on default: | AE-REG-033, AE-REG-035 | #60 |
|
AE-USER-019, AE-REG-037 (column plan) AE-USER-019 The chart can be configured to show or hide any of the treatment groups found in the data. Showing only 1 treatment group will automatically hide the 'Difference Between Groups' column and the 'Total' column. AE-REG-037 Confirm that the following setting only shows treatment group totals and hides the 'Difference Between Groups' column: AE-REG-039 Confirm that the following setting only shows the placebo group and hides the 'total' and 'Difference Between Groups' columns: | AE-USER-019, AE-REG-037, AE-REG-039 | #60 |
|
AE-REG-047 (single group, no group columns) AE-REG-047 Confirm that a table configured with the per-group columns off still draws the Total column when only one treatment group is shown: with AE-USER-019 The chart can be configured to show or hide any of the treatment groups found in the data. Showing only 1 treatment group will automatically hide the 'Difference Between Groups' column and the 'Total' column. | AE-REG-047, AE-USER-019 | #136 |
|
AE-CFG-005/006 (groups + colors) AE-CFG-005 An array specifying which levels of settings.variables.groups will appear as columns in the table. AE-CFG-006 an array of colors that control the color of each group in the table | AE-CFG-005, AE-CFG-006 | #60 |
|
AE-DATA-001/003, AE-CFG-003 (guard) AE-DATA-001 AE Explorers are initialized using JSON data files that match the format created by d3.csv(). The chart requires a data set with one record per adverse event and optionally with placeholder rows for participants who didn't experience any adverse events over the course of the study. The chart uses column names from the ADAM data standard by default, but can be customized to work with any column names as long as the data structure is as expected. AE-DATA-003 No customization is needed to initialize a chart when the AE-CFG-003 an object that specifies how to map columns from the data file to the chart settings | AE-DATA-001, AE-DATA-003, AE-CFG-003 | #60 |
|
AE-DATA-001 (placeholder model) AE-DATA-001 AE Explorers are initialized using JSON data files that match the format created by d3.csv(). The chart requires a data set with one record per adverse event and optionally with placeholder rows for participants who didn't experience any adverse events over the course of the study. The chart uses column names from the ADAM data standard by default, but can be customized to work with any column names as long as the data structure is as expected. | AE-DATA-001 | #60 |
|
AE-REG-008/009 (summary bases) AE-REG-008 Confirm that summarizing by 'participant' displays the number of participants who experienced an AE of the corresponding category by group AE-REG-009 Confirm that summarizing by 'event' displays the number of events of the corresponding category by group | AE-REG-008, AE-REG-009 | #60 |
|
AE-REG-006, AE-USER-018 (filter semantics) AE-REG-006 Confirm that filters on events (e.g. Severity) are working as expected by filtering and then clicking on a category to display the underlying data listing to confirm that the data displayed matches the filtering AE-USER-018 The chart can be configured to have any number of data filters. Each specified filter has a drop-down menu that is used to filter the visit data that is displayed in the chart. | AE-REG-006, AE-USER-018 | #60 |
|
AE-USER-013 (Wald interval) AE-USER-013 The column on the right-hand side of the table shows a graphical representation of the difference between groups in the data set. Group comparisons are represented with a color-coded diamond that corresponds to the colors of the treatment groups being compared. When hovering over a diamond, the ratios and percentages of occurrence for the event appears for the compared groups in addition to the difference between the two groups. | AE-USER-013 | #60 |
|
AE-USER-001, AE-REG-007 (prevalence) AE-USER-001 This is a text box feature which is used to filter out all adverse events below the percentage entered. The default is 0%, but the default value can be adjusted according to the user's needs. Users can type any alphanumeric value into this box. Values must be numeric for the filter to work. After hitting Enter or clicking outside the box, the Explorer will hide the data rows where the prevalence for all groups is below the threshold entered. If any group has a prevalence at or above the threshold entered, it will be displayed on screen with all nested categories shown. To return to the default view, the user must either refresh the page or enter 0 into the filter box and again hit Enter or click outside the box. AE-REG-007 Confirm that entering a minimum prevalence will filter the data based on the entered threshold | AE-USER-001, AE-REG-007 | #60 |
|
AE-USER-007 (search matching) AE-USER-007 The Search box is used to search the category column of the table for terms of interest. Users can type any alphanumeric term into this box. After hitting Enter or clicking outside the box, the Safety Explorer will display only the categories that contain the search term entered. The search terms will also be highlighted in yellow within the category column. Text will also display next to the Search box indicating the number of categories returned with that search term. If there are no results matching the term entered, text will display next to the Search box indicating that no categories were returned with a matching search term. The table display will not change if there are no matches in the search. | AE-USER-007 | #60 |
|
AE-USER-012 (zero-shell cells) AE-USER-012 The column following the Groups columns shows the rate of an adverse event by group. Each group is represented by a color-coded dot that corresponds to the color of the treatment group. The rate of the event for each group is shown on a scale by percentage. When hovering over a colored dot, the exact percentage appears for the group. | AE-USER-012 | #60 |
|
AE-USER-021/022 (empty states) AE-USER-021 When the summary table has no rows to draw, the Explorer states which kind of empty it is rather than one generic message: no participants in the current selection (naming how many participants the data holds), participants present but no adverse events recorded for them, or adverse events present but excluded by the active event filters. Each state is tagged with its kind so downstream pages can tell them apart. AE-USER-022 When every participant in the analysis population is an AE-free placeholder row, the Explorer reports that no adverse events have been recorded and gives the participant count, distinguishing an event-free study from a selection that removed the participants; an event-free study reads as information, not as an error. AE-REG-014 Confirm that if there are no AEs that match the current filters - the error message thrown says "Error: No AEs found for the current filters. Update the filters to see results." | AE-USER-021, AE-USER-022, AE-REG-014 | #136 |
|
AE-USER-012/013, AE-REG-046 (scales) AE-USER-012 The column following the Groups columns shows the rate of an adverse event by group. Each group is represented by a color-coded dot that corresponds to the color of the treatment group. The rate of the event for each group is shown on a scale by percentage. When hovering over a colored dot, the exact percentage appears for the group. AE-USER-013 The column on the right-hand side of the table shows a graphical representation of the difference between groups in the data set. Group comparisons are represented with a color-coded diamond that corresponds to the colors of the treatment groups being compared. When hovering over a diamond, the ratios and percentages of occurrence for the event appears for the compared groups in addition to the difference between the two groups. AE-REG-046 Confirm in CAT that margins are drawn for the dot plot when plotSettings.margin is specified. Just tweak the following settings object, and confirm that the margin changes as expected: {plotSettings: {margin: {left: 40, right: 40}}} | AE-USER-012, AE-USER-013, AE-REG-046 | #60 |
|
AE-CFG-006, AE-REG-040 (palette) AE-CFG-006 an array of colors that control the color of each group in the table AE-REG-040 Confirm that when grouping by RACE, yellow is no longer the color that appears | AE-CFG-006, AE-REG-040 | #60 |
|
AE-USER-010/011, AE-REG-015/016/017 (hover text) AE-USER-010 Display the raw data (numerator and denominator) used to calculate the adverse event prevalence percentage for each row in the table for the selected groups. AE-USER-011 Display the two treatments compared by percentage and the overall difference between them. AE-REG-015 Hover over a value in a treatment group to see the number of participants affected out of n AE-REG-016 Hover over a value in ‘AE Rate by group’ to see the percentage of participants affected by group AE-REG-017 Hover over a value in ‘Difference Between Groups’ to see two treatments compared and the overall difference between them. This will also highlight the bar containing the value in gray and reveal the count and percentage of both groups under their treatment name | AE-USER-010, AE-USER-011, AE-REG-015, AE-REG-016, AE-REG-017 | #60 |
|
AE-REG-027..030, AE-USER-020 (CSV) AE-REG-027 Confirm that when downloading a CSV, the file will save as major term - minor term - participant/event AE-REG-028 Confirm that when downloading a participant CSV, "participant" appears in the title AE-REG-029 Confirm that when downloading an event CSV, "event" appears in the title AE-REG-030 Confirm that filtering the data will appear as filtered in the CSV download AE-USER-020 By entering the following settings {"validation": true}, users can download the data as a CSV. The CSV file will contain all of the data if no filters have been utilized. If filters have been used, the CSV file will contain the resulting data. The CSV download will be named using the following convention: major term-minor term-summary variable. The summary variable can either be 'Participant' or 'Event", depending on what the user summarized the data by using the toggle in the menu. | AE-REG-027, AE-REG-028, AE-REG-029, AE-REG-030, AE-USER-020 | #60 |
|
AE-FILT-001..004 (shared filter contract) AE-FILT-001 A filter spec accepts AE-FILT-002 AE-FILT-003 AE-FILT-004 | AE-FILT-001, AE-FILT-002, AE-FILT-003, AE-FILT-004 | #166 |
|
Visual evidence
Every screenshot below is a committed baseline: the same PNG is the visual-regression baseline the browser suite asserts against and the evidence artifact shown here. Click any capture for the full-resolution image.
AE DATA 003 default table AE REG 003 search highlight AE REG 017 diff hover AE USER 016 details view
Source-matrix routing status (77 rows)
- Covered (66 rows): AE-USER-001..022 (see modernization notes below for AE-USER-009 and AE-USER-020), AE-REG-001..009, AE-REG-012..022, AE-REG-024*, AE-REG-026..031, AE-REG-033/035/037/039/040/041/042*/043/044, AE-REG-046, AE-REG-047, AE-DATA-001/003, AE-CFG-001..009, and AE-API-001 are evidenced by the tables above. Every source row is still typed
plannedin the matrix; re-typing covered rows (planned→unit/browser) with links back to these tests is a follow-up inrequirements/aeexplorer.md. - AE-REG-024 (details column labels): the details setting accepts
{ value_col, label }specs with and without labels via the shared field-list normalization (configure.test.js); the labeled-listing rendering itself is the shared listing module, evidenced under the histogram (SH-LIST-001..004). - AE-REG-042 (multiple variableOptions controls): the control builder is exercised for the group mapping in the browser; multiple simultaneous controls share the same code path (one select per mapping with 2+ options).
- Descoped — legacy environment (4 rows): AE-REG-010 (viz-library gallery), AE-REG-011 (Bootstrap-CSS toggle), AE-REG-025 (Webcharts detail table — the behavior it asks for: sort, search, pagination, and export in the details listing, is covered by the shared listing module without the Webcharts dependency), and AE-DATA-004 (viz-library query example page). These test the RhoInc hosting environment, not the renderer.
- Descoped — superseded control (1 row): AE-REG-023 ("details listing appears as normal" ahead of a Webcharts comparison) is subsumed by the details-view browser tests above.
- Modernization notes: filters render as single-select dropdowns with an All option in the shared sidebar chrome (the original used multi-selects); the AE-USER-009 hover aggregate row is covered by its child rows (AE-USER-010/011, AE-REG-015..018); the AE-USER-020 CSV downloads via a Data-section button rather than a bare link, with the original's major-minor-basis file naming; and search/prevalence inputs update per keystroke (AE-REG-013) rather than on blur.
View-selector rollout (VIEW-3, #76)
One primary display — the SOC→PT incidence table. "Summarize by" is a statistic-basis picker that reshapes the same table, and the category drill-down is a master-detail listing restored via a "Return to the Summary View" button, not a mutually-exclusive view switch. Ruled single-view in the shared view-selector rollout (#76) — no view control is added; see view-selector-inventory.md.
Participant-profile rail (obot.roadmap#75 D9, PPRF-AE-005)
ae-explorer now mounts the railed participant profile. The deferral recorded here under PPRF-COV-001 — that ae-explorer ingests adverse-event records rather than the measure-per-visit long-lab contract the profile consumed — ended when v2 gave the profile an adverse-event domain of its own (obot.roadmap#75 decision D9).
There are no laboratory records here, so the profile renders as the AE story alone: header, summary block and timeline, with no spaghetti card and no measure table. Adoption rows are PPRF-AE-005 in the participant-profile matrix; unit evidence lives in tests/unit/participant-profile/ae-adoption.test.js.
Reproducing this report
The evidence set is regenerated from a full test run and committed with the code it qualifies; CI fails when they drift. To verify or rebuild it:
npm ci
npm run evidence:check   # compare a fresh run against the committed evidence
npm run evidence         # regenerate docs/evidence/ae-explorer/evidence.json
Screenshot baselines are canonical to the Linux CI runner; the repository's Update evidence baselines workflow is the authoritative way to refresh them. See CONTRIBUTING.md for the traceability convention.