Adverse Event Timelines: test evidence Adverse Event Timelines is exploratoryQualifiedValidated for regulated use. Nothing in safety.viz is, yet.ExploratoryThis chartTested and documented. Confirm every result.ExperimentalTested and documented, but what it shows or how it behaves may still change.PrototypeAn early look, on the docs site only. Not in the demo app.What each rung means
Requirement-traced qualification evidence for the safety.viz ae-timelines module.
Requirement matrix ↗ — the reviewed source specification these tests trace to.
- Scope
- 23 coverage rows41 distinct requirement IDs
- Tests executed
- 1194 automated checks185 browser · 1009 unit
- Result
- pass all passing9 evidence screenshots
- Generated
- 2026-10-10 18:05 UTC
- Environment
linux 6.17.0-1022-azure · node v22.23.3 · playwright 1.61.1 · chromium 149.0.7827.55- Test run
- Actions run #38072575214
Scope & approach
Traceability for the ae-timelines module (a Chart.js reimplementation of RhoInc/ae-timelines matching the original renderer's behavior, under #26), per the convention in CONTRIBUTING.md. Requirement IDs are the AET-* rows of the reviewed 43-row matrix at requirements/ae-timelines.md; rows are routed to Vitest (transforms) or Playwright (interaction/visual behavior) by judgment, since every source row is still typed planned.
Each table row traces one requirement to the automated test(s) that evidence it: the Requirement column shows the reviewed requirement text and its ID, the source-matrix rows link back to the specification, the issue column links the implementing work, and the result column shows the recorded outcome of every matching test from the committed evidence.json with its captured screenshots. Browser evidence is captured at fixed conditions (1280×800, device scale 1) on the canonical Linux CI environment.
Browser evidence (Playwright — tests/e2e/ae-timelines.spec.js)
11 requirement rows · 11 tests
| Requirement | Source matrix rows | Issue | Tests & evidence |
|---|---|---|---|
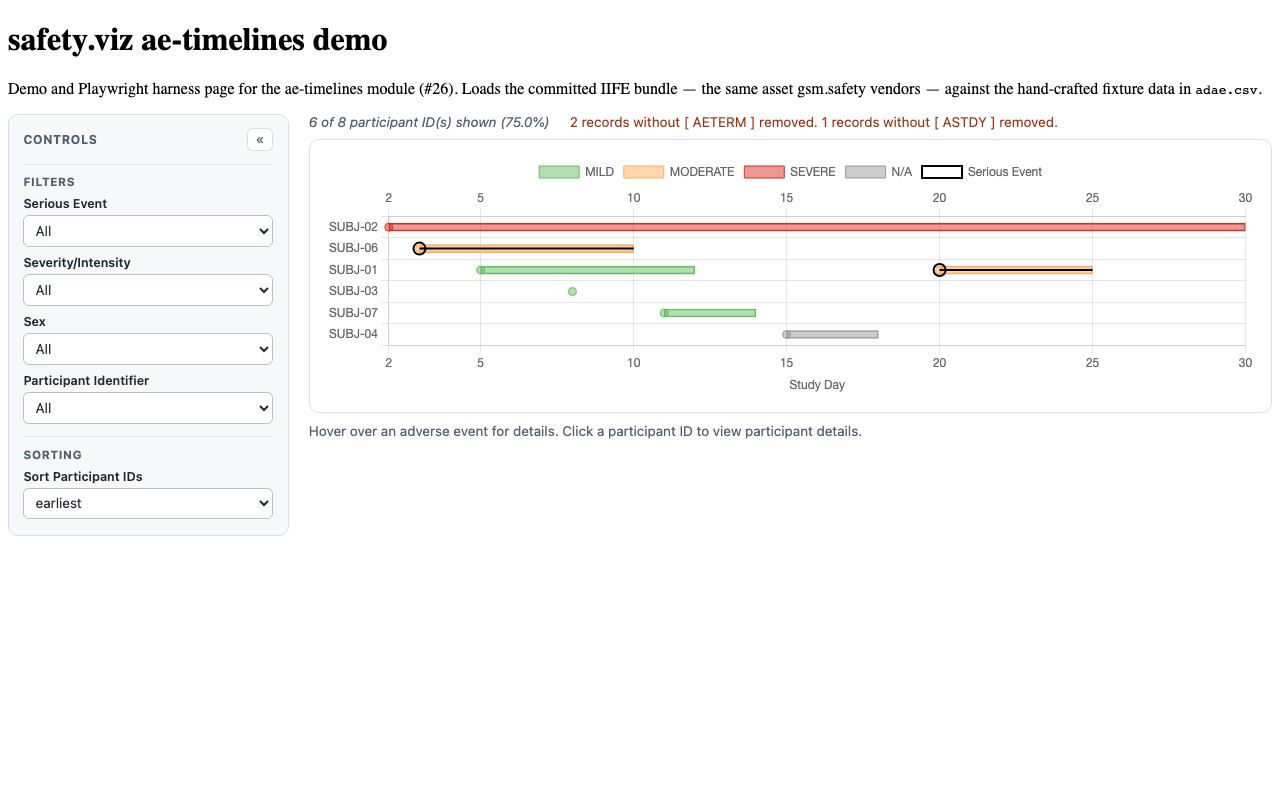
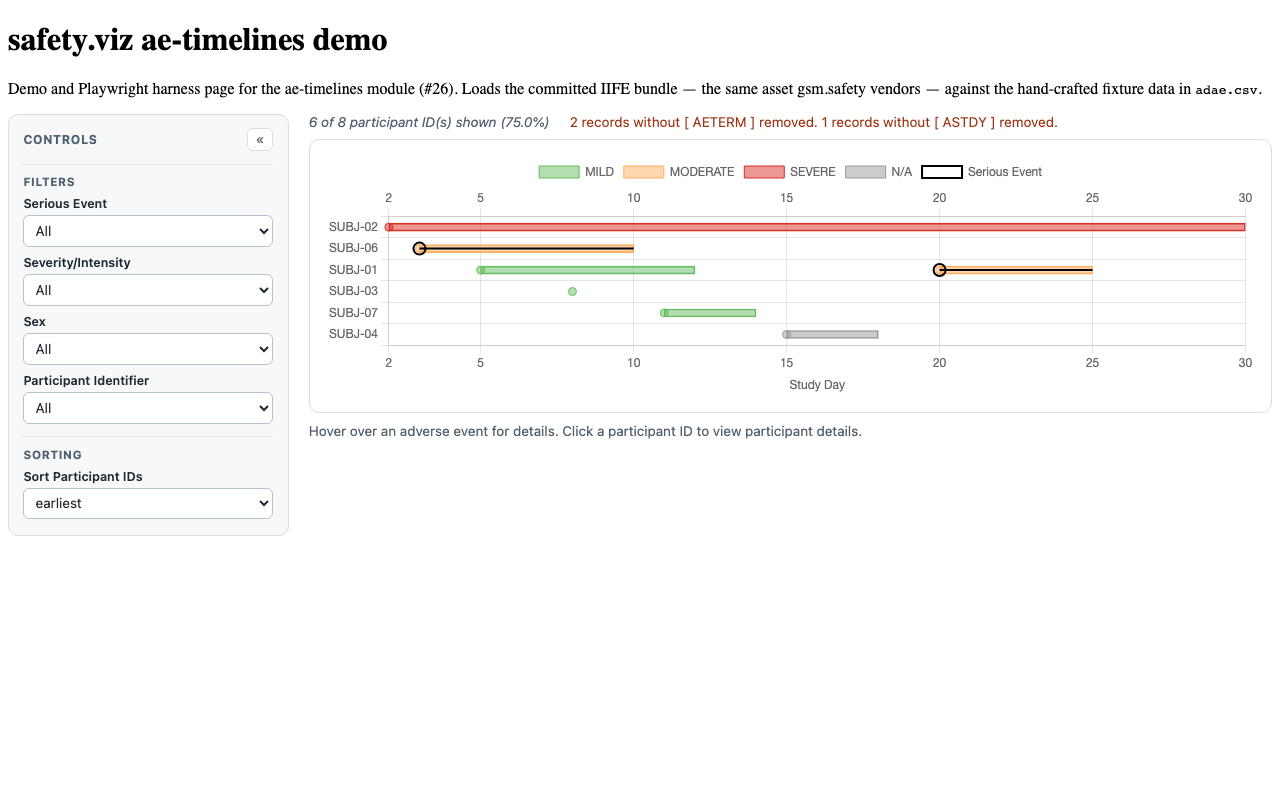
AET-FUNC-002/003/004/005 AET-FUNC-002 This drop-down menu is used to filter serious events in the data set. The default is set to include all events, but can be manipulated to include events that are only marked as serious or events that are only marked as non-serious. An open-ended black circle marks serious events so they can be viewed in the timeline at a glance. AET-FUNC-003 This drop-down menu displays a listing of the adverse event severity levels in the data set. The default is to display all severity levels. The current severity levels captured are mild, moderate, and severe, which are color coded and displayed in a legend above the timeline. AET-FUNC-004 This drop-down menu displays a list of all of the subject identifiers included in the data set. Each participant is assigned a unique identifier that is associated with their adverse event data. Filtering to view a particular subject ID will only show data for that subject. The default for this filter is set to show data for all subjects. AET-FUNC-005 The chart can be configured to have any number of data filters. Each specified filter has a drop-down menu that is used to filter the visit data that is displayed in the chart. | AET-FUNC-002, AET-FUNC-003, AET-FUNC-004, AET-FUNC-005 | #26 |
 |
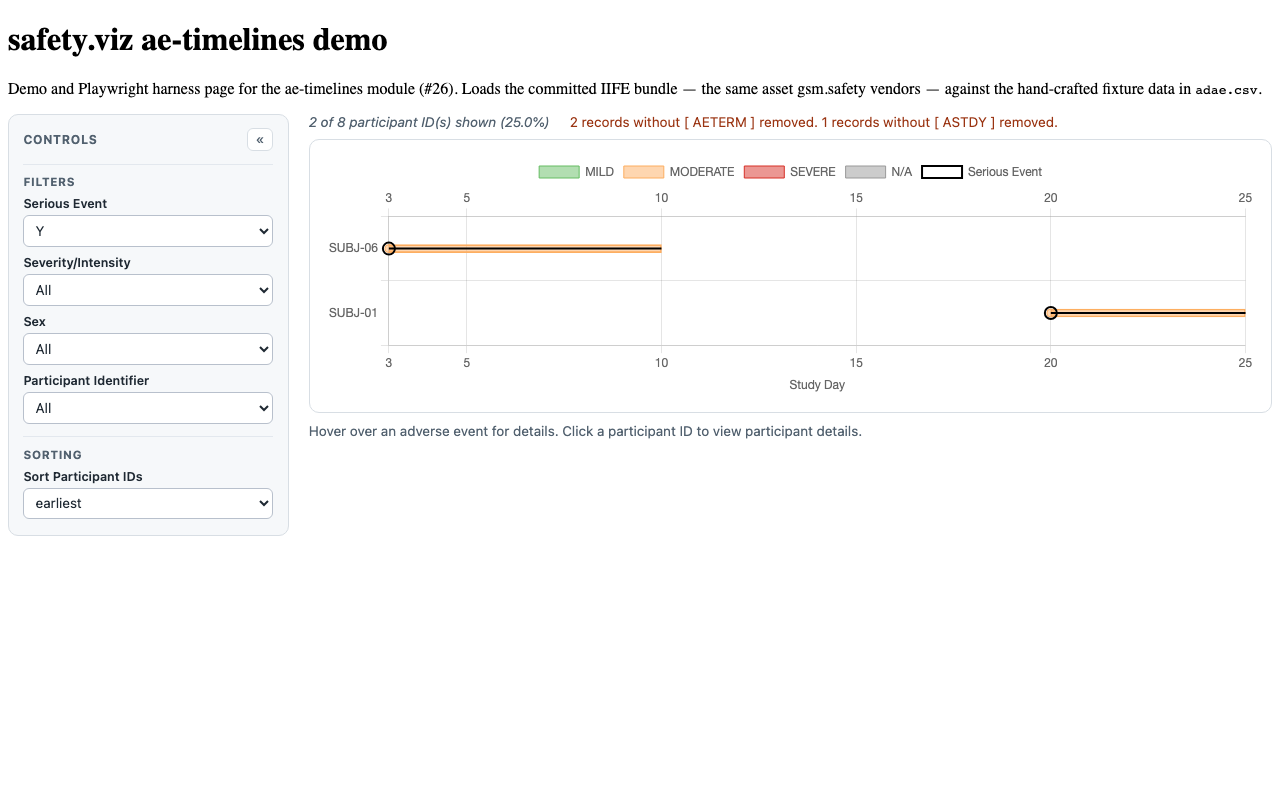
AET-FUNC-007 AET-FUNC-007 Displayed in the top right corner of the page, this statement provides the total number of participants in the data set in integers as well as the percentage of participants shown to one decimal place. In the default view, all participant data is included in the chart, or 100%, unless the project team requests otherwise. When filters are used, the data shown in the histogram is manipulated and the number of participant records shown at the top of the page may increase or decrease, depending on the variable selected. AET-REG-002 Confirm that selecting a filter changes the ratio and percentage of affected participants AET-REG-013 Confirm that the population annotation (n of N participants...) is italicized. | AET-FUNC-007, AET-REG-002, AET-REG-013 | #26 |
 |
AET-DATA-001 (cleaning note) AET-DATA-001 AE Timelines are initialized using JSON data files that match the format created by d3.csv(). The chart requires a data set with one record per adverse event with placeholder rows added for participants who didn't experience any adverse events over the course of the study. The chart uses column names from the AdAM data standard by default, but can be customized to work with any column names as long as the data structure is as expected. | AET-DATA-001 | #26 |
|
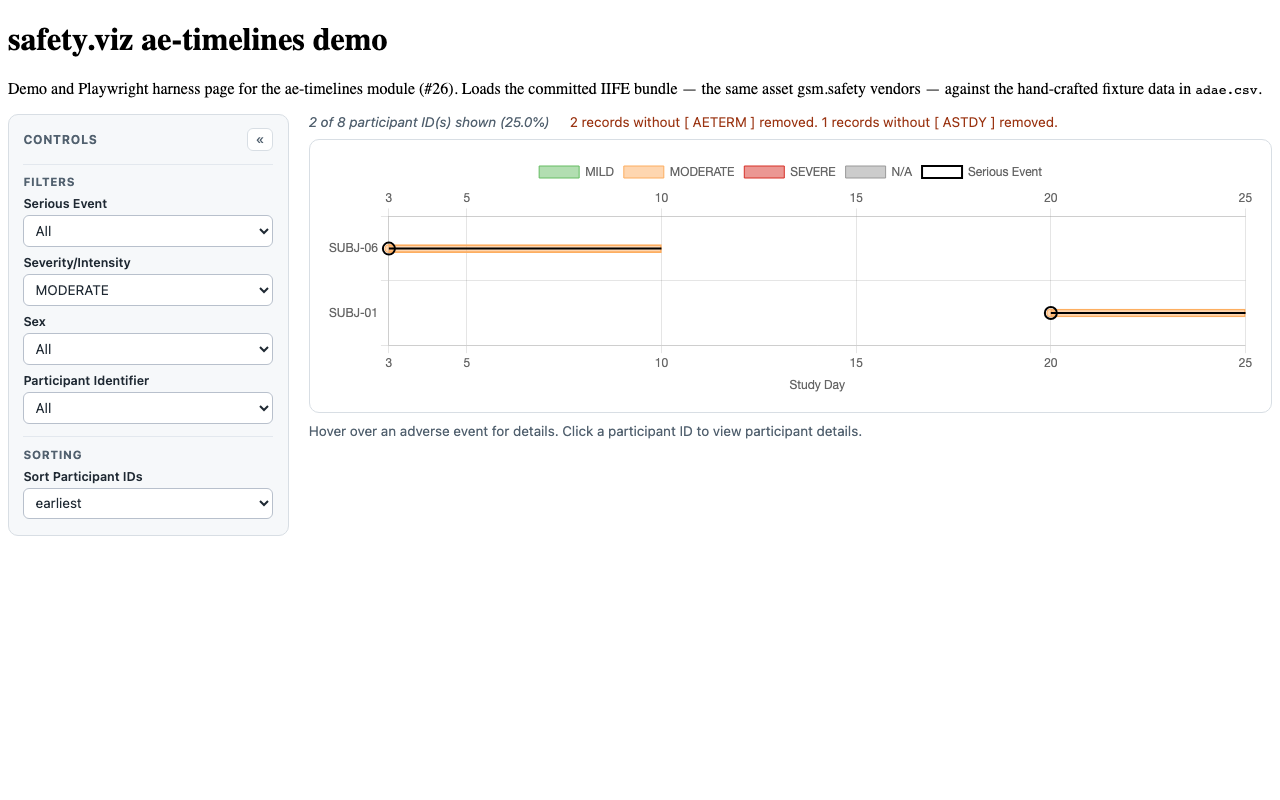
AET-REG-001 AET-REG-001 Confirm that selecting a filter manipulates the visible events | AET-REG-001 | #26 |
 |
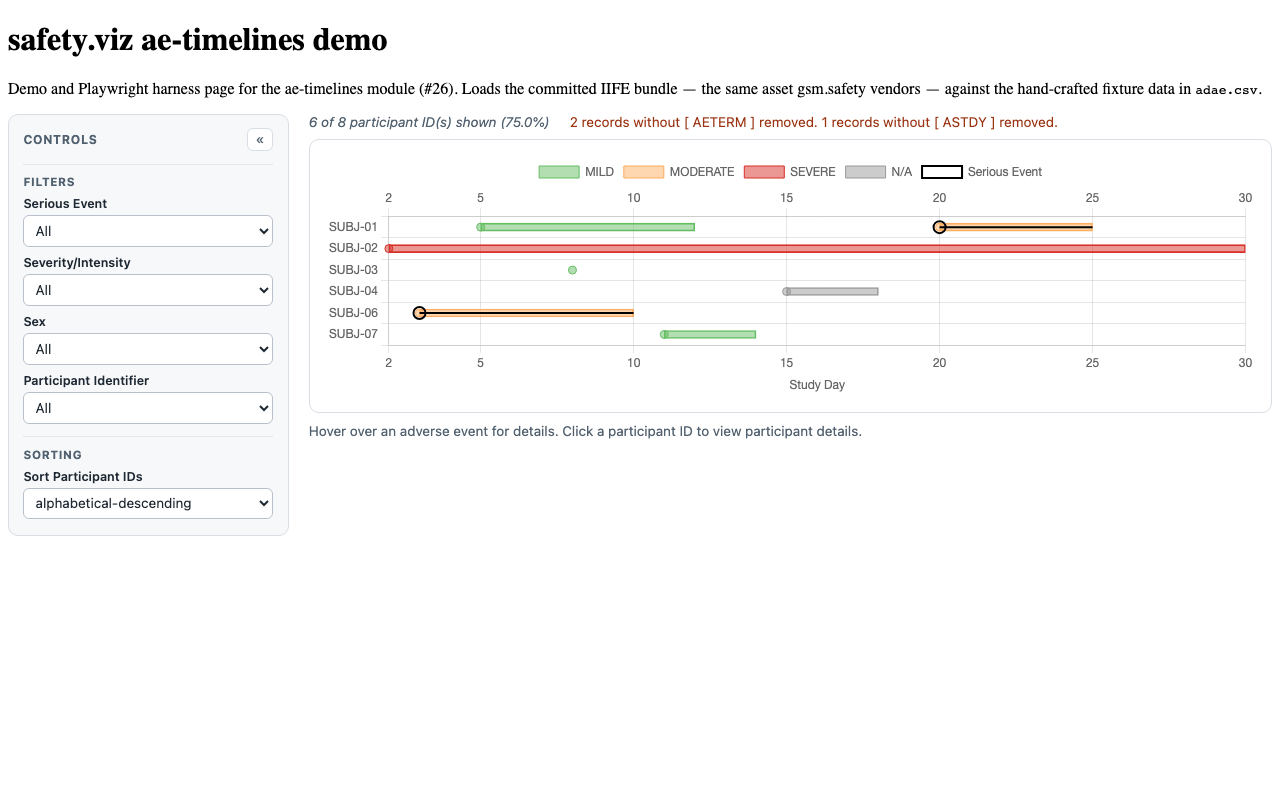
AET-FUNC-006 AET-FUNC-006 This drop-down menu can sort the subject IDs included in the timeline data set. This option can sort the data by the participants with the earliest occurring adverse event(s) or the participants that appear first alphabetically in descending order. This option defaults to the earliest occurring events and their related participants. AET-REG-003 Confirm that sorting subject IDs changes the order of the results as expected | AET-FUNC-006, AET-REG-003 | #26 |
 |
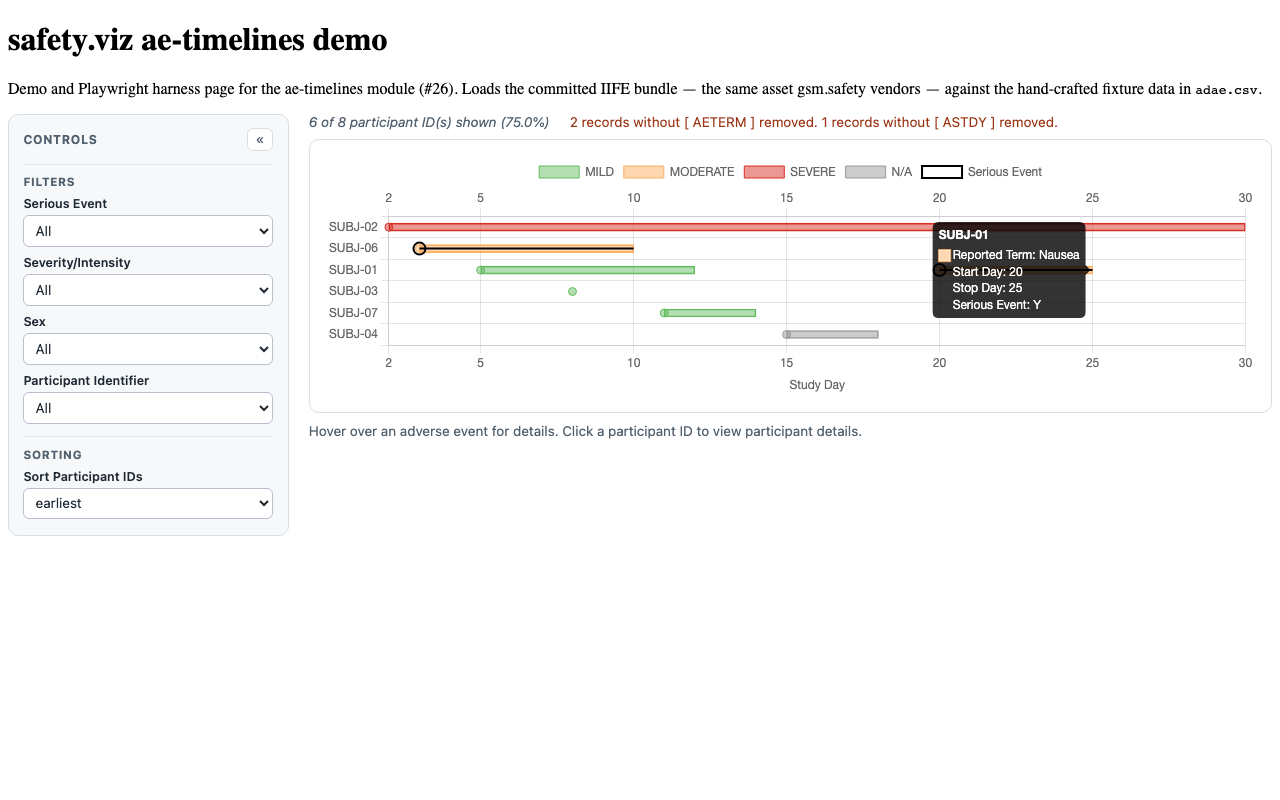
AET-FUNC-008 AET-FUNC-008 By moving a mouse cursor over a bar in the chart, users can display metadata for some variables. Hovering the cursor over a particular bar will display the reported term of an event, the day the event started, and the day the event stopped. More information about the event can be accessed by clicking on the Subject ID. AET-REG-004 Confirm that hovering over event lines shows adverse event information (reported term, start day, stop day) for a participant | AET-FUNC-008, AET-REG-004 | #26 |
 |
AET-REG-005/006 AET-REG-005 Confirm that the date of an adverse event doesn't end in a circle AET-REG-006 Confirm that a serious AE is notated by a different mark than a normal AE | AET-REG-005, AET-REG-006 | #26 |
 |
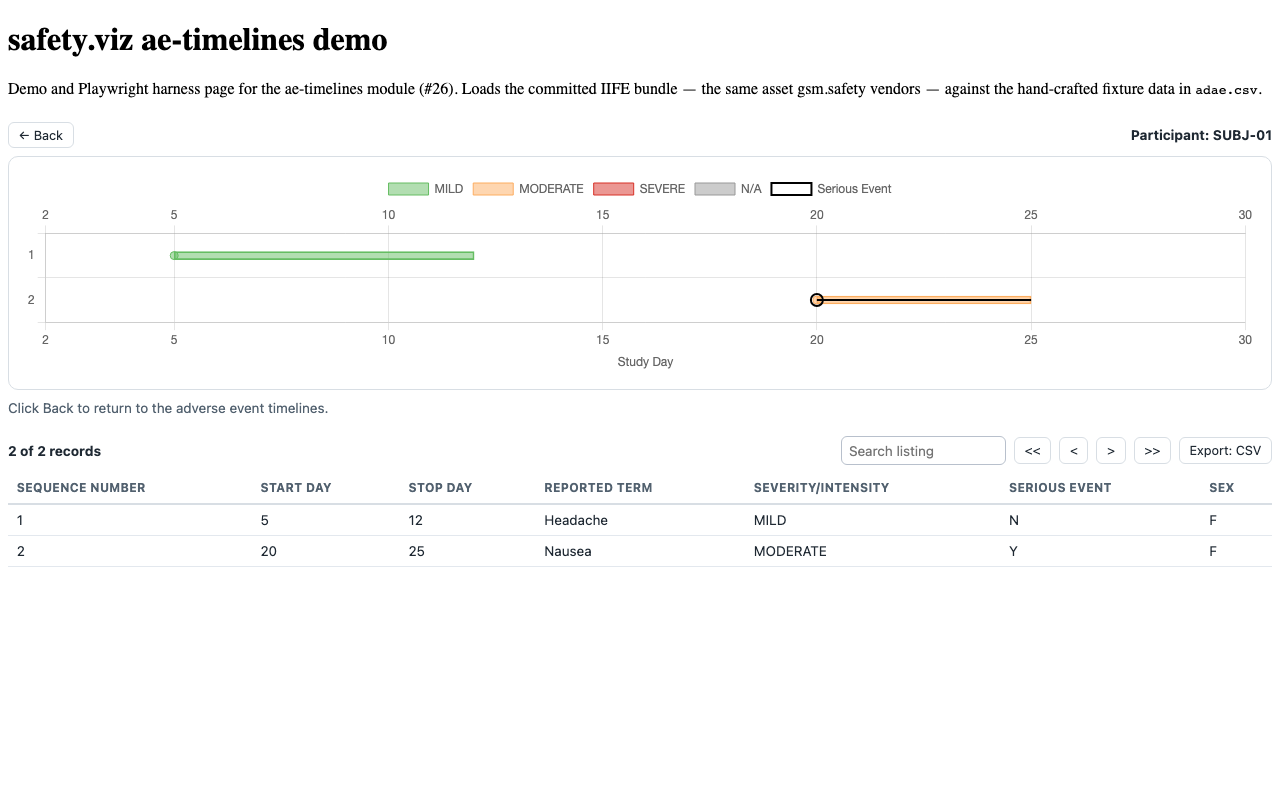
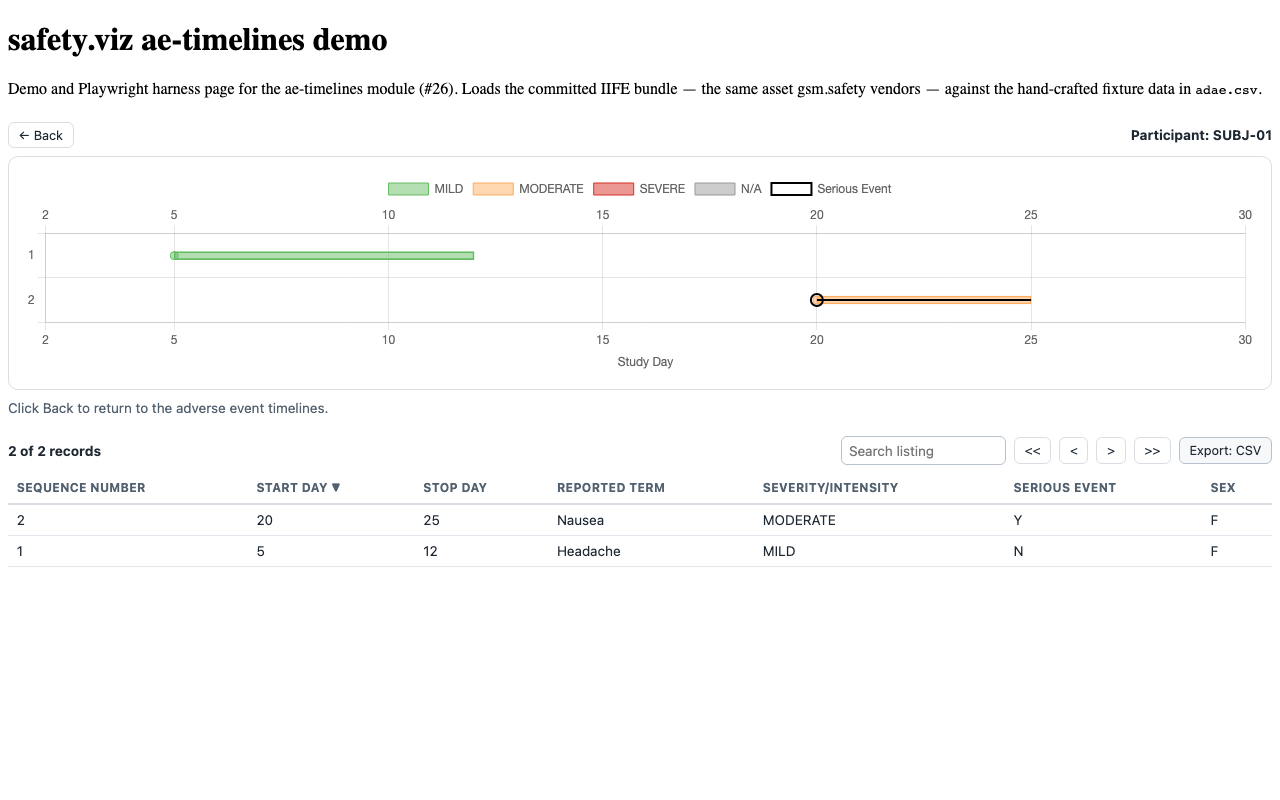
AET-FUNC-009 AET-FUNC-009 Clicking on the Subject ID seen to the left of the bar will load a more detailed view. This view displays the raw data for a participant's adverse events. This view shows the sequence number for the event, the day the event started, the day the event stopped, the reported term, the event's severity/intensity, and if the event is classified as serious or not. AET-REG-008 Confirm that clicking on a participant ID takes the user to the detail view AET-API-003 The custom | AET-FUNC-009, AET-REG-008, AET-API-003 | #26 |
 |
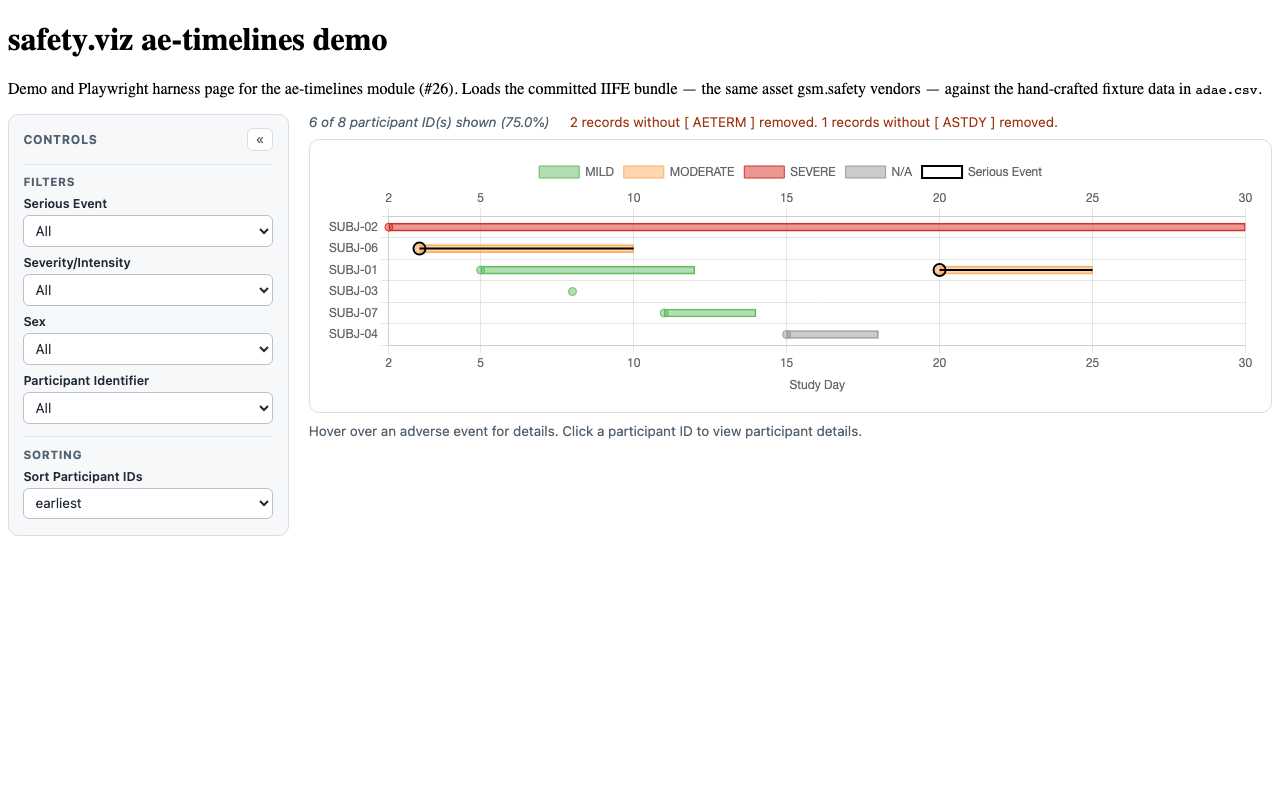
AET-FUNC-010 AET-FUNC-010 The Back button is only visible if users have clicked on the detailed view for a given participant. Clicking on this button returns users to the default AE Timelines view. AET-REG-012 Confirm that clicking the Back button takes the user to the timelines chart screen AET-API-003 The custom | AET-FUNC-010, AET-REG-012, AET-API-003 | #26 |
 |
AET-REG-009/010/011 AET-REG-009 Confirm that Search works to filter the data displayed in the listing AET-REG-010 Confirm that Sort works in the listing by clicking on column headers AET-REG-011 Confirm that you can export the displayed data to a csv via via the Export: CSV button | AET-REG-009, AET-REG-010, AET-REG-011 | #26 |
 |
AET-API-001 (module scheme) AET-API-001 a factory to create a custom Webcharts chart object | — (see legacy-API note) | #26 |
|
Unit evidence (Vitest — tests/unit/ae-timelines/)
12 requirement rows · 49 tests
| Requirement | Source matrix rows | Issue | Tests & evidence |
|---|---|---|---|
AET-DATA-001/004 (ADaM defaults) AET-DATA-001 AE Timelines are initialized using JSON data files that match the format created by d3.csv(). The chart requires a data set with one record per adverse event with placeholder rows added for participants who didn't experience any adverse events over the course of the study. The chart uses column names from the AdAM data standard by default, but can be customized to work with any column names as long as the data structure is as expected. AET-DATA-004 No customization is needed to initialize a chart when the | AET-DATA-001, AET-DATA-004 | #26 |
|
AET-CFG-005..012 (settings sync) AET-CFG-005 an object that defines the event color stratification variable, its label, its levels, and their corresponding colors AET-CFG-006 color stratification variable name, usually set to event severity AET-CFG-007 an object that defines what events to highlight and how to highlight them AET-CFG-008 value of AET-CFG-009 detail of highlighted event variable name AET-CFG-010 an object of attributes that define highlighted marks AET-CFG-011 an array of filter variables and associated metadata AET-CFG-012 an array of detail listing variables and associated metadata | AET-CFG-005..012 | #26 |
|
AET-FUNC-002/003/004/005 (default filters) AET-FUNC-002 This drop-down menu is used to filter serious events in the data set. The default is set to include all events, but can be manipulated to include events that are only marked as serious or events that are only marked as non-serious. An open-ended black circle marks serious events so they can be viewed in the timeline at a glance. AET-FUNC-003 This drop-down menu displays a listing of the adverse event severity levels in the data set. The default is to display all severity levels. The current severity levels captured are mild, moderate, and severe, which are color coded and displayed in a legend above the timeline. AET-FUNC-004 This drop-down menu displays a list of all of the subject identifiers included in the data set. Each participant is assigned a unique identifier that is associated with their adverse event data. Filtering to view a particular subject ID will only show data for that subject. The default for this filter is set to show data for all subjects. AET-FUNC-005 The chart can be configured to have any number of data filters. Each specified filter has a drop-down menu that is used to filter the visit data that is displayed in the chart. | AET-FUNC-002..005 | #26 |
|
AET-CFG-004, AET-DATA-003/006 (validation) AET-CFG-004 verbatim adverse event text variable name AET-DATA-003 **_*_** a coloring variable of some sort is required but it does not have to be AESEV AET-DATA-006 **_*_** a coloring variable of some sort is required but it does not have to be AESEV | AET-CFG-004, AET-DATA-003, AET-DATA-006 | #26 |
|
AET-DATA-001, AET-FUNC-007 (cleaning + population) AET-DATA-001 AE Timelines are initialized using JSON data files that match the format created by d3.csv(). The chart requires a data set with one record per adverse event with placeholder rows added for participants who didn't experience any adverse events over the course of the study. The chart uses column names from the AdAM data standard by default, but can be customized to work with any column names as long as the data structure is as expected. AET-FUNC-007 Displayed in the top right corner of the page, this statement provides the total number of participants in the data set in integers as well as the percentage of participants shown to one decimal place. In the default view, all participant data is included in the chart, or 100%, unless the project team requests otherwise. When filters are used, the data shown in the histogram is manipulated and the number of participant records shown at the top of the page may increase or decrease, depending on the variable selected. | AET-DATA-001, AET-FUNC-007 | #26 |
|
AET-FUNC-003 (color domain + N/A) AET-FUNC-003 This drop-down menu displays a listing of the adverse event severity levels in the data set. The default is to display all severity levels. The current severity levels captured are mild, moderate, and severe, which are color coded and displayed in a legend above the timeline. | AET-FUNC-003 | #26 |
|
AET-FUNC-006 (sort orders) AET-FUNC-006 This drop-down menu can sort the subject IDs included in the timeline data set. This option can sort the data by the participants with the earliest occurring adverse event(s) or the participants that appear first alphabetically in descending order. This option defaults to the earliest occurring events and their related participants. AET-REG-003 Confirm that sorting subject IDs changes the order of the results as expected | AET-FUNC-006, AET-REG-003 | #26 |
|
AET-FUNC-002, AET-CFG-008 (serious flag) AET-FUNC-002 This drop-down menu is used to filter serious events in the data set. The default is set to include all events, but can be manipulated to include events that are only marked as serious or events that are only marked as non-serious. An open-ended black circle marks serious events so they can be viewed in the timeline at a glance. AET-CFG-008 value of | AET-FUNC-002, AET-CFG-008 | #26 |
|
AET-FUNC-008 (study-day domain + axes) AET-FUNC-008 By moving a mouse cursor over a bar in the chart, users can display metadata for some variables. Hovering the cursor over a particular bar will display the reported term of an event, the day the event started, and the day the event stopped. More information about the event can be accessed by clicking on the Subject ID. AET-REG-001 Confirm that selecting a filter manipulates the visible events | AET-FUNC-008, AET-REG-001 | #26 |
|
AET-FUNC-008, AET-CFG-009 (tooltips + datasets) AET-FUNC-008 By moving a mouse cursor over a bar in the chart, users can display metadata for some variables. Hovering the cursor over a particular bar will display the reported term of an event, the day the event started, and the day the event stopped. More information about the event can be accessed by clicking on the Subject ID. AET-REG-004 Confirm that hovering over event lines shows adverse event information (reported term, start day, stop day) for a participant AET-CFG-009 detail of highlighted event variable name | AET-FUNC-008, AET-REG-004, AET-CFG-009 | #26 |
|
AET-FILT-001..004 (shared filter contract) AET-FILT-001 A filter spec accepts AET-FILT-002 AET-FILT-003 AET-FILT-004 | AET-FILT-001, AET-FILT-002, AET-FILT-003, AET-FILT-004 | #166 |
|
AET-CTRL-001 AET-CTRL-001 A reset control at the foot of the control panel returns the chart to its opening view: every filter and the participant sort order return to their configured defaults, any open participant detail view closes, the record listing empties and pages back to the first page, and the timelines are redrawn for the whole cohort. | AET-CTRL-001 | #136 |
|
Visual evidence
Every screenshot below is a committed baseline: the same PNG is the visual-regression baseline the browser suite asserts against and the evidence artifact shown here. Click any capture for the full-resolution image.
AET FUNC 002 baseline timelines AET FUNC 006 alphabetical sort AET FUNC 007 participant annotation AET FUNC 008 hover tooltip AET FUNC 009 participant detail AET FUNC 010 back to timelines AET REG 001 severity filter AET REG 006 serious markers AET REG 009 detail listing
Source-matrix routing status (43 rows)
- Covered (35 rows): AET-FUNC-002..010, AET-REG-001..006 and AET-REG-008..013, AET-DATA-001/003/004/006, AET-CFG-004..012, and AET-API-003 are evidenced by the tables above. Every source row is still typed
plannedin the matrix; re-typing covered rows (planned→unit/browser) with links back to these tests is a safety.agent follow-up. - AET-REG-007 + AET-DATA-005 (2 rows, descoped): the viz-library "customized chart with queries" example — a study-specific configuration of the color/highlight settings, flagged
needs-jeremy-reviewin the matrix. The remapping mechanics it relies on are covered by the AET-CFG-005..010 tests; the example itself is not reproduced as a demo. - AET-CFG-001 + AET-CFG-002 (2 rows, descoped): legacy Webcharts settings-system rows (
needs-jeremy-review). The reimplementation ships flat safety.viz settings merged bysyncSettings; the behavior-level equivalents are covered by the AET-CFG-004..012 tests. - AET-CFG-013 + AET-CFG-014 (2 rows, descoped): the
custom_markssetting exposes raw Webcharts marktype/persemantics (needs-jeremy-review); the Chart.js reimplementation does not carry a pass-through mark API. - AET-REQ-003 (1 row, descoped): wiki link text pointing at the wrong project's wiki; the matrix AI review recommends dropping it.
- AET-API-001 (1 row, legacy API): see the legacy-API note below.
Legacy-API note: source-matrix AET-API-001 ("a factory to create a custom Webcharts chart object") describes the legacy Webcharts API, which the designs intentionally do not preserve. The module ships the histogram-proven lifecycle API instead — AET-API-001 in the module scheme — and the original's participantsSelected wrapper event becomes a DOM CustomEvent on the container element with the same data payload (AET-API-003).
Sort-direction note: AET-FUNC-006's wording is ambiguous (flagged in the matrix AI review). The original builds its y domain bottom-to-top, so its earliest and alphabetical-descending comparators read top-to-bottom as earliest-onset-first and alphabetically ascending; the reimplementation asserts those top-to-bottom orders directly.
View-selector rollout (VIEW-3, #76)
One primary display — the participant timeline chart. Controls are Filters and a participant-ID sort order; the participant detail is a y-axis-click drill-down listing, not a view switch. Ruled single-view in the shared view-selector rollout (#76) — no view control is added; see view-selector-inventory.md.
Participant-profile rail (obot.roadmap#75 D9, PPRF-AE-005)
ae-timelines now mounts the railed participant profile. The deferral recorded here under PPRF-COV-001 — that ae-timelines ingests adverse-event records rather than the measure-per-visit long-lab contract the profile consumed — ended when v2 gave the profile an adverse-event domain of its own (obot.roadmap#75 decision D9).
There are no laboratory records here, so the profile renders as the AE story alone: header, summary block and timeline, with no spaghetti card and no measure table. Adoption rows are PPRF-AE-005 in the participant-profile matrix; unit evidence lives in tests/unit/participant-profile/ae-adoption.test.js.
Reproducing this report
The evidence set is regenerated from a full test run and committed with the code it qualifies; CI fails when they drift. To verify or rebuild it:
npm ci
npm run evidence:check   # compare a fresh run against the committed evidence
npm run evidence         # regenerate docs/evidence/ae-timelines/evidence.json
Screenshot baselines are canonical to the Linux CI runner; the repository's Update evidence baselines workflow is the authoritative way to refresh them. See CONTRIBUTING.md for the traceability convention.