Safety Delta-Delta: test evidence Safety Delta-Delta is exploratoryQualifiedValidated for regulated use. Nothing in safety.viz is, yet.ExploratoryThis chartTested and documented. Confirm every result.ExperimentalTested and documented, but what it shows or how it behaves may still change.PrototypeAn early look, on the docs site only. Not in the demo app.What each rung means
Requirement-traced qualification evidence for the safety.viz delta-delta module.
Requirement matrix ↗ — the reviewed source specification these tests trace to.
- Scope
- 34 coverage rows48 distinct requirement IDs
- Tests executed
- 1224 automated checks191 browser · 1033 unit
- Result
- pass all passing8 evidence screenshots
- Generated
- 2026-10-10 18:05 UTC
- Environment
linux 6.17.0-1022-azure · node v22.23.3 · playwright 1.61.1 · chromium 149.0.7827.55- Test run
- Actions run #38072575214
Scope & approach
Traceability for the delta-delta module (a Chart.js reimplementation of RhoInc/safety-delta-delta, matching behavior), built under #25 per the convention in CONTRIBUTING.md. Requirement IDs come from the reviewed 48-row matrix at requirements/safety-delta-delta.md, whose Evidence Type column routes rows (unit → Vitest, browser → Playwright). The renderer flattens long-format results (one row per measurement at a visit) to one point per participant: change in measure X (comparison-visit mean − baseline-visit mean) against change in measure Y.
Each table row traces one requirement to the automated test(s) that evidence it: the Requirement column shows the reviewed requirement text and its ID, the source-matrix rows link back to the specification, the issue column links the implementing work, and the result column shows the recorded outcome of every matching test from the committed evidence.json with its captured screenshots. Browser evidence is captured at fixed conditions (1280×800, device scale 1) on the canonical Linux CI environment.
Browser evidence (Playwright — tests/e2e/delta-delta.spec.js)
17 requirement rows · 17 tests
| Requirement | Source matrix rows | Issue | Tests & evidence |
|---|---|---|---|
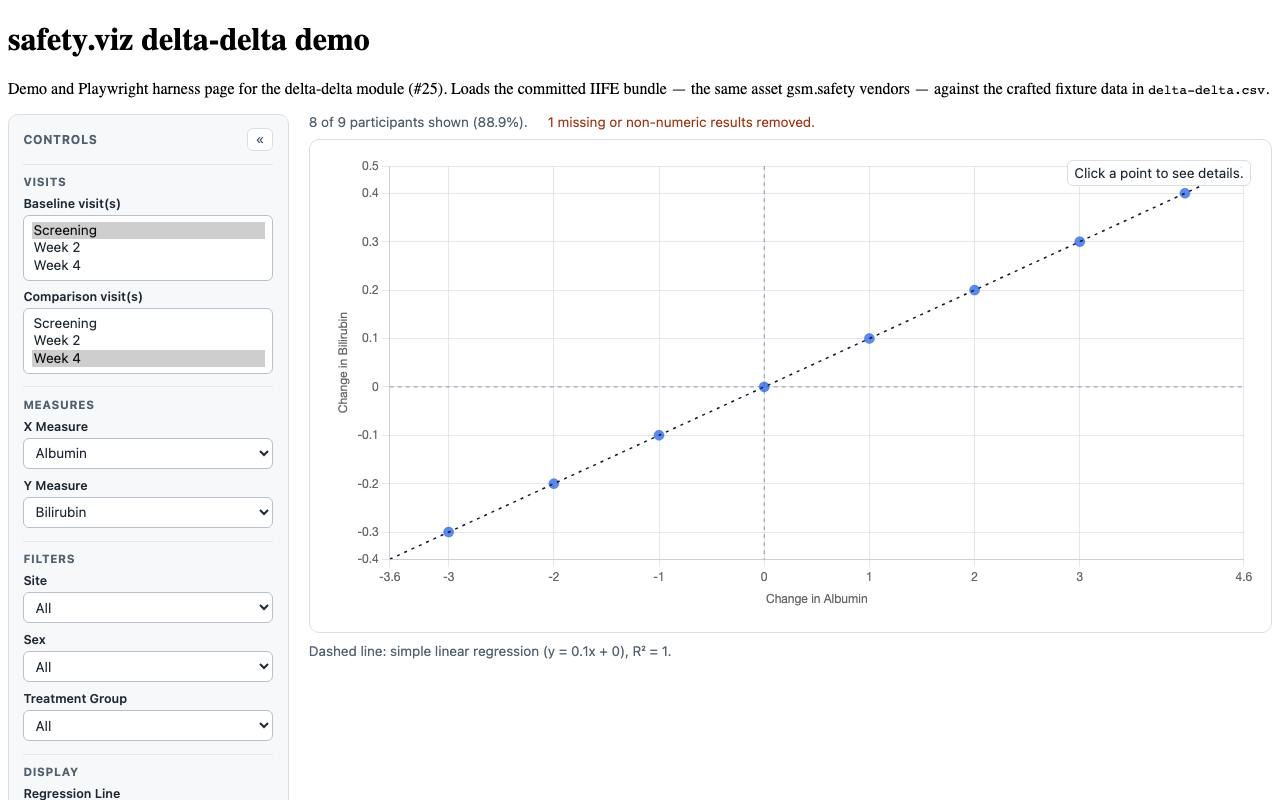
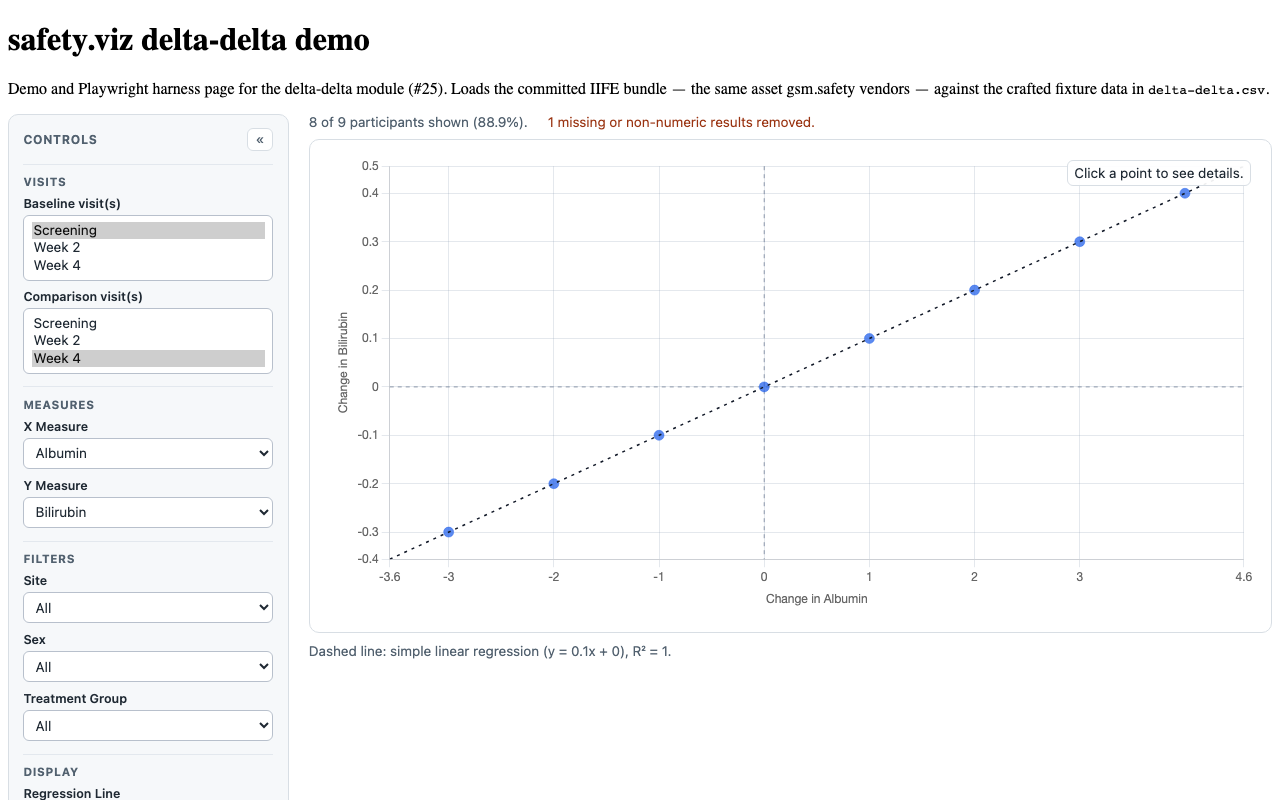
SDD-FUNC-001/SDD-FUNC-002/SDD-FUNC-003 SDD-FUNC-001 These multi-select controls are used to select the visits that are displayed in the chart. The default visits are set to the first/last visit in the data set, but the default value can be adjusted to any visit upon the project team's request. Users can interactively select any single visit, or shift-click to select multiple visits. Selecting a visit will update the delta-delta chart accordingly. When multiple visits are selected, all participant measures from those visits are averaged. SDD-FUNC-002 These controls are used to select the measures that are displayed in the chart. The default measures are set to the first and second measure found in the data set, but the default value can be adjusted to any measure upon the project team's request. Users can interactively select any measure, which updates the delta-delta chart accordingly. SDD-FUNC-003 The chart can be configured to have any number of data filters. Each specified filter has a drop-down menu that is used to filter the visit data that is displayed in the chart. | SDD-FUNC-001, SDD-FUNC-002, SDD-FUNC-003 | #25 |
  |
SDD-FUNC-002/SDD-REG-003 SDD-FUNC-002 These controls are used to select the measures that are displayed in the chart. The default measures are set to the first and second measure found in the data set, but the default value can be adjusted to any measure upon the project team's request. Users can interactively select any measure, which updates the delta-delta chart accordingly. SDD-REG-003 Confirm that plotted values represent the change between baseline and comparison visits for the selected measures. (Clicking points and then mousing over values in the detail table should make this relatively easy to QC). | SDD-FUNC-002, SDD-REG-003 | #25 |
|
SDD-FUNC-004 SDD-FUNC-004 Displayed under the controls, this statement provides the total number of participants in the data set in integers as well as the percentage of participants shown to one decimal place. When filters are used, the data shown in the histogram is manipulated and the number of participant records shown at the top of the page may increase or decrease, depending on the variable selected. | SDD-FUNC-004 | #25 |
|
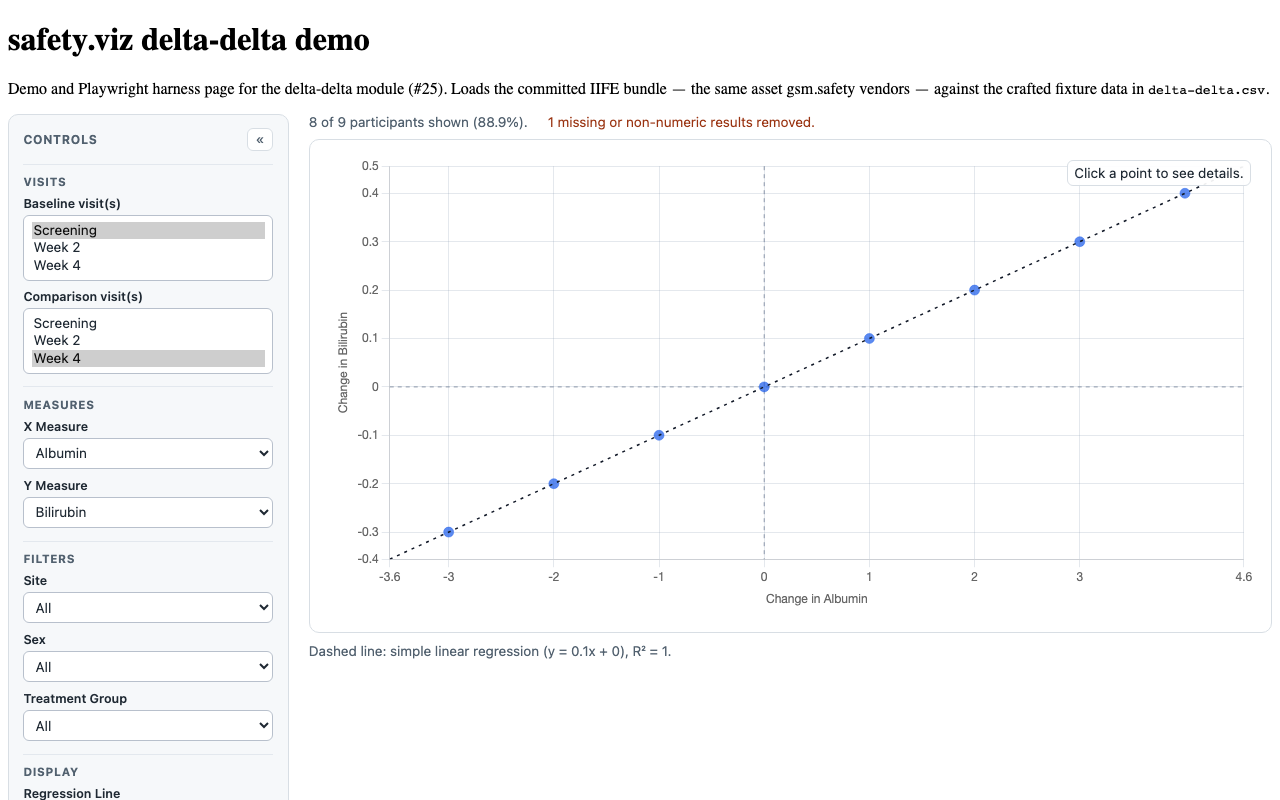
SDD-REG-008 SDD-REG-008 Confirm that missing or non-numeric values in the dataset are handled and removed, and that the number of missing and non-numeric records appears opposite the number of participants annotation, beneath the controls. View the same Console in the developer tools and look for the "xxxx missing or non-numeric results have been removed." warning message. Download the dataset, remove some numeric values, save the datset, and then upload the new version, and render the chart. The number of missing or non-numeric values shown in the warning message should increment accordingly. | SDD-REG-008 | #25 |
 |
SDD-REG-001 SDD-REG-001 Confirm that if the X or Y Measure filter is changed, the distribution of observations change. | SDD-REG-001 | #25 |
|
SDD-REG-002 SDD-REG-002 Confirm that if the Baseline or Comparison Visit filters are changed, the distribution of observations change. | SDD-REG-002 | #25 |
|
SDD-REG-006/SDD-REG-005 SDD-REG-005 View x of x participants note at the bottom of the controls: check that it updates when filters are applied SDD-REG-006 Confirm that filters work as expected. {"filters":[{"value_col":"SITE","label":"Site"}]} | SDD-REG-005, SDD-REG-006 | #25 |
|
SDD-FUNC-005 SDD-FUNC-005 By moving a mouse cursor over a point in the chart, users can display exact x- and y-values for the chosen point along with the ID for the selected participant. | SDD-FUNC-005 | #25 |
|
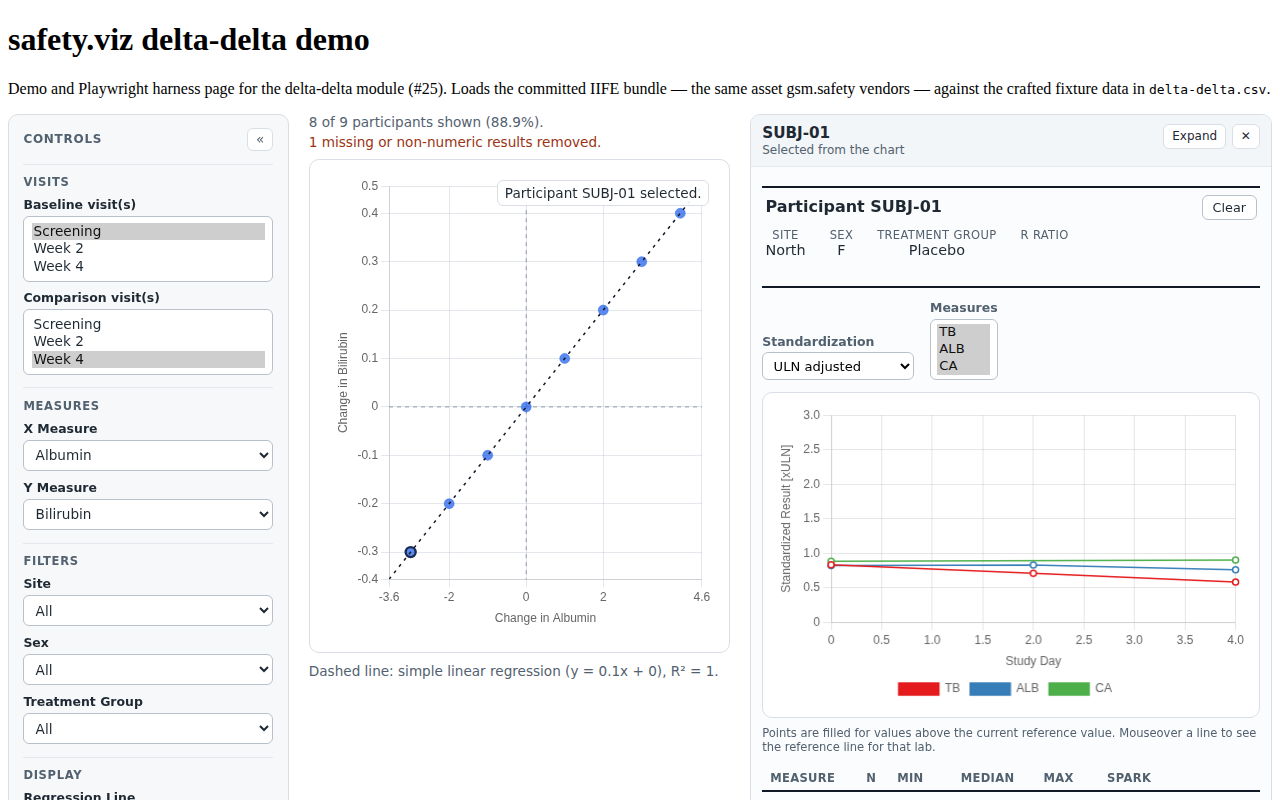
PPRF-DD-001/PPRF-DD-002/PPRF-DD-004 | PPRF-DD-001, PPRF-DD-002, PPRF-DD-004 (participant-profile matrix) | #99 |
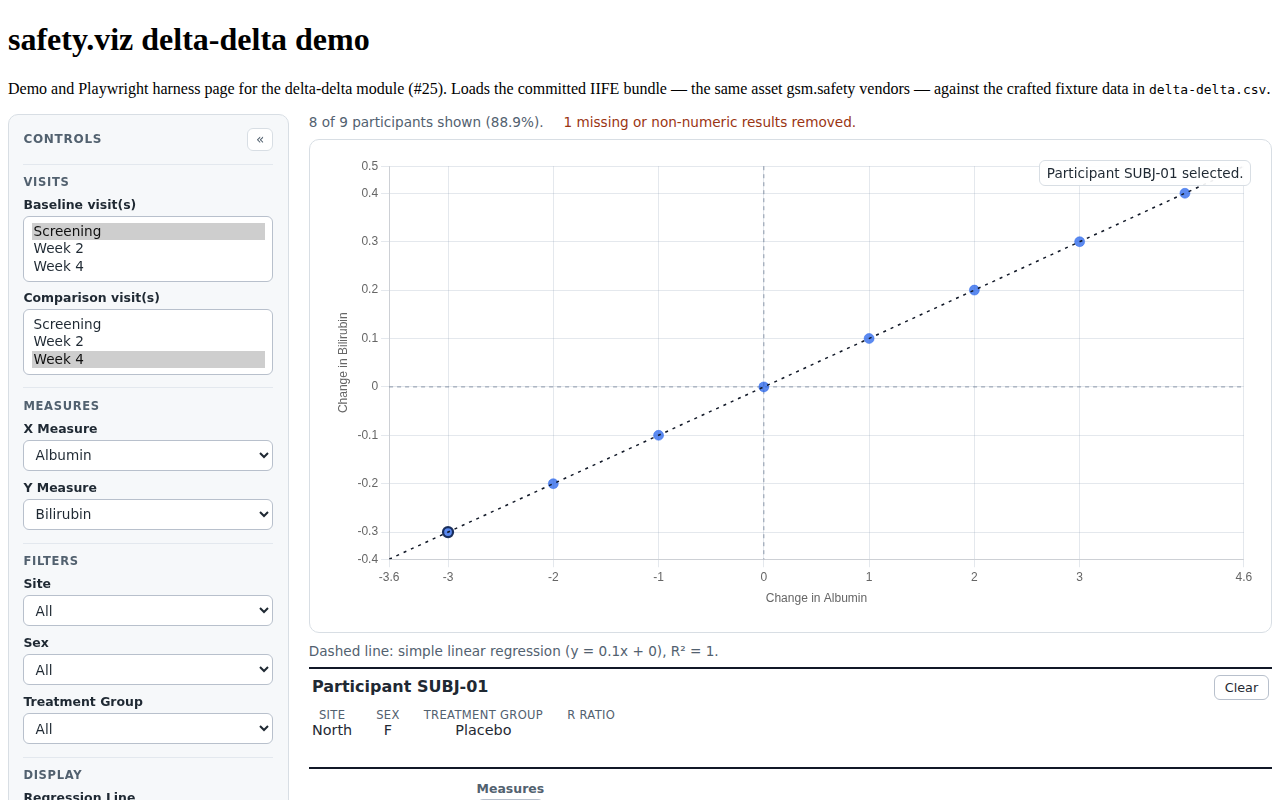  |
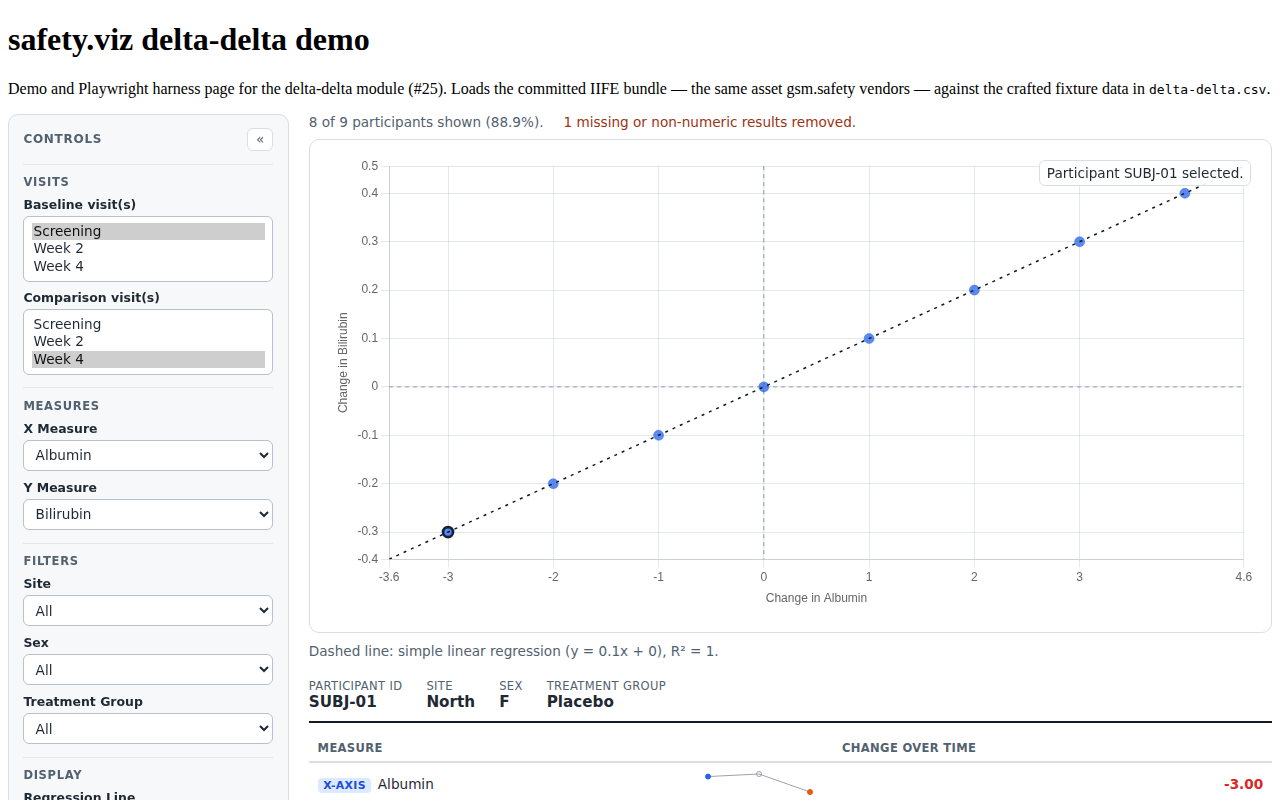
SDD-REG-012/SDD-REG-013/PPRF-DD-002 SDD-REG-012 Confirm that the clicked point is highlighted with a thick black border SDD-REG-013 Confirm that click a different point when the detail table is shown, redraws the table for the newly clicked participant. | SDD-REG-012, SDD-REG-013 (retargeted at chart border + rail), PPRF-DD-002 | #25 |
 |
PPRF-DD-003 (empty click) | PPRF-DD-003 (participant-profile matrix) | #99 |
|
PPRF-DD-003 (rail Clear) | PPRF-DD-003 (participant-profile matrix) | #99 |
|
PPRF-DD-003 (control change) | PPRF-DD-003 (participant-profile matrix) | #99 |
|
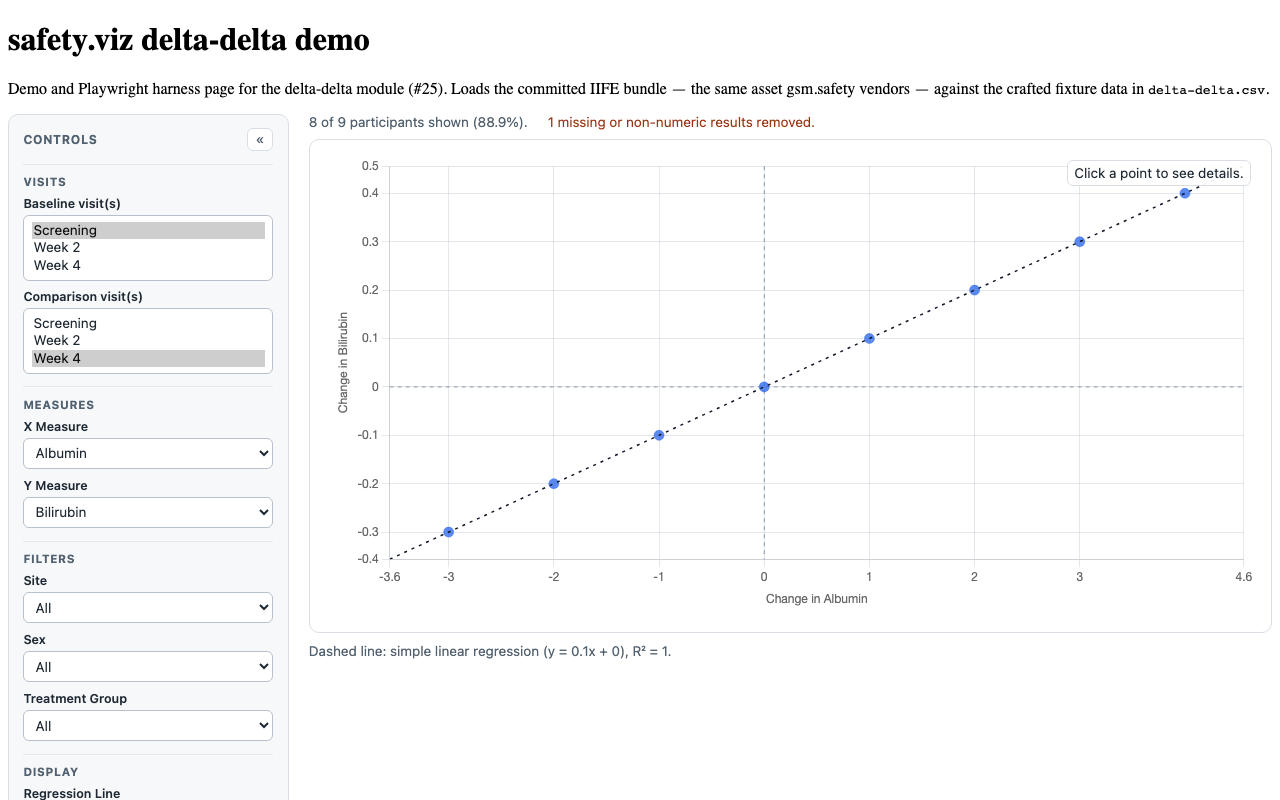
SDD-REG-026 SDD-REG-026 Indicates whether a regression line should be drawn on the delta-delta scatter plot | SDD-REG-026 | #25 |
 |
SDD-REG-007 SDD-REG-007 Confirm that if a filter is added for a variable that is not in the data, then a browser console warning is thrown. Add a made up filter such as {"filters":[{"value_col":"SOTE","label":"Sote"}]} and render the chart. Open the browser's developer tools to the Console view and look for the "The [ Sote ] filter has been removed because the variable does not exist." message. | SDD-REG-007 | #25 |
|
SDD-REG-010 SDD-REG-010 Confirm that specifying a non-existent value for a required field (such as Measure/Medical Sign or Result) and rendering the charts results in a "variable does not exist error" printed to both the console and the container element, and the chart is then destroyed. [[[TODO: ADD CODE]]] | SDD-REG-010 | #25 |
|
SDD-API-001 (module scheme) SDD-API-001 a factory to create a custom Webcharts chart object | — (see legacy-API note) | #25 |
|
Unit evidence (Vitest — tests/unit/delta-delta/)
17 requirement rows · 59 tests
| Requirement | Source matrix rows | Issue | Tests & evidence |
|---|---|---|---|
SDD-CFG-004..008 SDD-CFG-004 a variable that contains the names of each medical sign SDD-CFG-005 a variable that contains the results for each medical sign; non-numeric results are removed with a notification thrown to the log SDD-CFG-006 a variable that contains IDs for each participant SDD-CFG-007 a variable that contains the categorical visit where the measure was collected SDD-CFG-008 a variable that contains the numeric visit where the measure was collected | SDD-CFG-004, SDD-CFG-005, SDD-CFG-006, SDD-CFG-007, SDD-CFG-008 | #25 |
|
SDD-CFG-009..013 SDD-CFG-009 Measures to be used in delta-delta scatter plot. Must be a value of the SDD-CFG-010 Measure to be shown on the x-axis of the delta-delta plot SDD-CFG-011 Measure to be shown on the y-axis of the delta-delta plot SDD-CFG-012 Measure to be shown on the x-axis of the delta-delta plot SDD-CFG-013 Measure to be shown on the y-axis of the delta-delta plot | SDD-CFG-009, SDD-CFG-010, SDD-CFG-011, SDD-CFG-012, SDD-CFG-013 | #25 |
|
SDD-CFG-014/SDD-CFG-015 SDD-CFG-014 an array of variables and metadata that will appear in the controls as data filters SDD-CFG-015 an array of variables and metadata that will appear in the data listing | SDD-CFG-014, SDD-CFG-015 | #25 |
|
SDD-REG-003 (delta math) SDD-REG-003 Confirm that plotted values represent the change between baseline and comparison visits for the selected measures. (Clicking points and then mousing over values in the detail table should make this relatively easy to QC). | SDD-REG-003 | #25 |
|
SDD-FUNC-001/SDD-REG-004 (average) SDD-FUNC-001 These multi-select controls are used to select the visits that are displayed in the chart. The default visits are set to the first/last visit in the data set, but the default value can be adjusted to any visit upon the project team's request. Users can interactively select any single visit, or shift-click to select multiple visits. Selecting a visit will update the delta-delta chart accordingly. When multiple visits are selected, all participant measures from those visits are averaged. SDD-REG-004 Confirm that multi-select (shift-click) in Visit Filters works as expected. Participant with multiple values should have their values averaged. Click a point and mouseover points in the the detail section to confirm. | SDD-FUNC-001, SDD-REG-004 | #25 |
|
SDD-REG-008 (removal) SDD-REG-008 Confirm that missing or non-numeric values in the dataset are handled and removed, and that the number of missing and non-numeric records appears opposite the number of participants annotation, beneath the controls. View the same Console in the developer tools and look for the "xxxx missing or non-numeric results have been removed." warning message. Download the dataset, remove some numeric values, save the datset, and then upload the new version, and render the chart. The number of missing or non-numeric values shown in the warning message should increment accordingly. | SDD-REG-008 | #25 |
|
SDD-REG-019/022/023/025 SDD-REG-019 Confirm that one row is shown for each measure collected for the clicked participant SDD-REG-022 Confirm that values where baseline or comparison visits are missing renderer with a gray "NA" SDD-REG-023 Confirm that in the sparkline, baseline visits are shown as filled blue circles, comparison visits are shown as filled orange circles and other visits are shown as empty gray circles. SDD-REG-025 Confirm that the currently selected x- and y-axis measures have the appropriate light blue tags. | SDD-REG-019, SDD-REG-022, SDD-REG-023, SDD-REG-025 | #25 |
|
SDD-REG-006 (filters) SDD-REG-006 Confirm that filters work as expected. {"filters":[{"value_col":"SITE","label":"Site"}]} | SDD-REG-006 | #25 |
|
SDD-REG-021/022 (format/color) SDD-REG-021 Confirm that change over time values are red if they are less than 0, green if they are greater than 0 and black if they equal 0. SDD-REG-022 Confirm that values where baseline or comparison visits are missing renderer with a gray "NA" | SDD-REG-021, SDD-REG-022 | #25 |
|
SDD-REG-015 (axis padding) SDD-REG-015 Confirm that the points are not cut off on the edge of the chart. | SDD-REG-015 | #25 |
|
SDD-REG-026 (regression) SDD-REG-026 Indicates whether a regression line should be drawn on the delta-delta scatter plot | SDD-REG-026 | #25 |
|
SDD-FUNC-004 (count text) SDD-FUNC-004 Displayed under the controls, this statement provides the total number of participants in the data set in integers as well as the percentage of participants shown to one decimal place. When filters are used, the data shown in the histogram is manipulated and the number of participant records shown at the top of the page may increase or decrease, depending on the variable selected. | SDD-FUNC-004 | #25 |
|
SDD-REG-012 (selection) SDD-REG-012 Confirm that the clicked point is highlighted with a thick black border | SDD-REG-012 | #25 |
|
SDD-DATA-001/SDD-REG-010 (guard) SDD-DATA-001 The Safety Delta-Delta plot accepts JSON data of the format returned by SDD-REG-010 Confirm that specifying a non-existent value for a required field (such as Measure/Medical Sign or Result) and rendering the charts results in a "variable does not exist error" printed to both the console and the container element, and the chart is then destroyed. [[[TODO: ADD CODE]]] | SDD-DATA-001, SDD-REG-010 | #25 |
|
SDD-MEAS-001/002 (measures whitelist) SDD-MEAS-001 The SDD-MEAS-002 A configured measure absent from the data is dropped from the X and Y Measure pickers with a console warning naming it; when none of the configured measures is present the control falls back to every measure in the data rather than rendering empty. | SDD-MEAS-001, SDD-MEAS-002 | #136 |
|
SDD-FILT-001..004 (shared filter contract) SDD-FILT-001 A filter spec accepts SDD-FILT-002 SDD-FILT-003 SDD-FILT-004 | SDD-FILT-001, SDD-FILT-002, SDD-FILT-003, SDD-FILT-004 | #166 |
|
SDD-CTRL-001 (whole-chart reset) SDD-CTRL-001 A reset control at the foot of the control panel restores every settings-derived control to its configured default, re-derives the data-driven measure and visit defaults, clears the point selection, the docked profile and the linked listing, and re-renders. | SDD-CTRL-001 | #136 |
|
Railed participant profile (#99, PPRF-12)
0 requirement rows · 0 tests
| Requirement | Source matrix rows | Issue | Tests & evidence |
|---|
Visual evidence
Every screenshot below is a committed baseline: the same PNG is the visual-regression baseline the browser suite asserts against and the evidence artifact shown here. Click any capture for the full-resolution image.
PPRF DD 002 docked profile PPRF DD 002 railed profile SDD FUNC 001 control panel SDD FUNC 002 baseline scatter 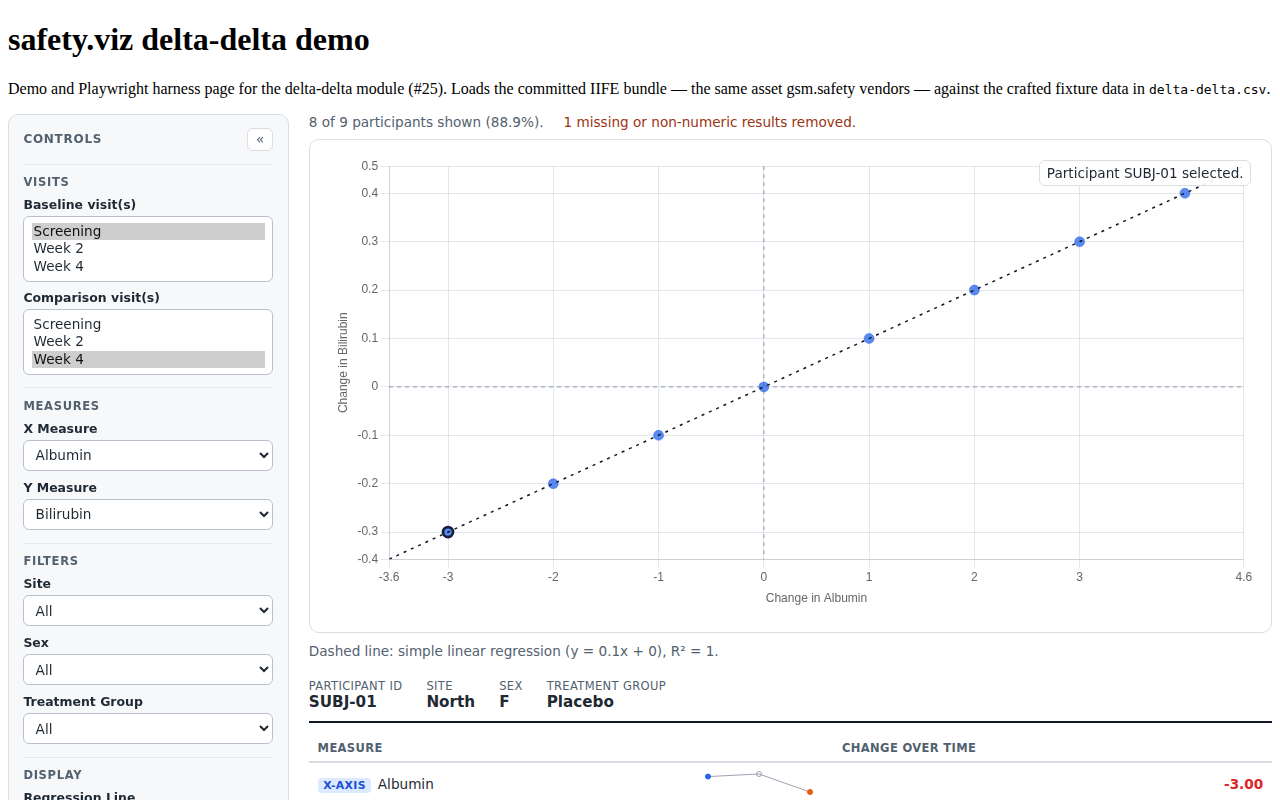
SDD FUNC 006 measure table SDD REG 008 invalid data note SDD REG 012 point selected SDD REG 026 regression line
Source-matrix routing status (48 rows)
- Fully evidenced (30 rows): SDD-FUNC-001..005, SDD-REG-001..008, SDD-REG-010, SDD-REG-012/013, SDD-REG-026, SDD-DATA-001, SDD-CFG-004..015. Each maps to a browser and/or unit test above.
- Superseded (13 rows, #99 PPRF-12): SDD-FUNC-006 (table portion), SDD-REG-011, SDD-REG-014, SDD-REG-016..025 — the bespoke measure table the rows describe was replaced by the railed participant profile (see above).
- Partial / addressed by implementation (2 rows): - SDD-REG-009 — the initial X/Y measure is honored (
measure_x/measure_y, verified via the default-selection browser test andconfigure), but the row's "with units attached" clause is descoped: the original renderer labels measures by their baremeasure_colvalue, so unit-suffixed measure labels are intentionally not reproduced. - SDD-REG-015 ("points are not cut off on the edge of the chart") — the delta domain includes 0 and pads beyond the data extent (deltaDomain, unit tested) and the chart adds layout padding, so edge points render inside the frame. No pixel-level assertion is made; this is a visual acceptance item. - Descoped — legacy Webcharts API/config (2 rows): SDD-CFG-001 and SDD-CFG-002 describe configuring the chart as a Webcharts
chartobject withwebchartsSettings.js. Per the cross-renderer legacy-API decision (design #2), the nextgen module does not preserve the Webcharts configuration surface; it ships flatDEFAULT_SETTINGS(documented in the API reference) instead.
Legacy-API note: source-matrix SDD-API-001 ("a factory to create a custom Webcharts chart object") describes the legacy Webcharts API, which the designs intentionally do not preserve. The module ships the histogram's proven lifecycle API instead — deltaDelta(element, settings) returning an instance with init/setData/setSettings/render/resize/destroy — evidenced as SDD-API-001 in the module scheme above.
Removed/merged upstream (AI review): SDD-CFG-003, SDD-CFG-016, SDD-API-002, SDD-REQ-001, and SDD-REQ-002 were dropped in the safety.agent matrix review as introductory/aggregate text or navigation artifacts, and are not counted in the 48 rows.
View-selector rollout (VIEW-3, #76)
One primary display — the paired change-from-baseline scatter. The per-measure table is a point-click drill-down beside the persistent chart, not a mutually-exclusive view switch. Ruled single-view in the shared view-selector rollout (#76) — no view control is added; see view-selector-inventory.md.
Reproducing this report
The evidence set is regenerated from a full test run and committed with the code it qualifies; CI fails when they drift. To verify or rebuild it:
npm ci
npm run evidence:check   # compare a fresh run against the committed evidence
npm run evidence         # regenerate docs/evidence/delta-delta/evidence.json
Screenshot baselines are canonical to the Linux CI runner; the repository's Update evidence baselines workflow is the authoritative way to refresh them. See CONTRIBUTING.md for the traceability convention.