Hepatic Safety Explorer: test evidence Hepatic Safety Explorer is exploratoryQualifiedValidated for regulated use. Nothing in safety.viz is, yet.ExploratoryThis chartTested and documented. Confirm every result.ExperimentalTested and documented, but what it shows or how it behaves may still change.PrototypeAn early look, on the docs site only. Not in the demo app.What each rung means
Requirement-traced qualification evidence for the safety.viz hep-explorer module.
Requirement matrix ↗ — the reviewed source specification these tests trace to.
- Scope
- 71 coverage rows116 distinct requirement IDs
- Tests executed
- 1523 automated checks221 browser · 1302 unit
- Result
- pass all passing26 evidence screenshots
- Generated
- 2026-10-10 18:05 UTC
- Environment
linux 6.17.0-1022-azure · node v22.23.3 · playwright 1.61.1 · chromium 149.0.7827.55- Test run
- Actions run #38072575214
Scope & approach
Traceability for the hep-explorer module (a Chart.js reimplementation of the SafetyGraphics/hep-explorer eDISH hepatotoxicity explorer matching its core behavior, under #43), per the convention in CONTRIBUTING.md. Requirement IDs use the module's condensed **HEP-*** scheme cited in the source and test names — HEP-CHART-* (scatter/axes), HEP-QUAD-* (quadrants/cutpoints), HEP-CTRL-* (controls), HEP-DISPLAY-* (eDISH/mDISH standardization), HEP-SELECT-* (participant detail/visit path), HEP-DATA-* (data contract/cleaning), HEP-API-* (lifecycle/events), and HEP-COMP-* (the composite plot for abnormal-baseline subjects, #67). A reviewed source requirement matrix (hep-explorer.md in the requirements repo) is not yet published, so the source-matrix column is pending; each row lists the module IDs its test covers.
Each table row traces one requirement to the automated test(s) that evidence it: the Requirement column shows the reviewed requirement text and its ID, the source-matrix rows link back to the specification, the issue column links the implementing work, and the result column shows the recorded outcome of every matching test from the committed evidence.json with its captured screenshots. Browser evidence is captured at fixed conditions (1280×800, device scale 1) on the canonical Linux CI environment.
Browser evidence (Playwright — tests/e2e/hep-explorer.spec.js)
45 requirement rows · 44 tests
| Requirement | Source matrix rows | Issue | Tests & evidence |
|---|---|---|---|
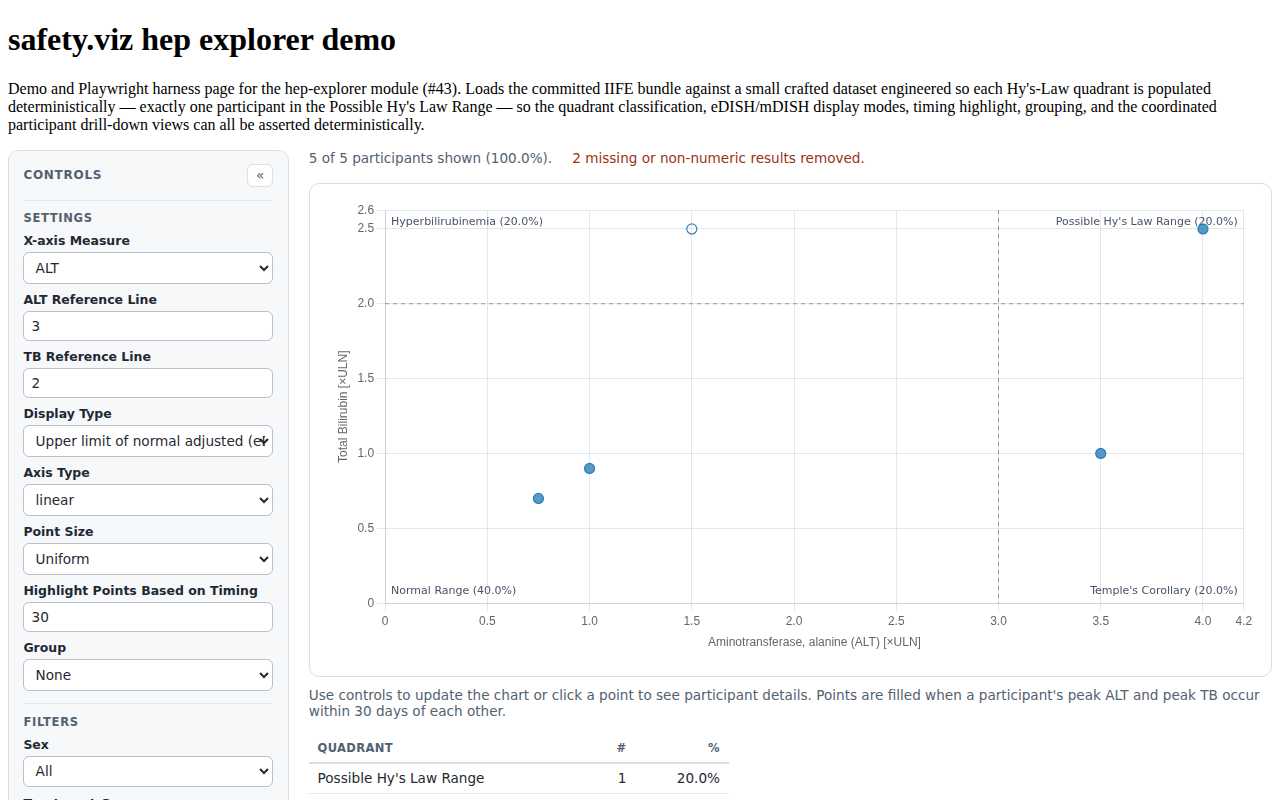
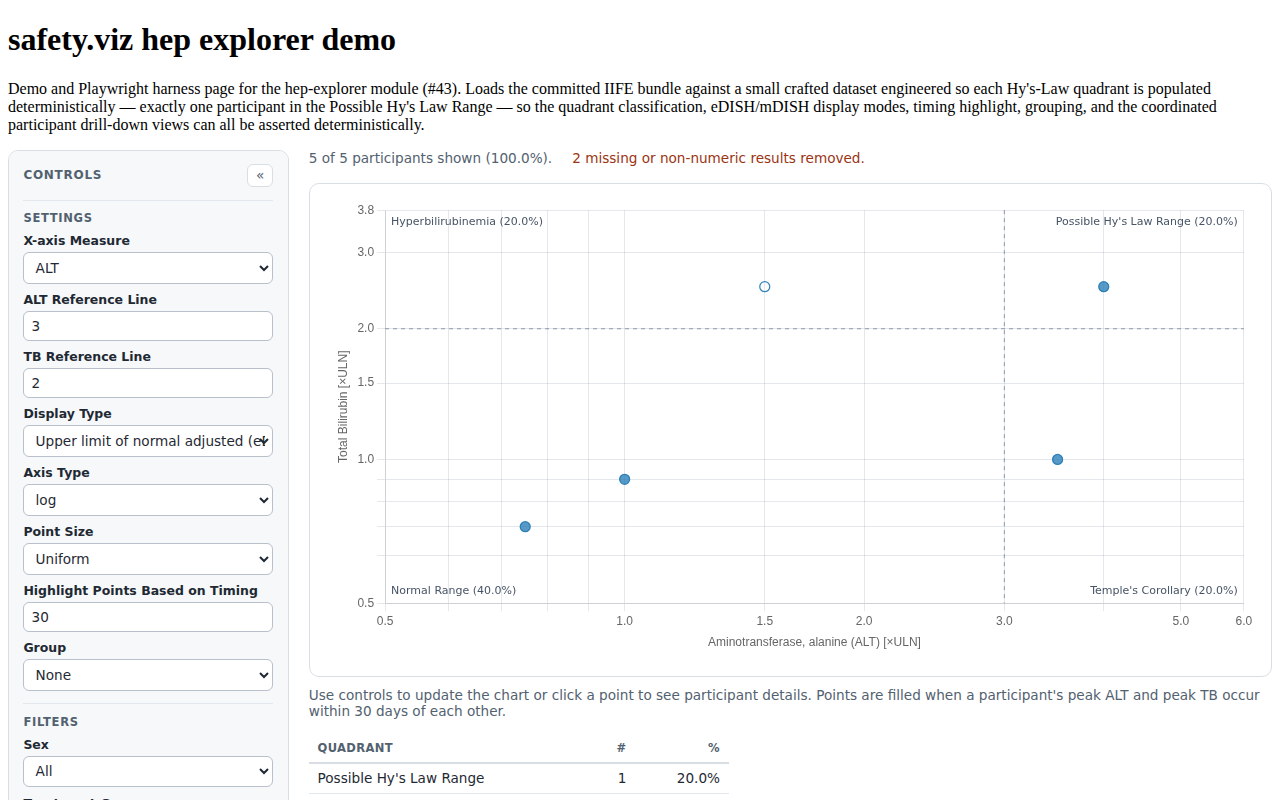
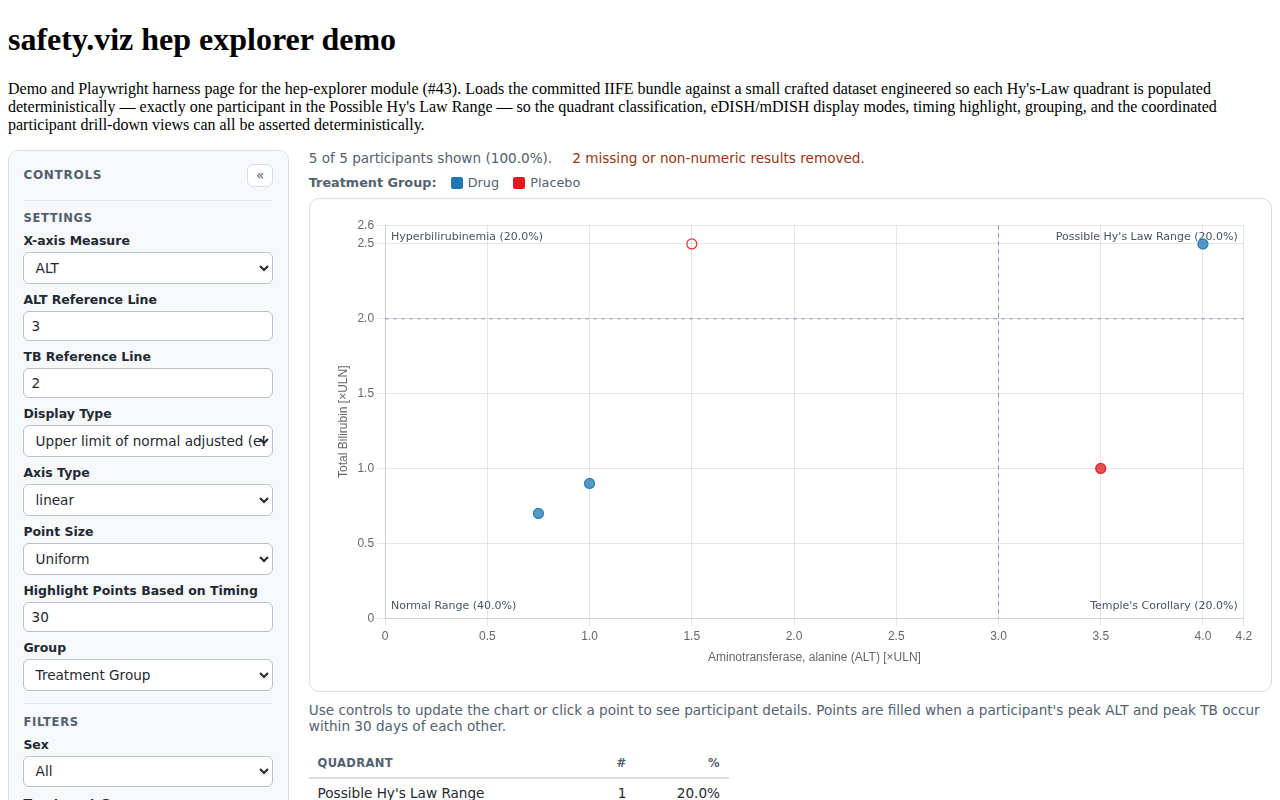
HEP-CTRL-001/002/006/007/008/009/010/011/012 HEP-CTRL-001 An X-axis Measure select offers the configured x_options and plots x_default (ALT) on first render. HEP-CTRL-002 A Y-axis Measure select is rendered only when y_options has more than one entry; a single option (TB) drops the control. HEP-CTRL-006 An Axis Type select toggles both scatter axes between linear and log. HEP-CTRL-007 A Point Size select offers Uniform and rRatio, sizing points either at a uniform radius or scaled by the participant R-Ratio. HEP-CTRL-008 A timing-window number input ('Highlight Points Based on Timing') sets the day threshold (default 30) that decides filled vs hollow points. HEP-CTRL-009 A Group color-by select (always offering a leading 'None' option) colors the points by the chosen column and renders a legend; the control is dropped when only None is available. HEP-CTRL-010 An R-Ratio range filter (min/max number inputs plus a reset) filters participants by R-Ratio, seeding a null max from the largest finite participant R-Ratio in the data. HEP-CTRL-011 Categorical data-filter selects narrow the shown participants; filters whose column is absent from the data are dropped with a console warning. HEP-CTRL-012 Per-axis Reference Line number inputs set the X/Y Hy's-Law cutpoints, clamped to ≥ 0, driving the quadrant classification. | — | #43 |
    |
HEP-DATA-001, HEP-CTRL-011 HEP-DATA-001 Input data is long-format — one record per participant per measure per visit/day — and the module reduces it to a single plotted point per participant (settings.id_col). HEP-CTRL-011 Categorical data-filter selects narrow the shown participants; filters whose column is absent from the data are dropped with a console warning. | — | #43 |
|
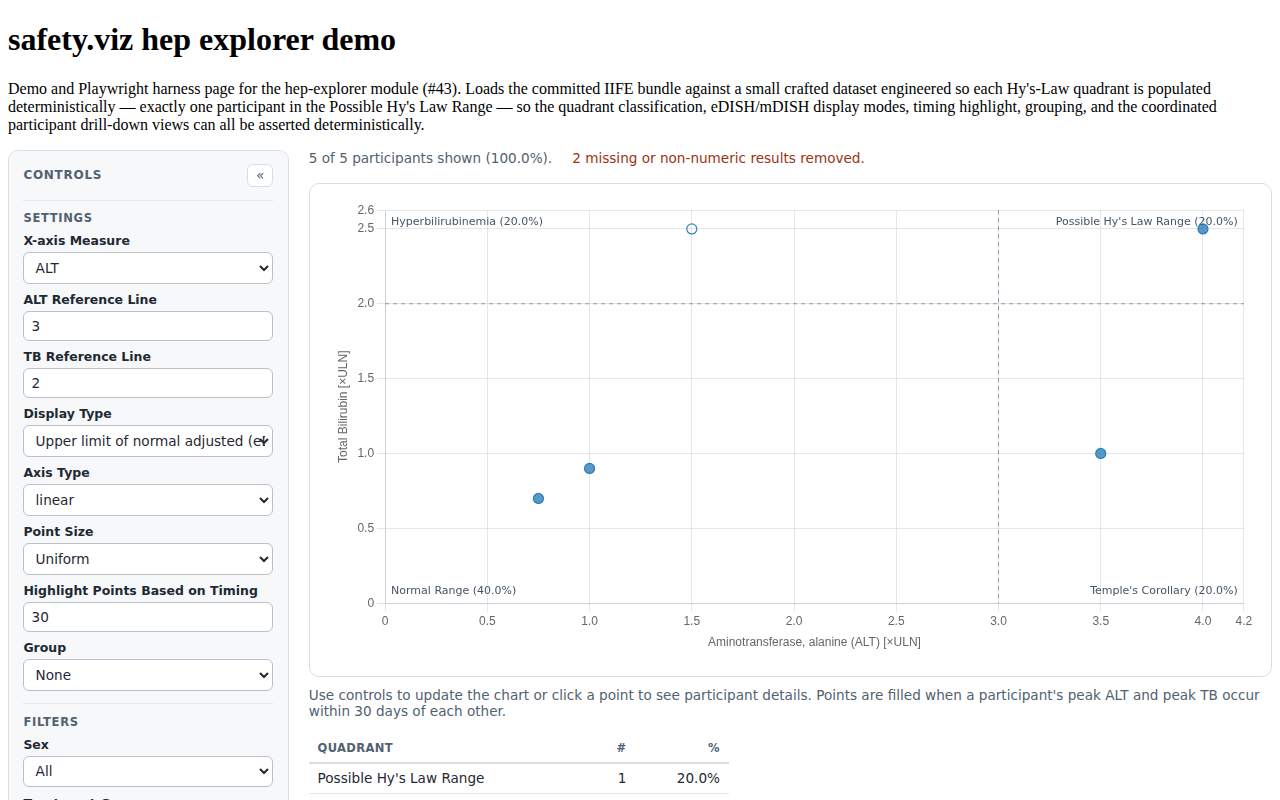
HEP-DATA-003 HEP-DATA-003 cleanData removes rows whose result is blank or non-numeric, or whose ULN is non-numeric or ≤ 0, returns the count of removed records, and that count is surfaced on-page as a warning note reading "N missing or non-numeric results removed." | — | #43 |
 |
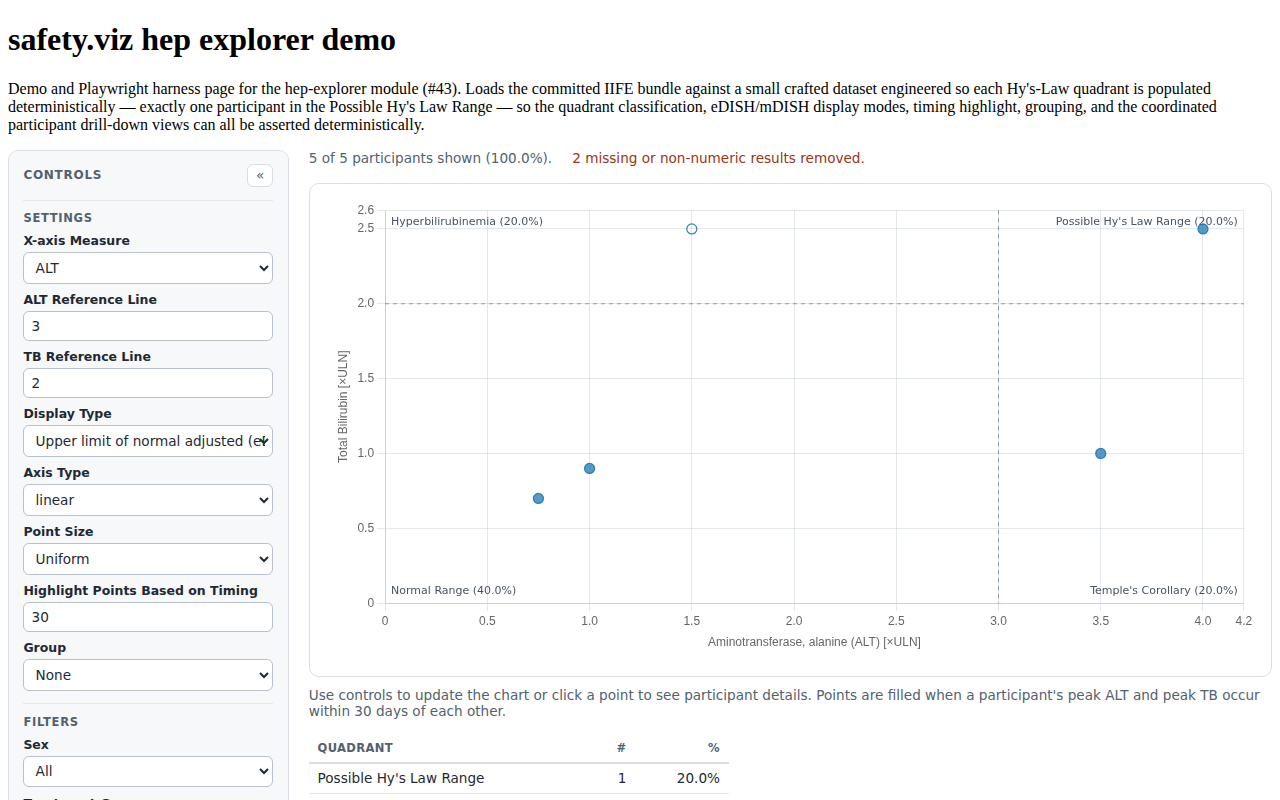
HEP-QUAD-002/003/004/005 HEP-QUAD-002 Two dashed grey cut-lines at the X and Y cutpoints split the plot into the four named Hy's-Law quadrants — Possible Hy's Law Range (upper-right, High/High), Hyperbilirubinemia (upper-left, Normal/High), Temple's Corollary (lower-right, High/Normal), and Normal Range (lower-left, Normal/Normal). HEP-QUAD-003 Each quadrant corner draws its label with the live participant percent (e.g. "Possible Hy's Law Range (20.0%)"), anchored to its corner and updating as points are reclassified. HEP-QUAD-004 classifyQuadrants buckets each shown point into a quadrant by xCat = x ≥ xCut ? High : Normal (likewise y), so a point exactly on a cutpoint counts as High, and returns per-position counts and percent-of-shown-points (zero percents for empty data). HEP-QUAD-005 A quadrant summary table with Quadrant | # | % columns lists all four quadrants with their live participant count and percent, staying in sync with the corner labels as cuts move. | — | #43 |
 |
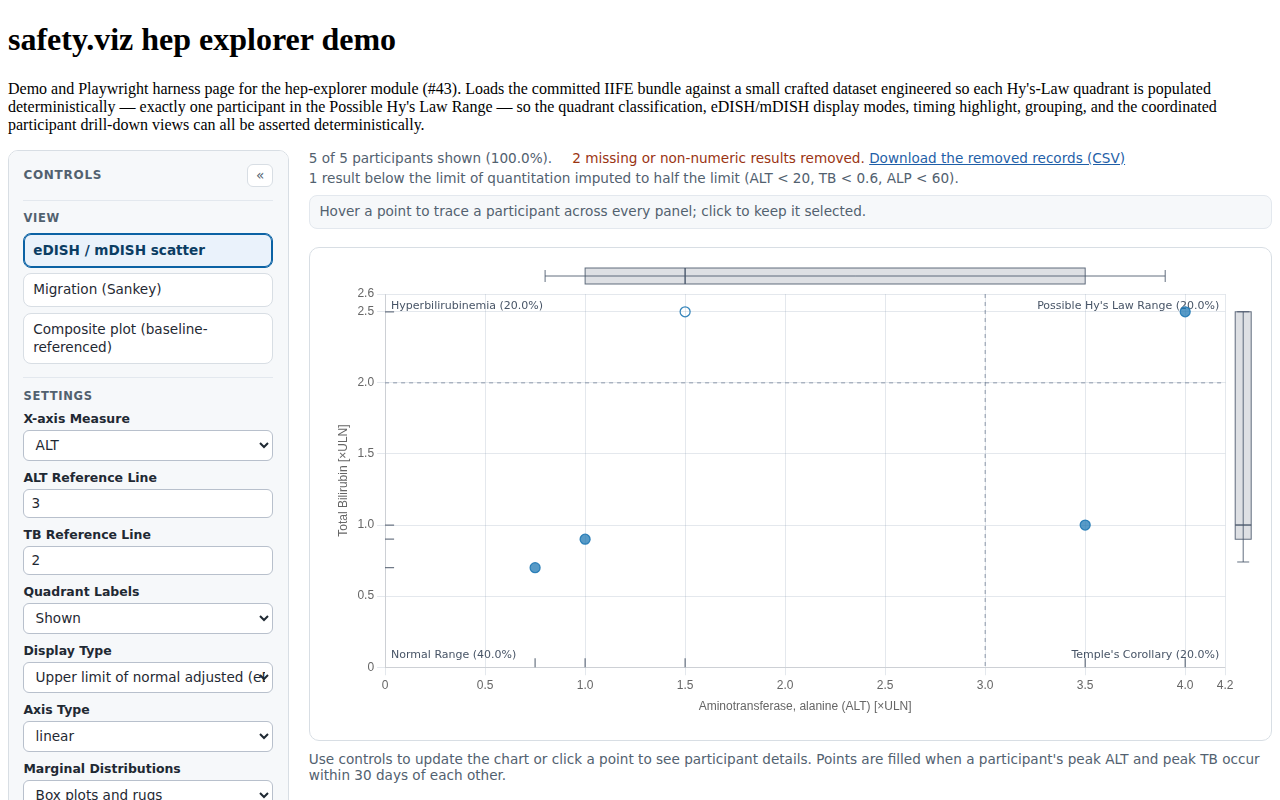
HEP-MARG-001/002/003 HEP-MARG-001 A marginal box-and-whisker plot summarizing the x measure is drawn in a reserved strip above the scatter, and one summarizing the y measure in a reserved strip to its right — box Q1–Q3 with the median rule, whiskers at the 5th and 95th percentiles — computed over the participants CURRENTLY SHOWN (after every filter) using the library's shared R-7 quantiles. HEP-MARG-002 An axis rug — one tick per shown participant — is drawn along the bottom edge for the x measure and the left edge for the y measure, inside the plot, so ties and pile-ups the overlapping point cloud conceals stay visible. HEP-MARG-003 A Marginal Distributions control offers box plots and rugs (the default), box plots alone, rugs alone, and hidden; the marginals redraw with every change to the filters, the plotted measures, the display mode and the axis type, and the geometry is published on the chart so the summary can be asserted as statistics rather than pixels. | — | #47 |
 |
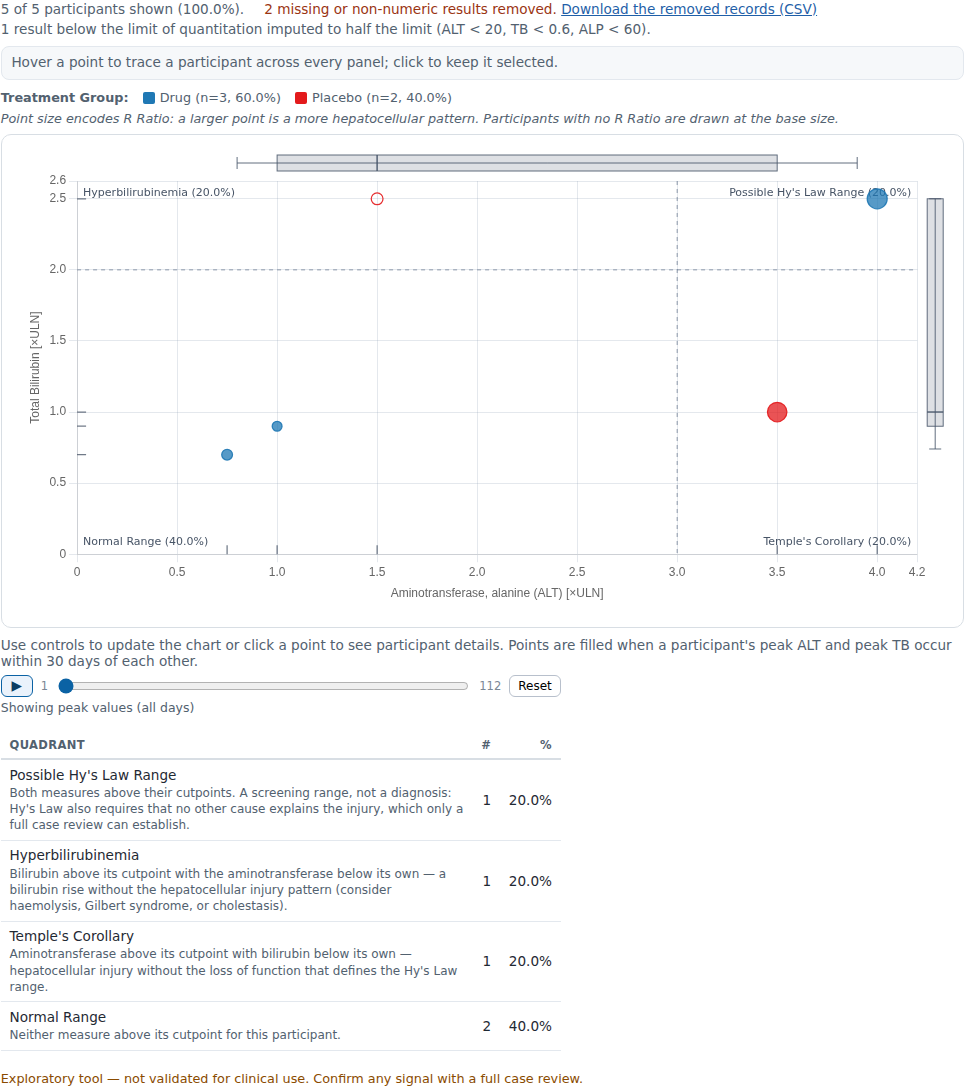
HEP-QUAD-007/008, HEP-CTRL-013/014, HEP-CAUTION-001 HEP-QUAD-007 A Quadrant Labels control turns the four corner labels on and off. Hiding them changes nothing else: the cut-lines still draw, the classification still runs, and the summary table still reports every count and percent. HEP-QUAD-008 Each row of the quadrant summary table states what landing in that quadrant means clinically, beside the count of participants who did — including, for the upper-right quadrant, that it is a screening RANGE and not a diagnosis, since Hy's Law additionally requires that no other cause explains the injury. HEP-CTRL-013 Each colour-by legend entry carries that group's participant count and its percentage of the plotted points, so the legend says how much of the chart a group accounts for and not only which colour it is. Percentages are of every plotted point, so a cohort with missing group values does not read as fully covered. HEP-CTRL-014 When Point Size is set to R Ratio the legend states what size encodes and which way it runs, and notes that participants with no R Ratio are drawn at the base size; the Uniform setting adds no note, because size then carries no meaning to explain. HEP-CAUTION-001 The chart carries a standing caution — exploratory tool, not validated for clinical use, confirm any signal with a full case review — rendered once into the module shell and shown in EVERY view, not written into the per-view footnote. | — | #54 |
 |
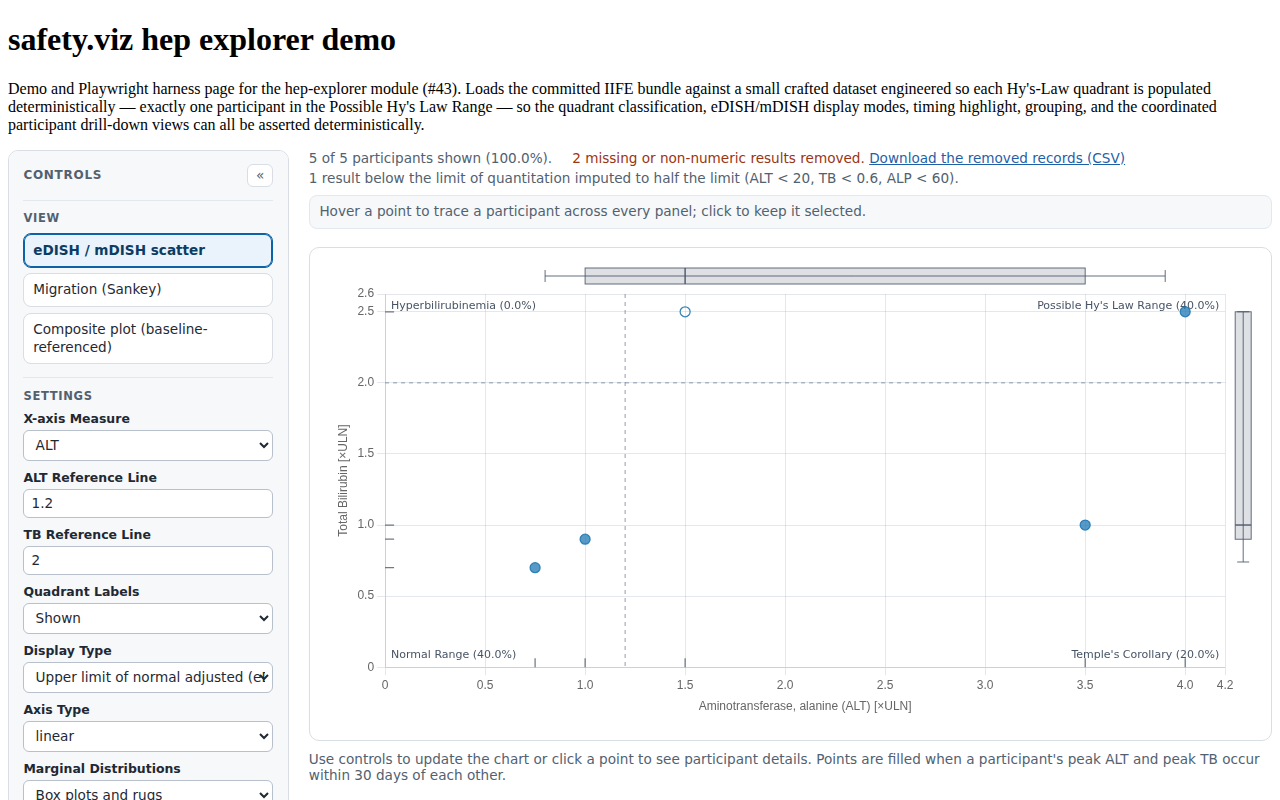
HEP-QUAD-006 HEP-QUAD-006 Either cut-line can be moved by dragging it on the plot as well as by typing in its Reference Line input: the pointer takes hold of whichever line it is nearest (never both at once), the line follows the pointer clamped inside the axis, and the quadrant counts, corner percents and summary table reclassify continuously during the drag rather than on release. The drag writes its value into that axis's Reference Line input, and a drag is not also a click on the plot background, so an open selection survives it. | — | #45 |
 |
HEP-QUAD-001/004 HEP-QUAD-001 Default Hy's-Law cutpoints reproduce the original renderer (TB 2×ULN / 4.8×Baseline, ALP 1×ULN / 3.8×Baseline, rRatio 5/5, and a HEP-QUAD-004 classifyQuadrants buckets each shown point into a quadrant by xCat = x ≥ xCut ? High : Normal (likewise y), so a point exactly on a cutpoint counts as High, and returns per-position counts and percent-of-shown-points (zero percents for empty data). | — | #43 |
|
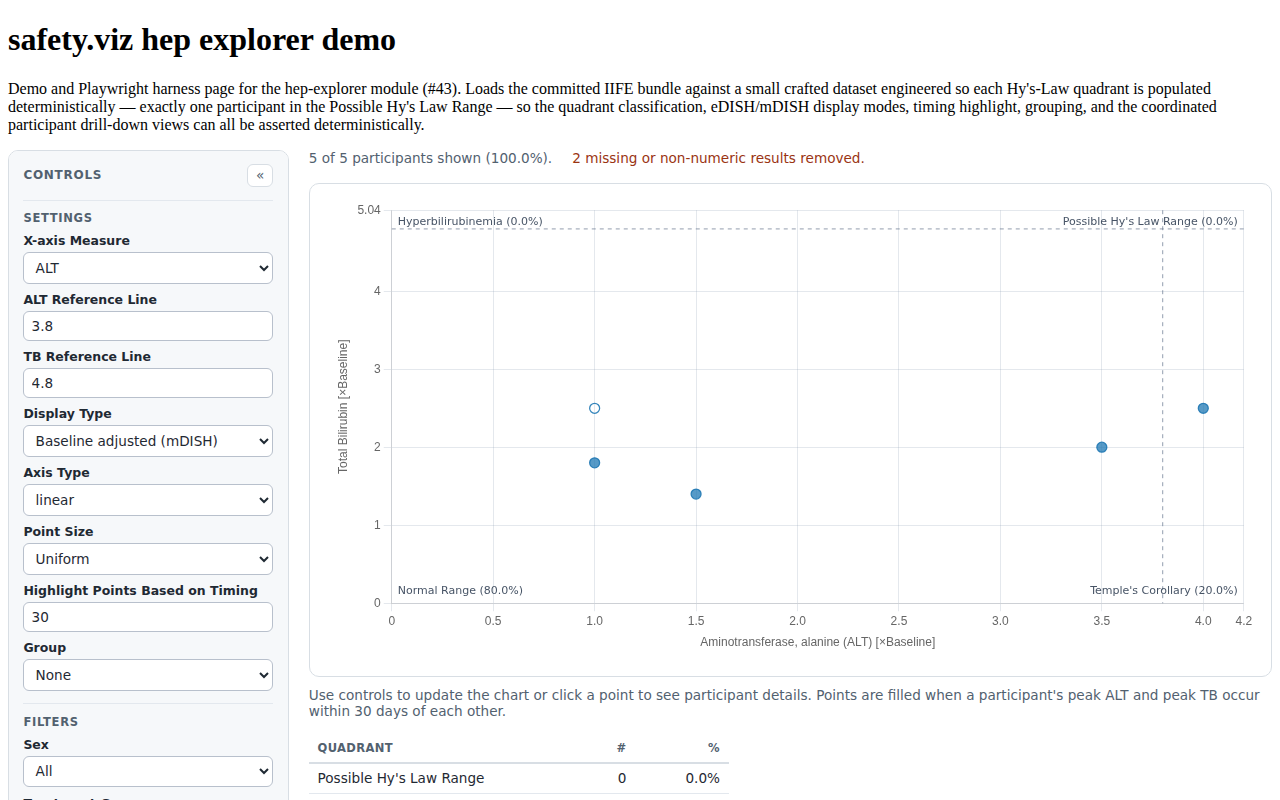
HEP-DISPLAY-001/002, HEP-CHART-002 HEP-DISPLAY-001 The Display Type control switches the active standardization between 'Upper limit of normal adjusted (eDISH)' (÷ULN, ×ULN) and 'Baseline adjusted (mDISH)' (÷baseline, ×Baseline), re-deriving every displayed value; in mDISH the ×Baseline denominator for a participant×measure group is the study-day-0 record, else the earliest day (or the first input-order record when no day column is present). HEP-DISPLAY-002 The ×ULN (eDISH) standardization divides each result by its upper-limit-of-normal value (normal_col_high, default STNRHI). HEP-CHART-002 Each axis is titled with the selected measure's full label plus a standardization suffix ([×ULN] for eDISH, [×Baseline] for mDISH). | — | #43 |
|
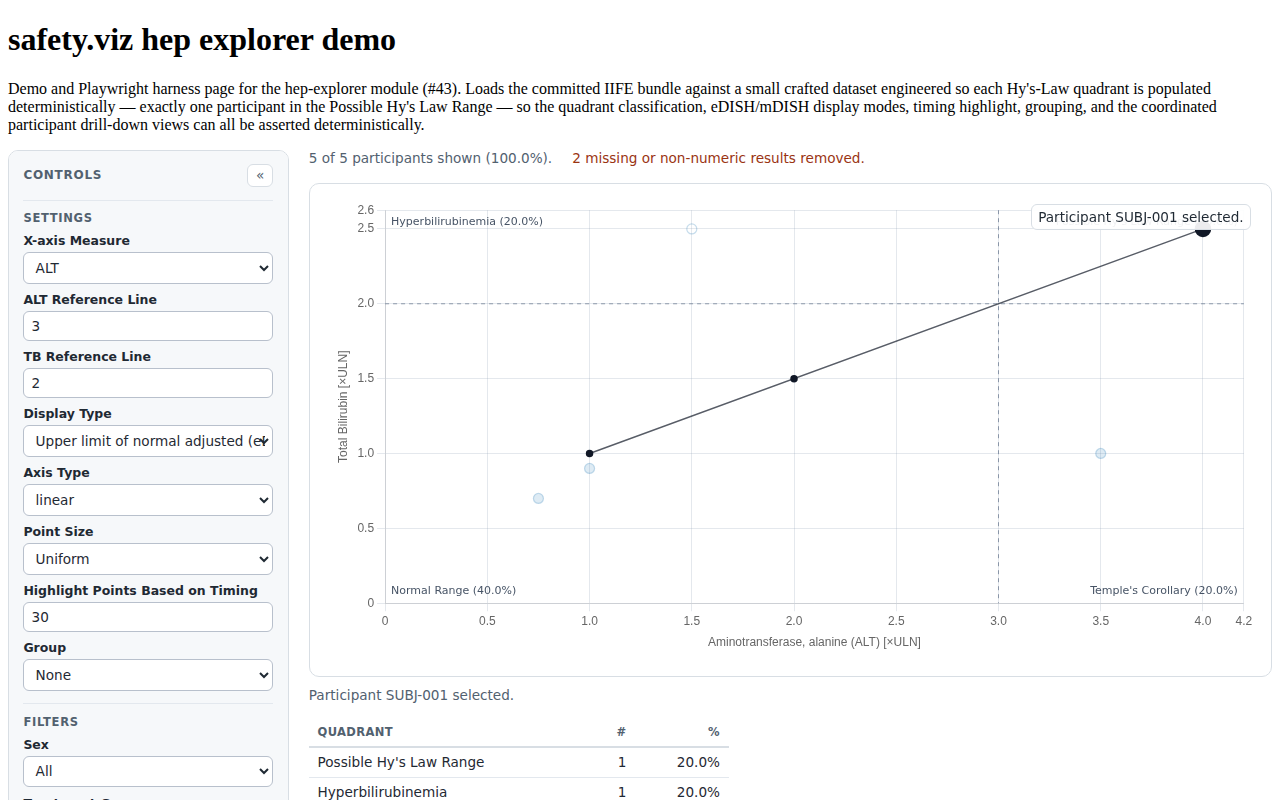
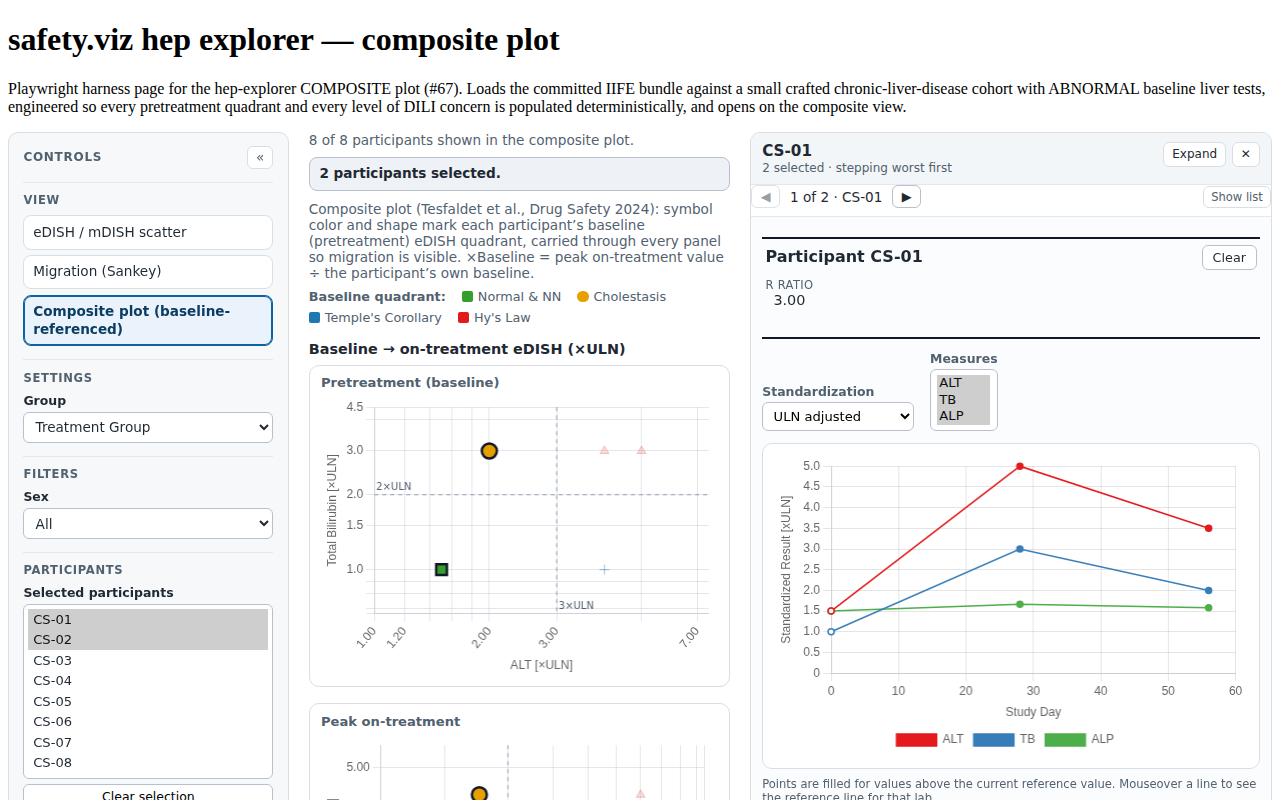
HEP-SELECT-001/002/003/005/006 HEP-SELECT-001 Clicking a scatter point selects that participant and highlights it (selected point opaque, others dimmed). HEP-SELECT-002 Selecting a participant opens the docked participant profile's 'Standardized Lab Values by Study Day' spaghetti — one day-ordered line per present liver measure in the active display units — and re-selecting destroys the prior profile charts before drawing the new ones so no Chart.js instance leaks (sv#98: the bespoke drawDetail chart is deleted; the dock delivers this requirement). HEP-SELECT-003 Selecting a participant draws a visit-path trajectory overlay pairing X/Y standardized values by shared visit (else study day, else sequence) in chronological order, only where both measures are present. HEP-SELECT-005 Selecting a participant renders a per-measure summary table with Measure | N | Min | Median | Max of the raw (unstandardized) results for each present liver measure. HEP-SELECT-006 Changing Display Type while a participant is selected re-renders every coordinated panel (overlay, detail chart, summary table, listing) in the new units without losing the selection. | — | #43 |
 |
HEP-ANIM-001/003/006/007 HEP-ANIM-001 A study-day playback bar sits beneath the scatter — a play/stop button, a day slider annotated with the first and last study day in the data, a day readout, and a reset back to the peak view. It is drawn only when the records carry more than one distinct study day; undated data gets a stated reason instead of a dead control. HEP-ANIM-003 At any shown day each point sits on that participant's most recent result at or before it — holding at their first result before they are measured at all — a point outside its own measured span is drawn at half size, and a point whose participant has not yet been recorded is not drawn. HEP-ANIM-006 While the animation is playing, the quadrant corner labels and the summary table are suppressed: their percents describe the peak-vs-peak classification, which is not what the moving cloud shows. HEP-ANIM-007 A reset returns the scatter to the static peak-vs-peak reduction every other control describes, clearing the shown day and the trails with it. | — | #46 |
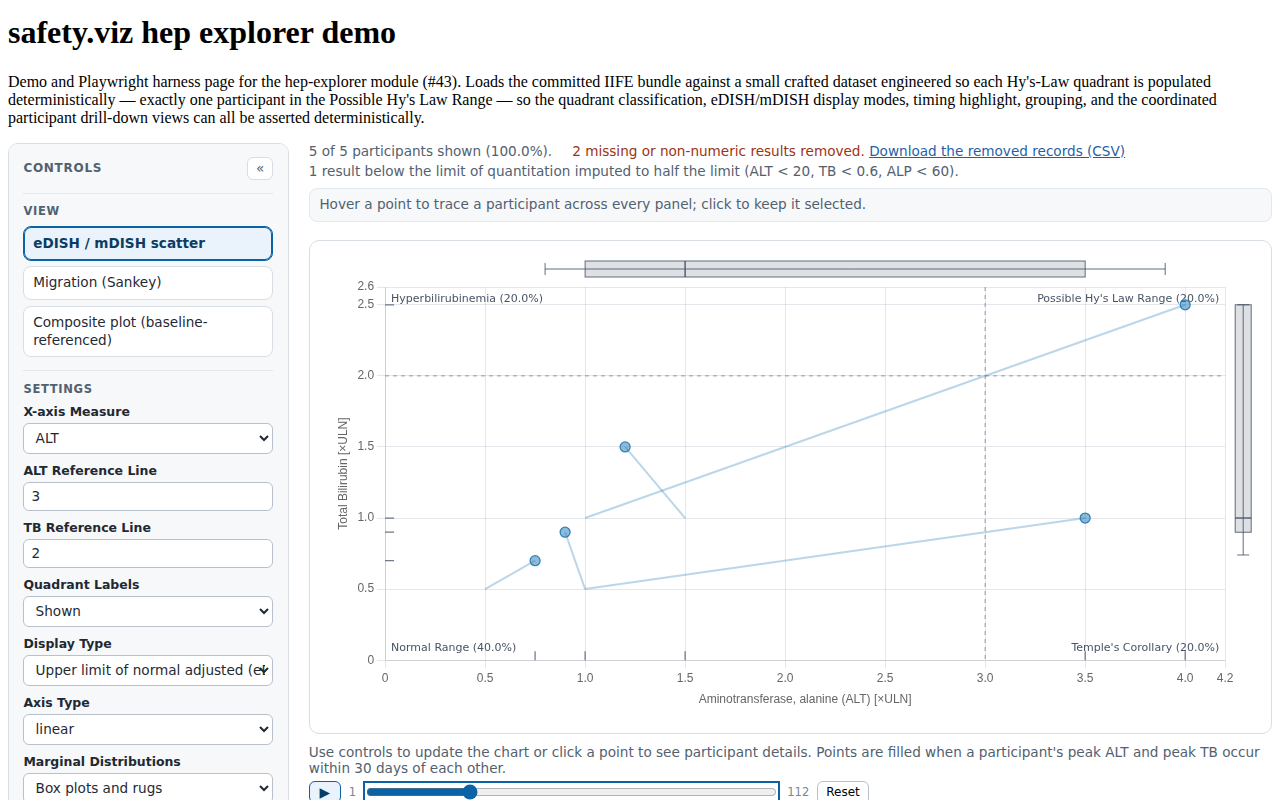 |
HEP-ANIM-004/005/008 HEP-ANIM-004 Each point that moves between two frames leaves a motion trail from where it was to where it now is; a point that held still leaves none, and the trails fade out over the following frames rather than accumulating. HEP-ANIM-005 A play-through runs at 100ms per remaining study day, capped at 30 seconds, and stops on the stop button, at the end of the range, on any control-driven redraw, and on destroy — so a running animation can never write into a destroyed chart. HEP-ANIM-008 Scrubbing the slider stops a running play-through rather than fighting it for the day. | — | #46 |
|
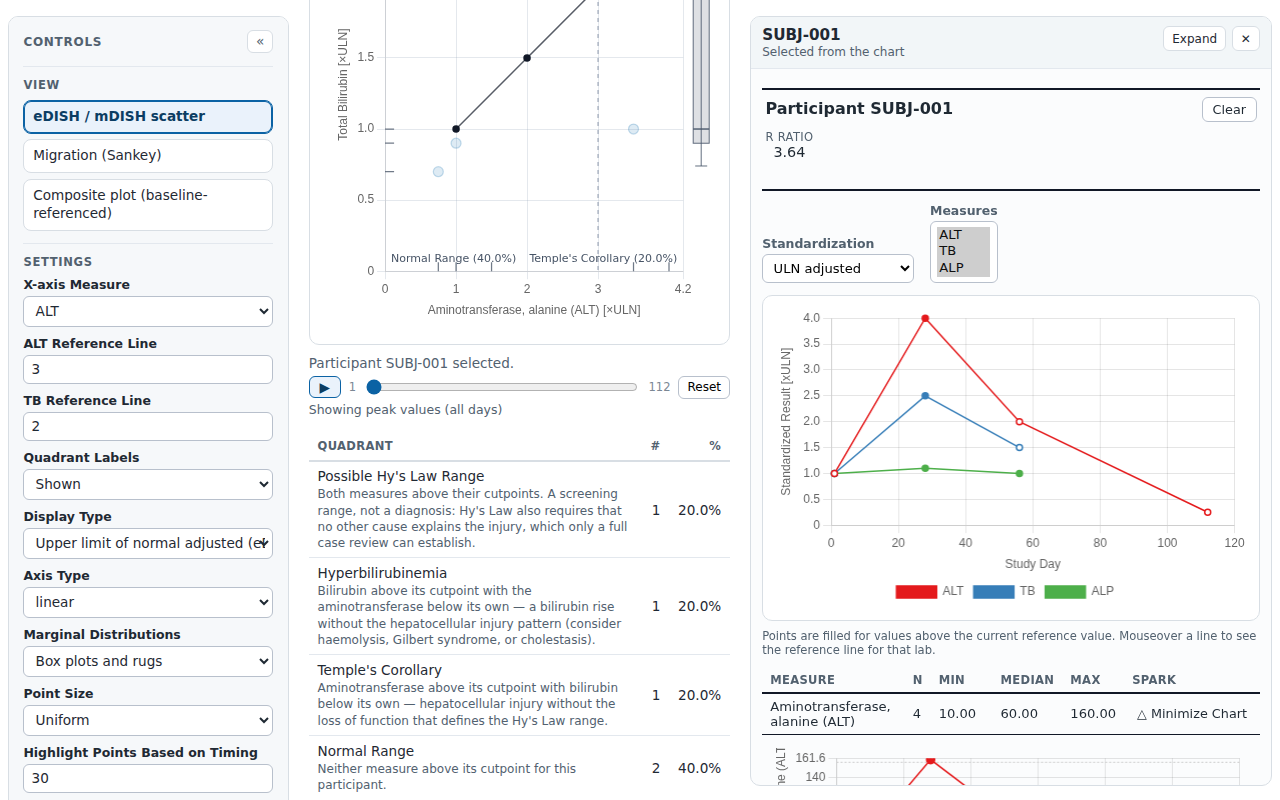
HEP-SELECT-008 HEP-SELECT-008 Each row of the selected participant's measure summary table draws a sparkline of that measure over study day, and the sparkline expands into a full drill-down chart beneath its row, collapsing again on a second activation. | — | #48 |
 |
HEP-PALT-001/003 HEP-PALT-001 An opt-in HEP-PALT-003 Activating the P_ALT figure in the participant profile shows the arithmetic that produced it — the AUC, the peak, and the result — the unit assumption it rests on, the standing not-validated-for-clinical-use caution, and a link to the source paper. | — | #49 |
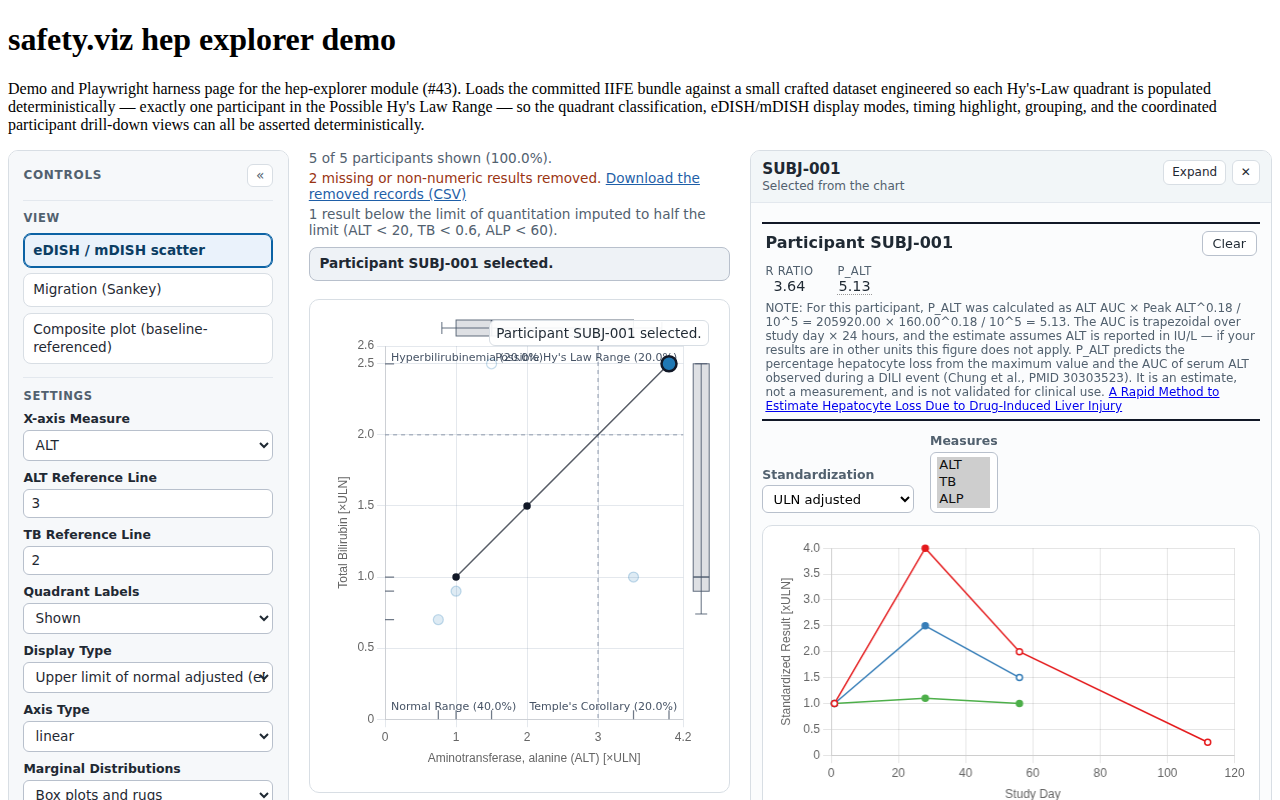 |
HEP-SELECT-002 HEP-SELECT-002 Selecting a participant opens the docked participant profile's 'Standardized Lab Values by Study Day' spaghetti — one day-ordered line per present liver measure in the active display units — and re-selecting destroys the prior profile charts before drawing the new ones so no Chart.js instance leaks (sv#98: the bespoke drawDetail chart is deleted; the dock delivers this requirement). | — | #43 |
|
HEP-SELECT-007 HEP-SELECT-007 Clicking the scatter background (no point hit) clears the selection, erasing the visit-path overlay, detail panels, and linked listing. | — | #43 |
|
HEP-SELECT-006 HEP-SELECT-006 Changing Display Type while a participant is selected re-renders every coordinated panel (overlay, detail chart, summary table, listing) in the new units without losing the selection. | — | #43 |
|
HEP-CTRL-009 HEP-CTRL-009 A Group color-by select (always offering a leading 'None' option) colors the points by the chosen column and renders a legend; the control is dropped when only None is available. | — | #43 |
|
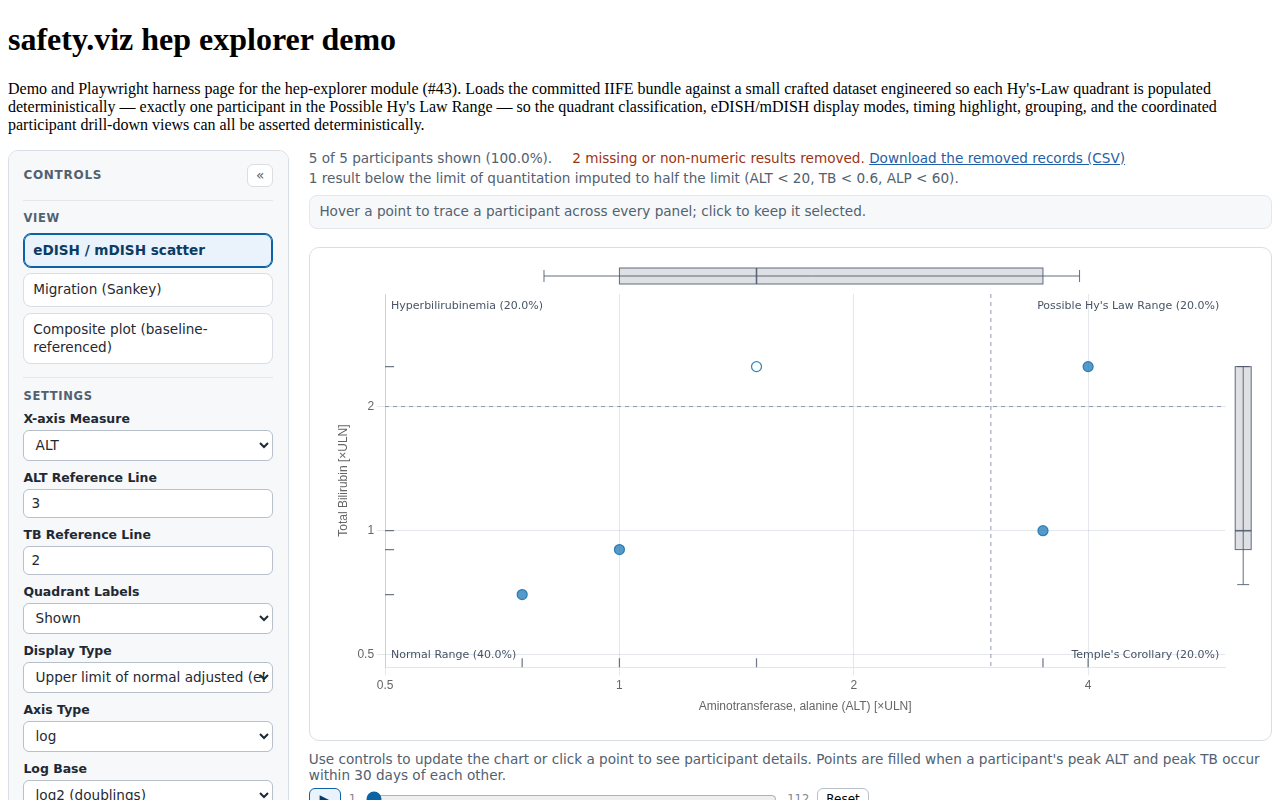
HEP-CTRL-006, HEP-CHART-003 HEP-CTRL-006 An Axis Type select toggles both scatter axes between linear and log. HEP-CHART-003 The axis domains toggle between linear and logarithmic scaling and always widen to keep the Hy's-Law cutpoint in view, with a log axis running from the smallest positive value (never 0). | — | #43 |
|
HEP-CTRL-017 HEP-CTRL-017 A Log Base control chooses the multiples the logarithmic gridlines land on — | — | #54 |
 |
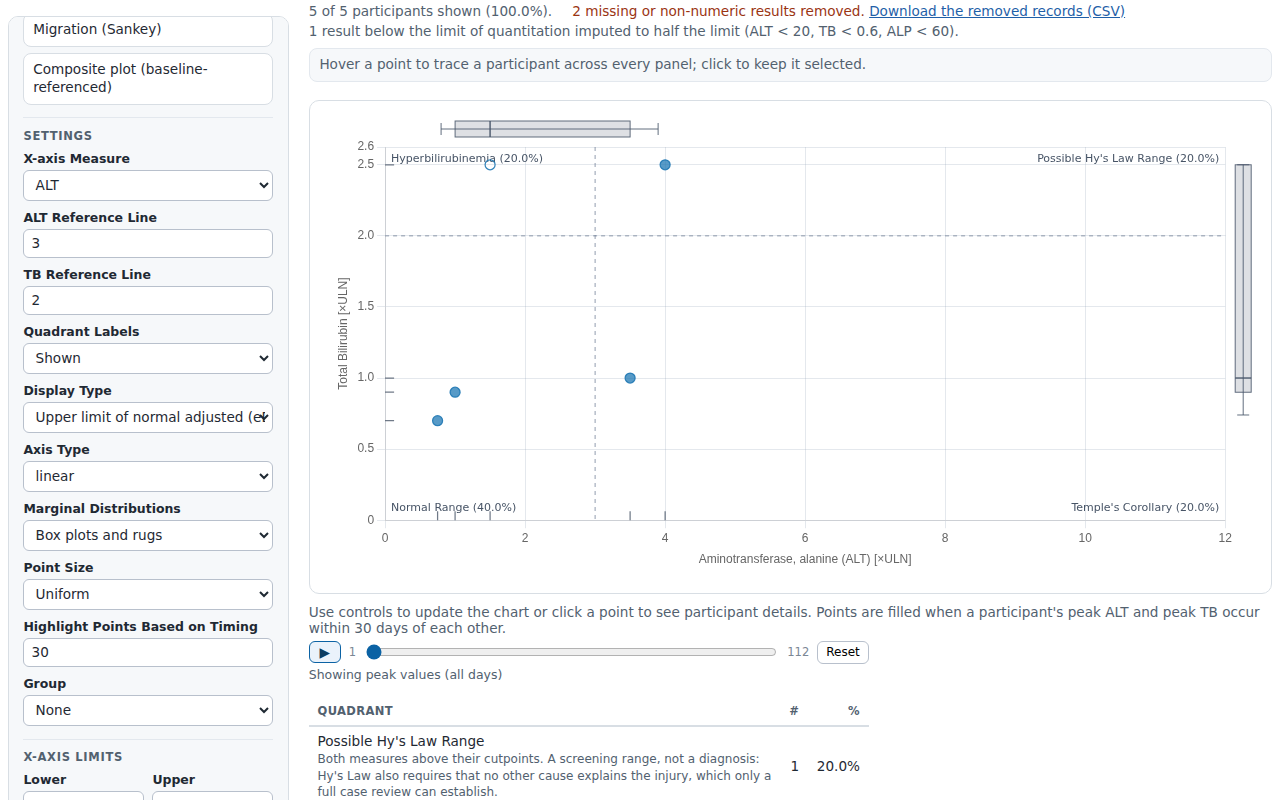
HEP-AXIS-001/002/003/004 HEP-AXIS-001 Each axis carries Lower and Upper number inputs that display the limit currently in force — the derived eDISH domain by default, or the user's override — and are refilled from the domain every render. Neither box is ever blank. HEP-AXIS-002 Displaying a limit does not pin it. An unedited limit stays automatic and is re-derived on every render — following the data as filters, cutpoints and the axis type change — while an edited one persists as an override. Changing either axis measure or the Display Type returns BOTH axes to automatic, since a limit typed for one measure (or one standardization) says nothing about another. HEP-AXIS-003 Each axis has its own Reset Limits control, clearing that axis's overrides and repopulating its inputs with the derived limits. Resetting one axis leaves the other's override in force. HEP-AXIS-004 An override cannot draw a domain the chart should not show: a limit typed across the other limit AS DISPLAYED is swapped rather than inverted, an empty or non-numeric entry returns that limit to automatic, a non-positive lower bound is refused on a logarithmic axis, and an inverted pair reaching the domain resolver falls back to the derived domain. | — | #54 |
 |
HEP-CHART-004 HEP-CHART-004 A point's tooltip lists the participant id, R Ratio, each axis measure's standardized peak value with its study day, and the day difference between the two peaks. | — | #43 |
|
HEP-API-003 HEP-API-003 A | — | #43 |
|
HEP-API-001 HEP-API-001 The public safety.viz collection exposes a | — | #43 |
|
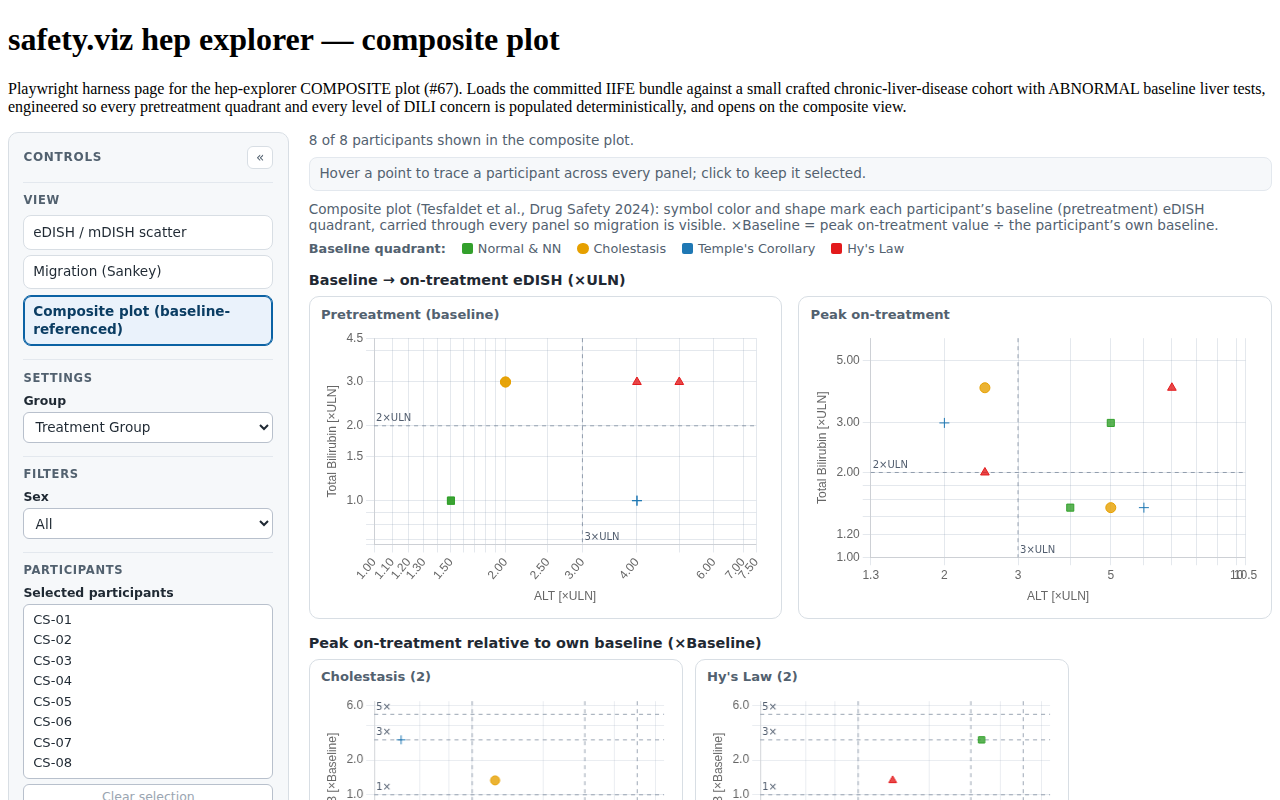
HEP-COMP-006 HEP-COMP-006 The renderer opens on the composite view with a reduced control set, a View control toggles between the composite and scatter views, subjects lacking an on-treatment ALT/BILI peak are excluded, and the view degrades gracefully when baseline or on-treatment values are absent. | — | #67 |
|
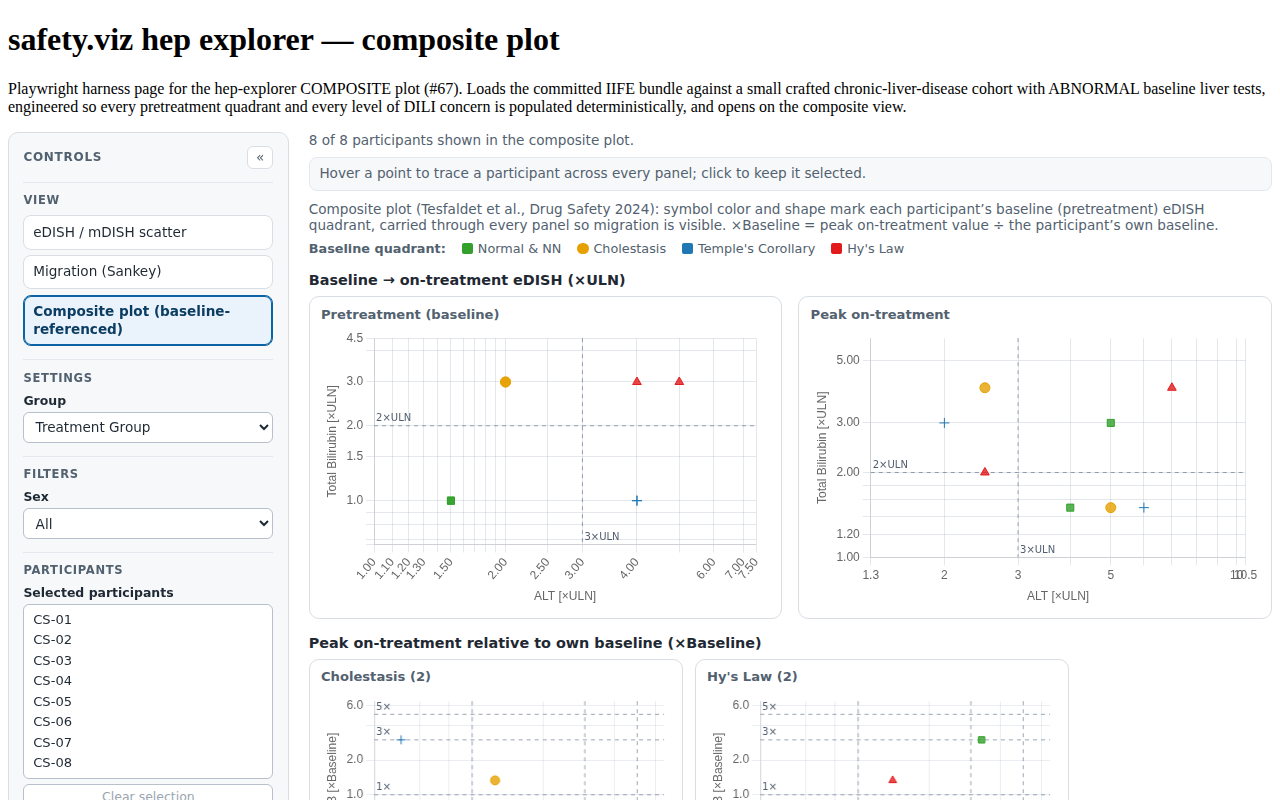
HEP-COMP-001/002/003 HEP-COMP-001 Each subject is classified into one of four Hy's-Law quadrants — Normal & NN, Cholestasis, Temple's Corollary, Hy's Law (in the FDA reference's factor order) — by the strict cutpoints ALT > 3×ULN and TB > 2×ULN (the threshold value itself falls on the Normal side, per R HEP-COMP-002 The on-treatment peak is the maximum over ON-TREATMENT records only (FDA AVISITN > 0), taken independently per analyte, so baseline, screening (negative study-day), and duplicate day-0 records are excluded; an on-treatment value exactly at a cutpoint (e.g. BILI 2×ULN) is not elevated (strict >). HEP-COMP-003 Each subject's ×Baseline (×BLN) value is the peak on-treatment value divided by that subject's own baseline value, and the peak ×ULN and peak ×BLN are independent maxima (ULN can vary across records); these feed the four-panel ×Baseline shift plot. | — | #67 |
 |
HEP-COMP-004/005 HEP-COMP-004 A migration table counts pretreatment × on-treatment quadrant migrations (with row totals, column totals, and grand total) and colors each cell by the FDA 4×4 DILI-concern matrix — red (migration of concern / worsening), yellow (potential concern / lateral single-analyte), green (no concern / potential benefit / improvement toward Normal), gray (no migration, the diagonal): 5 red, 2 yellow, 5 green, 4 gray. HEP-COMP-005 A by-arm summary buckets each subject's migration by concern color per treatment arm (using the group/arm meta carried on each subject), collapsing to a single "all subjects" row when no arm column is present. | — | #67 |
 |
HEP-COMP-006 HEP-COMP-006 The renderer opens on the composite view with a reduced control set, a View control toggles between the composite and scatter views, subjects lacking an on-treatment ALT/BILI peak are excluded, and the view degrades gracefully when baseline or on-treatment values are absent. | — | #67 |
|
HEP-COMP-006 HEP-COMP-006 The renderer opens on the composite view with a reduced control set, a View control toggles between the composite and scatter views, subjects lacking an on-treatment ALT/BILI peak are excluded, and the view degrades gracefully when baseline or on-treatment values are absent. | — | #67 |
|
HEP-COMP-007 HEP-COMP-007 Hovering or clicking a point traces and multi-selects that participant across every composite panel (each panel carries an id header for the cross-linking). | — | #67 |
 |
HEP-COMP-008 HEP-COMP-008 The composite view's migration table and its by-arm summary each sit in a box of their own that scrolls sideways by itself when the table is wider than the space it has, as at a 390-pixel viewport, so every column can be reached and the page stays as wide as the viewport. The tables' content does not change, and nothing changes where there is room. | HEP-COMP-008 | #285 |
|
HEP-MIG-001, HEP-MIG-014 HEP-MIG-001 The migration view renders three node columns, with each participant's pretreatment (baseline) categorization in the centre column and their maximum on-treatment categorization in one of the two flanking columns. HEP-MIG-014 The migration view renders both an svg plot and at least one table inside the main column. | — | #92 |
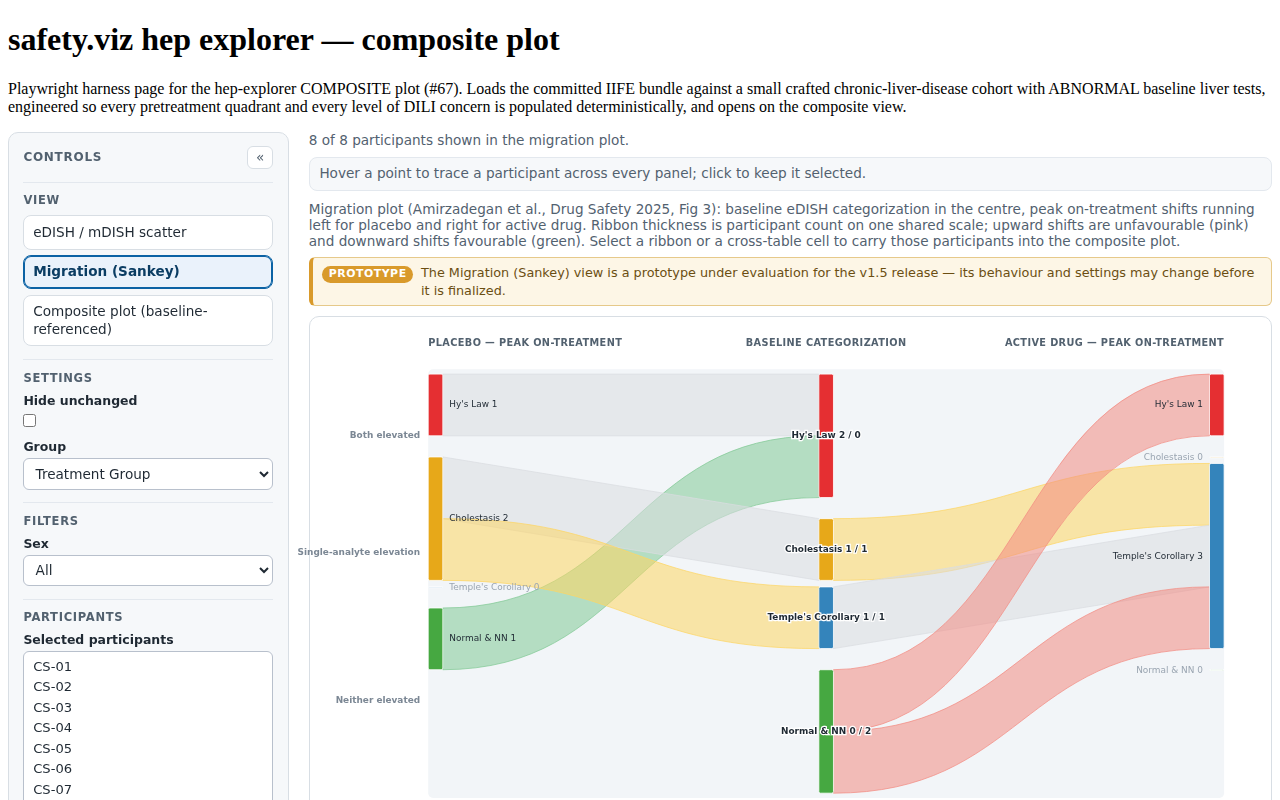 |
HEP-MIG-002/003/010/015 HEP-MIG-002 Placebo-arm ribbons extend leftward from the centre column and active-arm ribbons extend rightward, so the two arms read as mirror images about the shared baseline spine. HEP-MIG-003 Within every column the quadrant nodes are stacked in severity order from top to bottom — Hy's Law highest and Normal & NN lowest — so vertical position carries the same meaning in all three columns. HEP-MIG-010 Node fill colours are taken from QUADRANT_STYLE, so a quadrant is drawn in the same colour in the migration view as in the composite view. HEP-MIG-015 The computed node and ribbon geometry, together with the shared pixels-per-participant scale, is exposed on the root element as $hepSankey. | — | #92 |
|
HEP-ACC-001/002/003 HEP-ACC-001 Every ribbon is focusable, carries role="button", and has an accessible name stating the participant count, both quadrants, the arm and the concern direction. HEP-ACC-002 A focused ribbon is activated by both Enter and Space, producing the same participant selection as a pointer click. HEP-ACC-003 The Sankey svg carries role="img" and an accessible name summarising the unfavourable and favourable shift counts for each arm. | — | #92 |
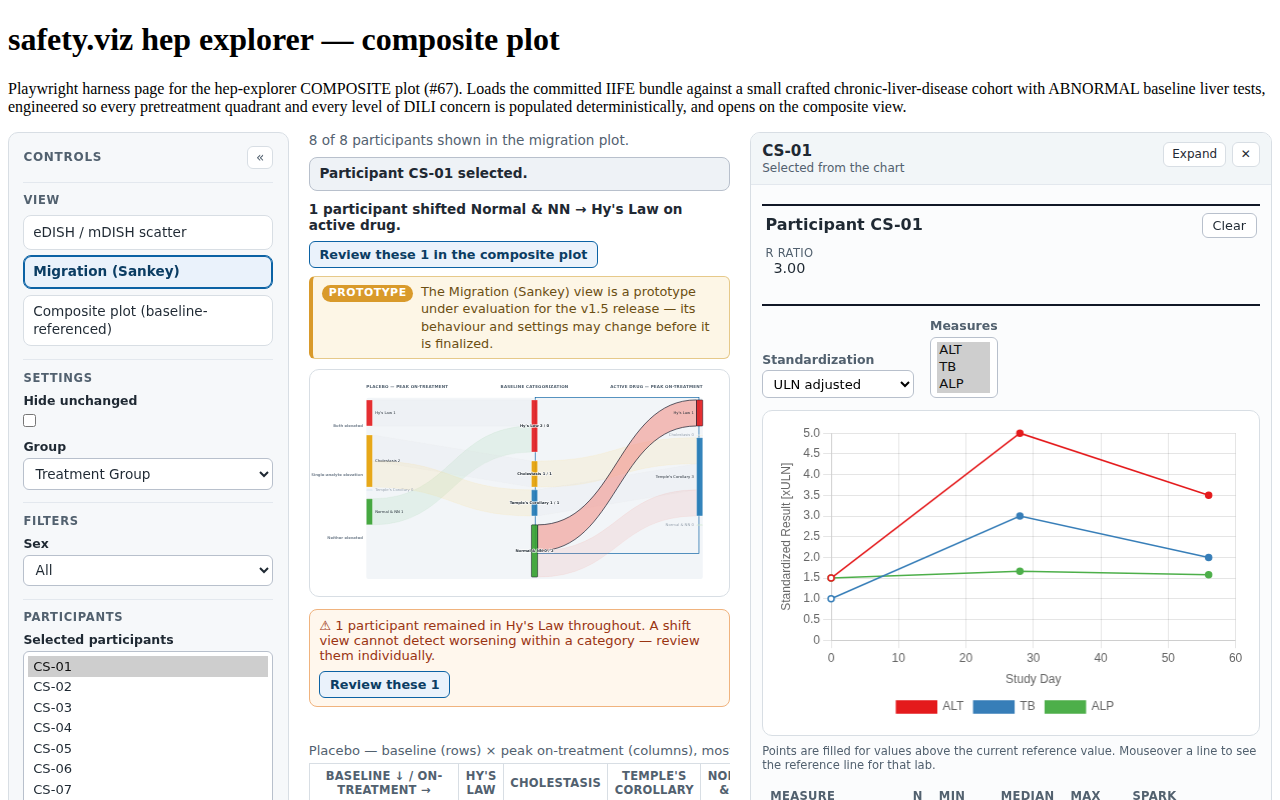 |
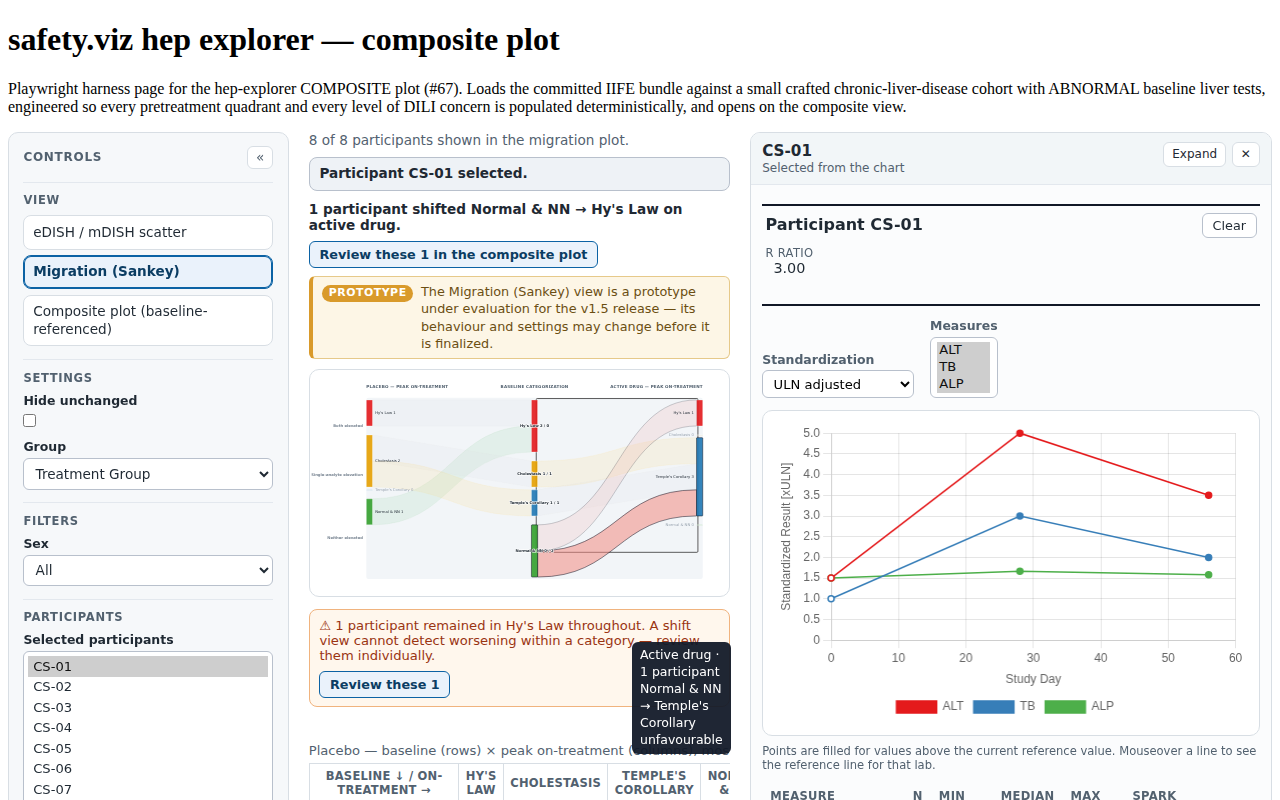
HEP-STEP-001/002/003 HEP-STEP-001 Clicking a ribbon populates the Participants control with that flow's participants and dispatches a participantsSelected event carrying exactly their identifiers. HEP-STEP-002 With a flow selected, the footnote states the shift, the arm it belongs to and its participant count, and offers a control to review those participants in the composite plot. HEP-STEP-003 Activating that control switches to the composite view with exactly those participants restored as the selection and highlighted in the ×Baseline panels. | — | #92 |
 |
HEP-MIG-007 HEP-MIG-007 Ribbon thickness is proportional to participant count on the same pixels-per-participant scale as node heights, and ribbons are painted thickest first so a thin ribbon is never occluded by, and stays clickable over, a thicker one. | — | #92 |
|
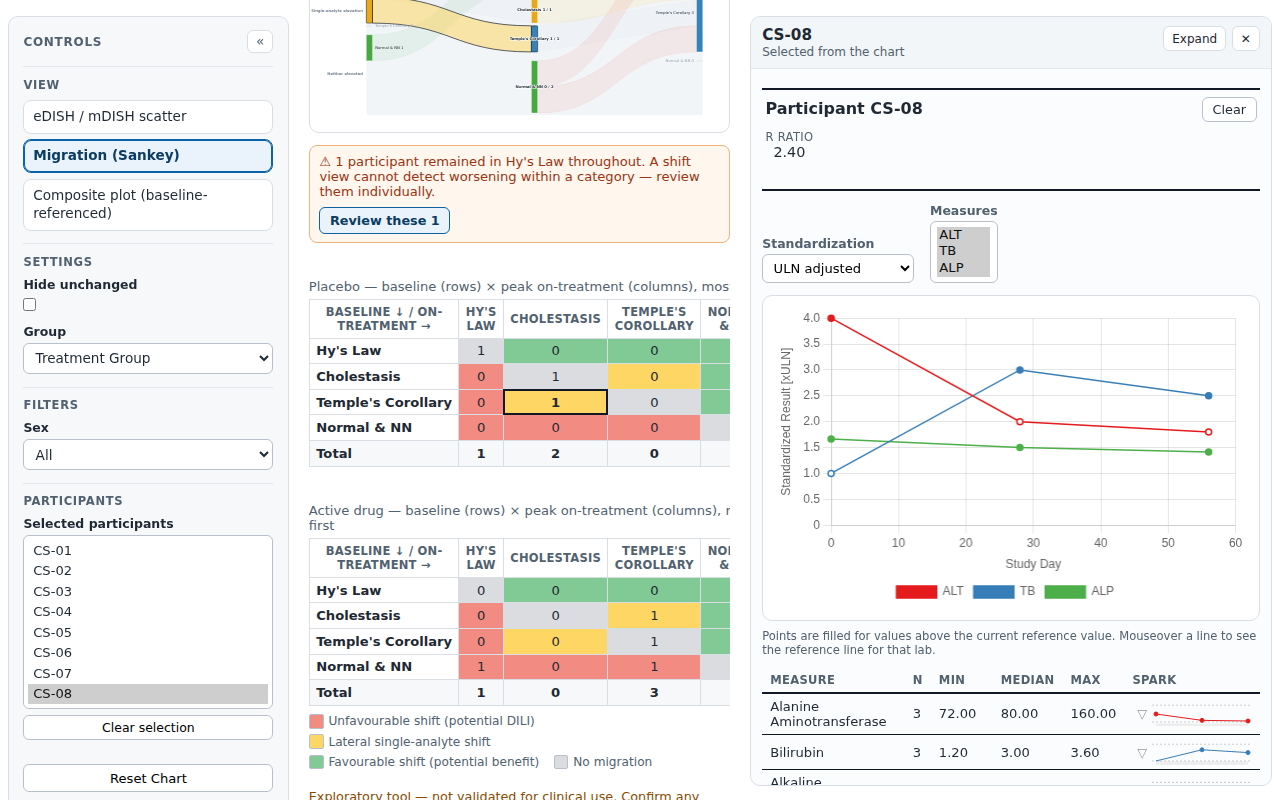
HEP-XTAB-001/002/004/005 HEP-XTAB-001 One cross table is rendered per designated arm, with rows for the baseline quadrant and columns for the on-treatment quadrant, both ordered by severity so the tables read in the same direction as the plot. HEP-XTAB-002 Each cross table carries a total column, a total row, and a grand total. HEP-XTAB-004 Every cross-table cell count equals the participant count of the ribbon with the same arm, baseline quadrant and on-treatment quadrant. HEP-XTAB-005 Clicking a cross-table cell produces exactly the same participant selection as clicking its corresponding ribbon. | — | #92 |
 |
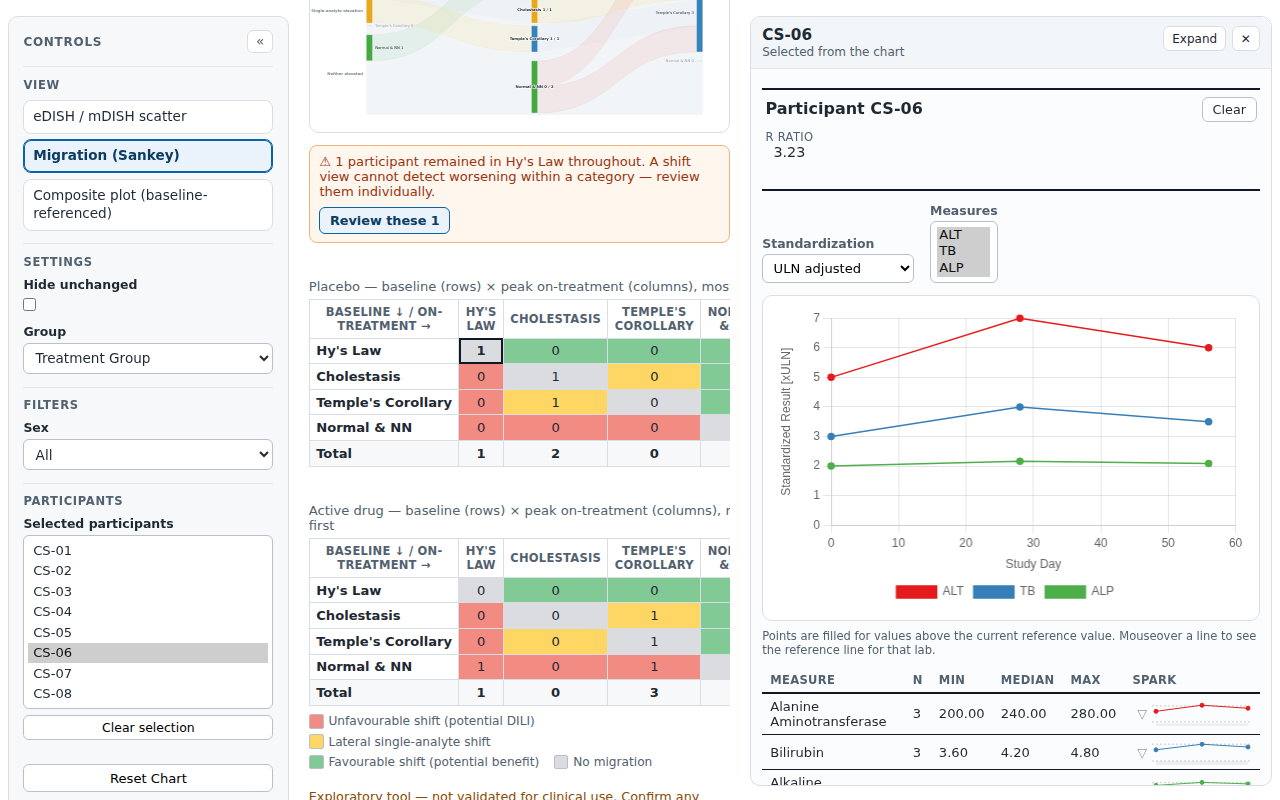
HEP-STEP-005 HEP-STEP-005 When the Hy's Law to Hy's Law cell is non-empty, the view renders a caution note reporting the count, stating that a shift view cannot detect worsening within a category, and offering to select those participants for individual review. | — | #92 |
 |
HEP-MIG-013 HEP-MIG-013 A Hide unchanged control removes the diagonal ribbons from the plot and reports the number of participants they represent in the notes, leaving the cross tables unchanged. | — | #92 |
|
HEP-STEP-004 HEP-STEP-004 A participant selection made in any of the three views survives a switch to either of the other two, for every ordered pair of views. | — | #92 |
|
HEP-ARM-004/005, HEP-DATA-012 HEP-ARM-004 Participants whose arm is designated neither placebo nor active are excluded from the migration view and their count is reported in the notes. HEP-ARM-005 When fewer than two arms resolve to opposite sides, the Sankey renders unidirectionally with a warning note rather than throwing. HEP-DATA-012 The migration view reports the count of participants excluded for lacking a usable baseline or a usable on-treatment measurement, separately from the count excluded for an undesignated arm. | — | #92 |
|
HEP-ARM-005 HEP-ARM-005 When fewer than two arms resolve to opposite sides, the Sankey renders unidirectionally with a warning note rather than throwing. | — | #92 |
|
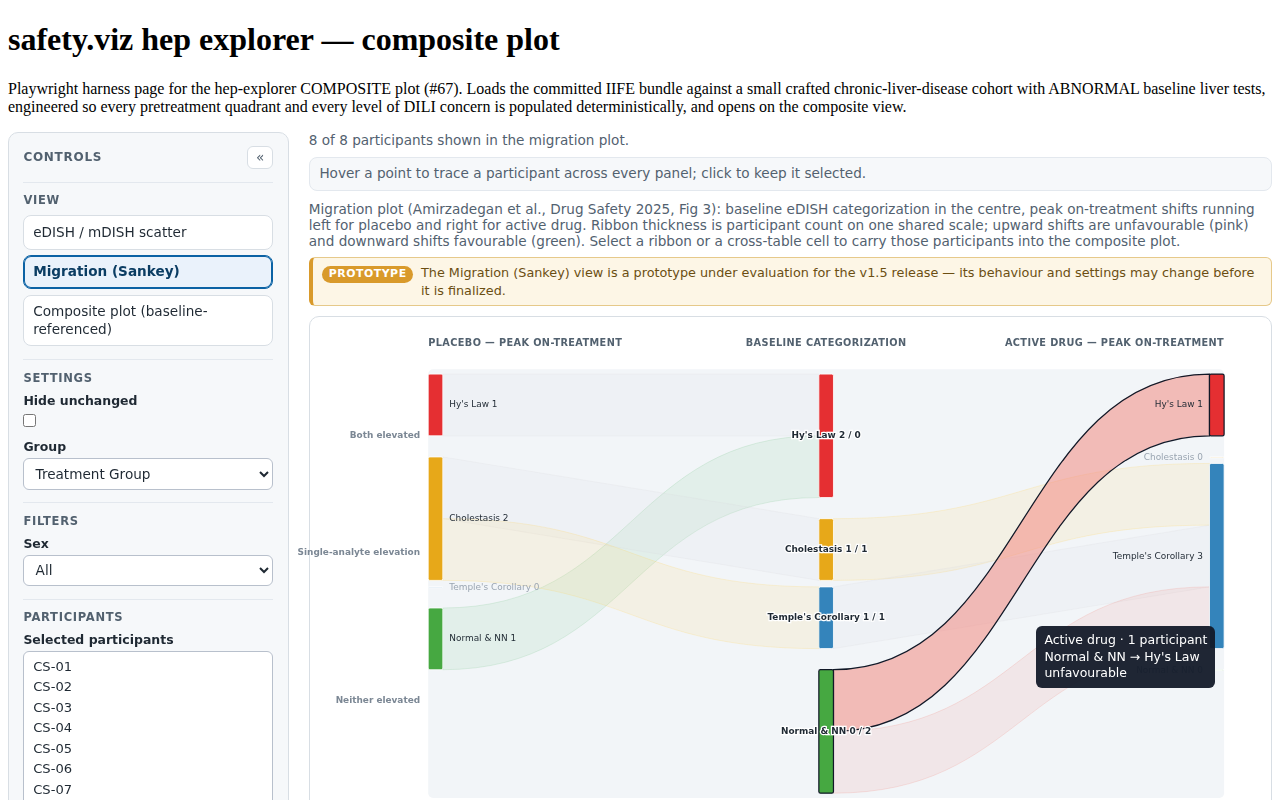
HEP-MIG-017 HEP-MIG-017 Hovering a ribbon highlights that ribbon and both of its endpoint nodes and opens a positioned HTML tooltip stating the flow's participant count, its two quadrants and its arm; the tooltip is an HTML element rather than an SVG title so it appears in evidence screenshots. | — | #92 |
 |
HEP-ARM-007 HEP-ARM-007 Arm designation scopes the migration view's cohort only; the scatter and composite views continue to plot the full cohort regardless of which arms are designated. | — | #92 |
|
HEP-CTRL-019 (Reset Chart) HEP-CTRL-019 A Reset Chart control restores the cutpoints, the display mode, the axis type and log base, both axis-limit overrides, the point sizing, the visit window, the filters, the R-Ratio range, the migration diagonal, the active arms and the unscheduled-visit choice to their configured defaults, and re-derives the row set. It is deliberately a PARTIAL reset: the chosen view, the two plotted measures, the grouping, the marginals, the quadrant labels, the animation and the current selection are preserved, because a reader who has navigated to a view and a measure pair expects Reset to restore the controls, not to undo the navigation. This differs from the whole-chart Reset the other renderers ship. | HEP-CTRL-019 | #136 |
|
Unit evidence (Vitest — tests/unit/hep-explorer/)
26 requirement rows · 215 tests
| Requirement | Source matrix rows | Issue | Tests & evidence |
|---|---|---|---|
HEP-CTRL-001/002/006/007/008/009/010/011 (defaults, control specs) HEP-CTRL-001 An X-axis Measure select offers the configured x_options and plots x_default (ALT) on first render. HEP-CTRL-002 A Y-axis Measure select is rendered only when y_options has more than one entry; a single option (TB) drops the control. HEP-CTRL-006 An Axis Type select toggles both scatter axes between linear and log. HEP-CTRL-007 A Point Size select offers Uniform and rRatio, sizing points either at a uniform radius or scaled by the participant R-Ratio. HEP-CTRL-008 A timing-window number input ('Highlight Points Based on Timing') sets the day threshold (default 30) that decides filled vs hollow points. HEP-CTRL-009 A Group color-by select (always offering a leading 'None' option) colors the points by the chosen column and renders a legend; the control is dropped when only None is available. HEP-CTRL-010 An R-Ratio range filter (min/max number inputs plus a reset) filters participants by R-Ratio, seeding a null max from the largest finite participant R-Ratio in the data. HEP-CTRL-011 Categorical data-filter selects narrow the shown participants; filters whose column is absent from the data are dropped with a console warning. | — | #43 |
|
HEP-QUAD-001, HEP-DATA-001/002, HEP-DISPLAY-001, HEP-SELECT-006 (cuts back-fill, mappings) HEP-QUAD-001 Default Hy's-Law cutpoints reproduce the original renderer (TB 2×ULN / 4.8×Baseline, ALP 1×ULN / 3.8×Baseline, rRatio 5/5, and a HEP-DATA-001 Input data is long-format — one record per participant per measure per visit/day — and the module reduces it to a single plotted point per participant (settings.id_col). HEP-DATA-002 The liver measures (ALT/AST/TB/ALP) are matched from each row's measure_col value against the full TEST strings mapped by settings.measure_values. HEP-DISPLAY-001 The Display Type control switches the active standardization between 'Upper limit of normal adjusted (eDISH)' (÷ULN, ×ULN) and 'Baseline adjusted (mDISH)' (÷baseline, ×Baseline), re-deriving every displayed value; in mDISH the ×Baseline denominator for a participant×measure group is the study-day-0 record, else the earliest day (or the first input-order record when no day column is present). HEP-SELECT-006 Changing Display Type while a participant is selected re-renders every coordinated panel (overlay, detail chart, summary table, listing) in the new units without losing the selection. | — | #43 |
|
HEP-DATA-005 (schema required columns) HEP-DATA-005 checkInputs validates the schema's required column settings (id_col, measure_col, value_col, normal_col_high) against the remapped names and throws a single Error naming every missing variable. | — | #43 |
|
HEP-DATA-002/003/004 (measure resolution, cleaning) HEP-DATA-002 The liver measures (ALT/AST/TB/ALP) are matched from each row's measure_col value against the full TEST strings mapped by settings.measure_values. HEP-DATA-003 cleanData removes rows whose result is blank or non-numeric, or whose ULN is non-numeric or ≤ 0, returns the count of removed records, and that count is surfaced on-page as a warning note reading "N missing or non-numeric results removed." HEP-DATA-004 When studyday_col is present each row's study day is parsed to numeric __hep_day (a blank or non-numeric study day becomes NaN, not coerced to 0); when no row carries a usable study day the timing test degrades gracefully — day_diff is NaN and points render filled (withinWindow true) rather than all-hollow. | — | #43 |
|
HEP-DISPLAY-001/002/003/004/007 (×ULN, ×Baseline, peaks, R-Ratio) HEP-DISPLAY-001 The Display Type control switches the active standardization between 'Upper limit of normal adjusted (eDISH)' (÷ULN, ×ULN) and 'Baseline adjusted (mDISH)' (÷baseline, ×Baseline), re-deriving every displayed value; in mDISH the ×Baseline denominator for a participant×measure group is the study-day-0 record, else the earliest day (or the first input-order record when no day column is present). HEP-DISPLAY-002 The ×ULN (eDISH) standardization divides each result by its upper-limit-of-normal value (normal_col_high, default STNRHI). HEP-DISPLAY-003 The explorer standardizes and can plot exactly four liver measures — ALT, AST, TB, ALP — resolved from the measure column via the measure_values map, and reduces each participant to one peak record per measure (the record with the maximum value in the active display units, ×ULN or ×Baseline). HEP-DISPLAY-004 A participant with a missing or zero baseline is dropped from the mDISH scatter (its ×Baseline is NaN) and counted toward the removed-participants note. HEP-DISPLAY-007 The participant R-Ratio is the peak ALT ×ULN divided by the peak ALP ×ULN, always computed on the ULN scale regardless of display mode and NaN when either peak is missing or ALP's peak ≤ 0. | — | #43 |
|
HEP-DISPLAY-006 (display availability) HEP-DISPLAY-006 The Display Type control offers only the modes the loaded data can be plotted in: the baseline-adjusted (mDISH) mode is withdrawn when no participant has a derivable baseline, the reference-range-adjusted (eDISH) mode when no record carries a usable upper limit of normal, and the reason is stated on the page. A state already pointing at a withdrawn mode falls back to a supported one, and a dataset supporting neither renders the reason instead of an empty plot. | — | #55 |
|
HEP-CHART-001, HEP-CTRL-008/009/011 (points, timing, group, filters) HEP-CHART-001 The eDISH scatter reduces the cleaned data to exactly one point per participant, plotting that participant's peak X-measure value against their peak Y-measure value in the active display units. HEP-CTRL-008 A timing-window number input ('Highlight Points Based on Timing') sets the day threshold (default 30) that decides filled vs hollow points. HEP-CTRL-009 A Group color-by select (always offering a leading 'None' option) colors the points by the chosen column and renders a legend; the control is dropped when only None is available. HEP-CTRL-011 Categorical data-filter selects narrow the shown participants; filters whose column is absent from the data are dropped with a console warning. | — | #43 |
|
HEP-QUAD-004 (quadrant classification counts/percents) HEP-QUAD-004 classifyQuadrants buckets each shown point into a quadrant by xCat = x ≥ xCut ? High : Normal (likewise y), so a point exactly on a cutpoint counts as High, and returns per-position counts and percent-of-shown-points (zero percents for empty data). | — | #43 |
|
HEP-QUAD-006 (which cut-line the pointer holds, what a drag to a pixel means) HEP-QUAD-006 Either cut-line can be moved by dragging it on the plot as well as by typing in its Reference Line input: the pointer takes hold of whichever line it is nearest (never both at once), the line follows the pointer clamped inside the axis, and the quadrant counts, corner percents and summary table reclassify continuously during the drag rather than on release. The drag writes its value into that axis's Reference Line input, and a drag is not also a click on the plot background, so an open selection survives it. | — | #45 |
|
HEP-ANIM-001..005 (day range, frames, position at a day, trails, duration) HEP-ANIM-001 A study-day playback bar sits beneath the scatter — a play/stop button, a day slider annotated with the first and last study day in the data, a day readout, and a reset back to the peak view. It is drawn only when the records carry more than one distinct study day; undated data gets a stated reason instead of a dead control. HEP-ANIM-002 Playback frames are built for the SHOWN participants, in the same order as the plotted points, each carrying its day-ordered X- and Y-measure series in the active display units plus that participant's own first/last record day. A participant with no usable value on either plotted measure is left out, exactly as the static scatter drops them. HEP-ANIM-003 At any shown day each point sits on that participant's most recent result at or before it — holding at their first result before they are measured at all — a point outside its own measured span is drawn at half size, and a point whose participant has not yet been recorded is not drawn. HEP-ANIM-004 Each point that moves between two frames leaves a motion trail from where it was to where it now is; a point that held still leaves none, and the trails fade out over the following frames rather than accumulating. HEP-ANIM-005 A play-through runs at 100ms per remaining study day, capped at 30 seconds, and stops on the stop button, at the end of the range, on any control-driven redraw, and on destroy — so a running animation can never write into a destroyed chart. | — | #46 |
|
HEP-PALT-001/002/003 (AUC × peak^0.18 / 1e5, when it declines, the shown note) HEP-PALT-001 An opt-in HEP-PALT-002 The estimate declines to answer — no figure at all — when the participant has fewer than two dated ALT results or every dated result falls on one study day: an AUC needs an interval, and inventing one would turn "not estimable" into a number a reader would act on. HEP-PALT-003 Activating the P_ALT figure in the participant profile shows the arithmetic that produced it — the AUC, the peak, and the result — the unit assumption it rests on, the standing not-validated-for-clinical-use caution, and a link to the source paper. | — | #49 |
|
HEP-SELECT-002/003/005 (drill-down series) HEP-SELECT-002 Selecting a participant opens the docked participant profile's 'Standardized Lab Values by Study Day' spaghetti — one day-ordered line per present liver measure in the active display units — and re-selecting destroys the prior profile charts before drawing the new ones so no Chart.js instance leaks (sv#98: the bespoke drawDetail chart is deleted; the dock delivers this requirement). HEP-SELECT-003 Selecting a participant draws a visit-path trajectory overlay pairing X/Y standardized values by shared visit (else study day, else sequence) in chronological order, only where both measures are present. HEP-SELECT-005 Selecting a participant renders a per-measure summary table with Measure | N | Min | Median | Max of the raw (unstandardized) results for each present liver measure. | — | #43 |
|
HEP-CHART-002/003/004, HEP-CTRL-006, HEP-DISPLAY-001 (domains, log, labels) HEP-CHART-002 Each axis is titled with the selected measure's full label plus a standardization suffix ([×ULN] for eDISH, [×Baseline] for mDISH). HEP-CHART-003 The axis domains toggle between linear and logarithmic scaling and always widen to keep the Hy's-Law cutpoint in view, with a log axis running from the smallest positive value (never 0). HEP-CHART-004 A point's tooltip lists the participant id, R Ratio, each axis measure's standardized peak value with its study day, and the day difference between the two peaks. HEP-CTRL-006 An Axis Type select toggles both scatter axes between linear and log. HEP-DISPLAY-001 The Display Type control switches the active standardization between 'Upper limit of normal adjusted (eDISH)' (÷ULN, ×ULN) and 'Baseline adjusted (mDISH)' (÷baseline, ×Baseline), re-deriving every displayed value; in mDISH the ×Baseline denominator for a participant×measure group is the study-day-0 record, else the earliest day (or the first input-order record when no day column is present). | — | #43 |
|
HEP-CTRL-017, HEP-AXIS-004 (log-base gridlines; limit overrides a chart may not draw) HEP-CTRL-017 A Log Base control chooses the multiples the logarithmic gridlines land on — HEP-AXIS-004 An override cannot draw a domain the chart should not show: a limit typed across the other limit AS DISPLAYED is swapped rather than inverted, an empty or non-numeric entry returns that limit to automatic, a non-positive lower bound is refused on a logarithmic axis, and an inverted pair reaching the domain resolver falls back to the derived domain. | — | #54 |
|
HEP-CHART-004, HEP-CTRL-009, HEP-QUAD-002, HEP-SELECT-001 (tooltip, palette, plugin) HEP-CHART-004 A point's tooltip lists the participant id, R Ratio, each axis measure's standardized peak value with its study day, and the day difference between the two peaks. HEP-CTRL-009 A Group color-by select (always offering a leading 'None' option) colors the points by the chosen column and renders a legend; the control is dropped when only None is available. HEP-QUAD-002 Two dashed grey cut-lines at the X and Y cutpoints split the plot into the four named Hy's-Law quadrants — Possible Hy's Law Range (upper-right, High/High), Hyperbilirubinemia (upper-left, Normal/High), Temple's Corollary (lower-right, High/Normal), and Normal Range (lower-left, Normal/Normal). HEP-SELECT-001 Clicking a scatter point selects that participant and highlights it (selected point opaque, others dimmed). | — | #43 |
|
HEP-API-001 (module export) HEP-API-001 The public safety.viz collection exposes a | — | #43 |
|
HEP-COMP-001/002/003/004/005/006 (classification, migration, concern matrix, by-arm) HEP-COMP-001 Each subject is classified into one of four Hy's-Law quadrants — Normal & NN, Cholestasis, Temple's Corollary, Hy's Law (in the FDA reference's factor order) — by the strict cutpoints ALT > 3×ULN and TB > 2×ULN (the threshold value itself falls on the Normal side, per R HEP-COMP-002 The on-treatment peak is the maximum over ON-TREATMENT records only (FDA AVISITN > 0), taken independently per analyte, so baseline, screening (negative study-day), and duplicate day-0 records are excluded; an on-treatment value exactly at a cutpoint (e.g. BILI 2×ULN) is not elevated (strict >). HEP-COMP-003 Each subject's ×Baseline (×BLN) value is the peak on-treatment value divided by that subject's own baseline value, and the peak ×ULN and peak ×BLN are independent maxima (ULN can vary across records); these feed the four-panel ×Baseline shift plot. HEP-COMP-004 A migration table counts pretreatment × on-treatment quadrant migrations (with row totals, column totals, and grand total) and colors each cell by the FDA 4×4 DILI-concern matrix — red (migration of concern / worsening), yellow (potential concern / lateral single-analyte), green (no concern / potential benefit / improvement toward Normal), gray (no migration, the diagonal): 5 red, 2 yellow, 5 green, 4 gray. HEP-COMP-005 A by-arm summary buckets each subject's migration by concern color per treatment arm (using the group/arm meta carried on each subject), collapsing to a single "all subjects" row when no arm column is present. HEP-COMP-006 The renderer opens on the composite view with a reduced control set, a View control toggles between the composite and scatter views, subjects lacking an on-treatment ALT/BILI peak are excluded, and the view degrades gracefully when baseline or on-treatment values are absent. | — | #67 |
|
HEP-MIG-001..009, HEP-MIG-012/013/016 (Sankey geometry: stacking, shared scale, paths) HEP-MIG-001 The migration view renders three node columns, with each participant's pretreatment (baseline) categorization in the centre column and their maximum on-treatment categorization in one of the two flanking columns. HEP-MIG-002 Placebo-arm ribbons extend leftward from the centre column and active-arm ribbons extend rightward, so the two arms read as mirror images about the shared baseline spine. HEP-MIG-003 Within every column the quadrant nodes are stacked in severity order from top to bottom — Hy's Law highest and Normal & NN lowest — so vertical position carries the same meaning in all three columns. HEP-MIG-004 Cholestasis and Temple's Corollary occupy one shared severity tier, drawn as two adjacent sub-nodes beneath a single tier label, because the concern matrix declines to rank either above the other. HEP-MIG-005 Node height is proportional to the node's participant count on a single pixels-per-participant scale, and a quadrant with a zero count still renders as a one-pixel stub with a dimmed label so the four-row grid stays geometrically stable as filters change. HEP-MIG-006 A centre node's height is the larger of its two arms' baseline counts, and each face allocates only its own arm's count centred within that height, so a shortfall reads as symmetric padding on the face of the arm with fewer participants. HEP-MIG-007 Ribbon thickness is proportional to participant count on the same pixels-per-participant scale as node heights, and ribbons are painted thickest first so a thin ribbon is never occluded by, and stays clickable over, a thicker one. HEP-MIG-008 Ribbon fill colour is derived from concernOf applied to the baseline and on-treatment quadrant pair, and never from the vertical direction the ribbon happens to travel. HEP-MIG-009 Rendered ribbon geometry matches its concern class for every populated flow: a red ribbon ends strictly above where it starts, a green ribbon ends strictly below, and yellow and gray ribbons run horizontally. HEP-MIG-012 A diagonal flow, where the baseline and on-treatment quadrants are the same, renders as a straight horizontal band between the two vertically aligned tiers rather than as a loop. HEP-MIG-013 A Hide unchanged control removes the diagonal ribbons from the plot and reports the number of participants they represent in the notes, leaving the cross tables unchanged. HEP-MIG-016 Every rendered coordinate is rounded to an integer before serialisation, so two renders of the same cohort produce byte-identical path data. | — | #92 |
|
HEP-MIG-004/008/010/011/013/014/015 (painting, labels, hover, tooltip, geometry stash) HEP-MIG-004 Cholestasis and Temple's Corollary occupy one shared severity tier, drawn as two adjacent sub-nodes beneath a single tier label, because the concern matrix declines to rank either above the other. HEP-MIG-008 Ribbon fill colour is derived from concernOf applied to the baseline and on-treatment quadrant pair, and never from the vertical direction the ribbon happens to travel. HEP-MIG-010 Node fill colours are taken from QUADRANT_STYLE, so a quadrant is drawn in the same colour in the migration view as in the composite view. HEP-MIG-011 Each node label carries the quadrant name together with its participant count for each arm, so the counts can be read without measuring the geometry. HEP-MIG-013 A Hide unchanged control removes the diagonal ribbons from the plot and reports the number of participants they represent in the notes, leaving the cross tables unchanged. HEP-MIG-014 The migration view renders both an svg plot and at least one table inside the main column. HEP-MIG-015 The computed node and ribbon geometry, together with the shared pixels-per-participant scale, is exposed on the root element as $hepSankey. | — | #92 |
|
HEP-XTAB-001..006 (per-arm cross tables, shading, ribbon/cell parity, composite untouched) HEP-XTAB-001 One cross table is rendered per designated arm, with rows for the baseline quadrant and columns for the on-treatment quadrant, both ordered by severity so the tables read in the same direction as the plot. HEP-XTAB-002 Each cross table carries a total column, a total row, and a grand total. HEP-XTAB-003 Each cross-table cell is shaded by concernOf using the four-level CONCERN_COLORS, and a legend names the four concern levels. HEP-XTAB-004 Every cross-table cell count equals the participant count of the ribbon with the same arm, baseline quadrant and on-treatment quadrant. HEP-XTAB-005 Clicking a cross-table cell produces exactly the same participant selection as clicking its corresponding ribbon. HEP-XTAB-006 The composite view's existing pooled migration table keeps its existing content and ordering; the migration view's per-arm tables are additional and do not alter it. | — | #92 |
|
HEP-STEP-001/002/003/005 (selection, hand-off footnote, Hy's-Law caution) HEP-STEP-001 Clicking a ribbon populates the Participants control with that flow's participants and dispatches a participantsSelected event carrying exactly their identifiers. HEP-STEP-002 With a flow selected, the footnote states the shift, the arm it belongs to and its participant count, and offers a control to review those participants in the composite plot. HEP-STEP-003 Activating that control switches to the composite view with exactly those participants restored as the selection and highlighted in the ×Baseline panels. HEP-STEP-005 When the Hy's Law to Hy's Law cell is non-empty, the view renders a caution note reporting the count, stating that a shift view cannot detect worsening within a category, and offering to select those participants for individual review. | — | #92 |
|
HEP-ARM-003/004/005/006, HEP-DATA-012 (arm scoping, degradation, exclusion notes) HEP-ARM-003 Explicit placebo_arm and active_arms settings take precedence over auto-detection whenever the values they name are present in the data. HEP-ARM-004 Participants whose arm is designated neither placebo nor active are excluded from the migration view and their count is reported in the notes. HEP-ARM-005 When fewer than two arms resolve to opposite sides, the Sankey renders unidirectionally with a warning note rather than throwing. HEP-ARM-006 When no arm column can be resolved at all, the Migration view option is disabled with an explanatory tooltip rather than offering a view that cannot be drawn. HEP-DATA-012 The migration view reports the count of participants excluded for lacking a usable baseline or a usable on-treatment measurement, separately from the count excluded for an undesignated arm. | — | #92 |
|
HEP-ACC-001/002/003 (ribbon role/name/keys, svg role and summary) HEP-ACC-001 Every ribbon is focusable, carries role="button", and has an accessible name stating the participant count, both quadrants, the arm and the concern direction. HEP-ACC-002 A focused ribbon is activated by both Enter and Space, producing the same participant selection as a pointer click. HEP-ACC-003 The Sankey svg carries role="img" and an accessible name summarising the unfavourable and favourable shift counts for each arm. | — | #92 |
|
HEP-DOC-001 (the Clinical guide links its R / nR primary sources) HEP-DOC-001 The Clinical guide LINKS the R-Ratio and nR primary sources — Robles-Diaz et al., Gastroenterology 2014 (the composite algorithm that introduced nR) and Suh, Yeungnam Univ J Med 2020 (an open-access review stating the nR calculation) — from the R-Ratio passage where the question arises, from the Source and attribution section where a reader looks for provenance, and from the matching reference-list entries. The guide states the nR formula rather than only naming it, and states that this chart reports the ALT-based R-Ratio only. | — | #54 |
|
HEP-FILT-001..004 (shared filter contract) HEP-FILT-001 A filter spec accepts HEP-FILT-002 HEP-FILT-003 HEP-FILT-004 | HEP-FILT-001, HEP-FILT-002, HEP-FILT-003, HEP-FILT-004 | #166 |
|
HEP-CTRL-018, HEP-DATA-013 (unscheduled visits) HEP-CTRL-018 An 'Unscheduled visits' checkbox includes or excludes records taken at an unscheduled visit from the baseline and peak reduction. It is rendered only when the mapped visit column actually contains an unscheduled visit, and unscheduled visits are INCLUDED by default — diverging deliberately from results-over-time's display-only equivalent, whose default is to hide them — because an unscheduled draw in a hepatic study is often the draw a suspected injury prompted. Excluding them re-runs the clean pass rather than only redrawing, and the note line states how many records were excluded — in every view, because the exclusion changes the row set all of them reduce from. HEP-DATA-013 A visit is unscheduled when an explicit | HEP-CTRL-018, HEP-DATA-013 | #136 |
|
Visual evidence
Every screenshot below is a committed baseline: the same PNG is the visual-regression baseline the browser suite asserts against and the evidence artifact shown here. Click any capture for the full-resolution image.
HEP ACC 001 migration ribbon selected HEP ANIM 001 study day playback HEP AXIS 001 axis limits HEP COMP 001 composite plot HEP COMP 004 migration table HEP COMP 007 participant trace HEP CTRL 001 control panel HEP CTRL 006 log axes HEP CTRL 009 color by group 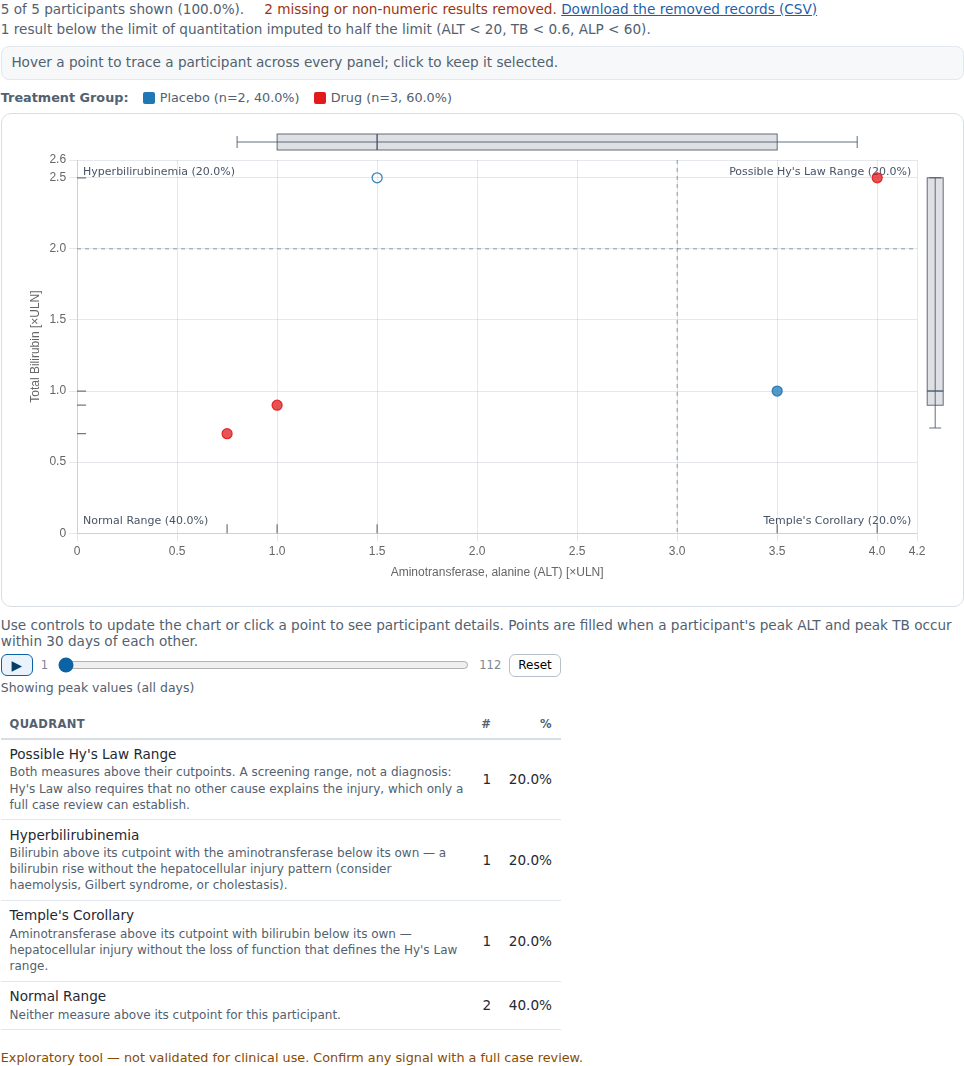
HEP CTRL 015 legend order and palette HEP CTRL 017 log base doublings HEP DATA 003 invalid data note HEP DISPLAY 001 mdish display 
HEP DROP 003 dropped record downloads HEP MARG 001 marginal box plots and rugs HEP MIG 001 migration sankey HEP MIG 017 migration ribbon tooltip HEP PALT 001 palt estimate HEP QUAD 002 quadrant summary HEP QUAD 006 cut line drag HEP QUAD 008 quadrant meanings and legend counts HEP SELECT 001 participant detail HEP SELECT 008 measure sparkline drilldown HEP STEP 002 migration handoff HEP STEP 005 migration hys law caution HEP XTAB 001 migration cross tables
Source-matrix routing status
No reviewed source requirement matrix exists yet for this module (the config's hep-explorer.md matrix link resolves once it is published in the requirements repo), so routing is against the port spec's scope rather than matrix rows.
- Implemented (
browser/unitabove): the peak-vs-peak eDISH scatter (HEP-CHART-001), participant counts (HEP-CHART-002), axis domains including the cutpoints (HEP-CHART-003), point tooltips (HEP-CHART-004), the Hy's-Law quadrant cut-lines, labels, and live percents (HEP-QUAD-001..004) plus the quadrant summary table (HEP-QUAD-005), the full control panel — measure pickers, reference lines, display type, axis type, point size, timing window, grouping, filters, R-Ratio range, and reset (HEP-CTRL-001..012) — the ×ULN/×Baseline standardization with baseline and drop handling (HEP-DISPLAY-001..007), the coordinated participant drill-down: point selection with visit-path overlay, lab-over-time panel, measure summary table, and linked listing (HEP-SELECT-001..007), data cleaning and the data contract (HEP-DATA-001..005), the lifecycle API +participantsSelectedevent (HEP-API-001/003), and the baseline-referenced composite plot for subjects with abnormal baseline liver tests (Tesfaldet et al., Drug Safety 2024) — the pretreatment and peak on-treatment eDISH panels colored by baseline quadrant, the four-panel ×Baseline shift plot, the migration table with concern coding, the by-arm concern-vs-benefit summary, and the participant cross-linking that traces a hovered/clicked participant across every panel with an id header (HEP-COMP-001..007), and the migration (Sankey) view — Figure 3 of Amirzadegan et al., Drug Safety 2025 — with its mirrored three-column diagram (HEP-MIG-001..016), per-arm cross tables (HEP-XTAB-001..006), the two-step hand-off into the composite plot (HEP-STEP-001..005), arm designation and its exclusion notes (HEP-ARM-001..006, HEP-DATA-012), and keyboard/screen-reader access to every ribbon (HEP-ACC-001..003).
- Deferred (follow-ups, not part of the coordinated-views claim): draggable cut-lines (v1 uses the reference-line number inputs), the study-day animation with play/stop and motion trails, marginal box plots and axis rugs, per-row sparklines in the measure summary table and the sparkline drill-down (the lab-over-time panel covers the trajectory-over-time need), the exposure (EX domain) track and P_ALT hepatocyte estimate, CSV downloads of dropped rows/participants, population-profile links, and imputation of below-LLOQ values (v1 drops non-numeric results like the other modules).
View-selector rollout (VIEW-2, #76)
The View selector (HEP-COMP-006) is now the shared shell builder renderViewSelector — the module-scoped hep-view-* CSS + builder were removed with no visual or behavioral change (option class names moved to the neutral sv-view-* namespace). See view-selector-inventory.md.
Reproducing this report
The evidence set is regenerated from a full test run and committed with the code it qualifies; CI fails when they drift. To verify or rebuild it:
npm ci
npm run evidence:check   # compare a fresh run against the committed evidence
npm run evidence         # regenerate docs/evidence/hep-explorer/evidence.json
Screenshot baselines are canonical to the Linux CI runner; the repository's Update evidence baselines workflow is the authoritative way to refresh them. See CONTRIBUTING.md for the traceability convention.