Time-to-Event Explorer: test evidence Experimental
Requirement-traced qualification evidence for the safety.viz time-to-event module.
Requirement matrix ↗ — the reviewed source specification these tests trace to.
- Scope
- 45 coverage rows44 distinct requirement IDs
- Tests executed
- 841 automated checks123 browser · 718 unit
- Result
- pass all passing6 evidence screenshots
- Generated
- 2026-10-04 12:03 UTC
- Environment
linux 6.17.0-1022-azure · node v22.23.3 · playwright 1.61.1 · chromium 149.0.7827.55- Test run
- Actions run #37200787716
Scope & approach
Traceability for the time-to-event module (the interactive Kaplan–Meier Time-to-Event Explorer, Phase 1, under #128; parent requirement obot.roadmap#161, design 161_design.html), per the convention in CONTRIBUTING.md. The reviewed source matrix is requirements/time-to-event.md in this repo, and each row below cites the matrix rows its test covers.
Requirement IDs use the module's condensed TTE-* scheme cited in the source and test names — TTE-CFG-* (settings and the direction / ci decisions), TTE-DATA-* (the events + population contract, counted exclusions), TTE-FILT-* (the multiselect event filters that compose the endpoint — the sv#131 review's architectural change), TTE-DERIV-* (the fixed first-qualifying-event / censor-at-follow-up derivation rule), TTE-ANIM-* (the no-intro-animation frame-consistency rule), TTE-STAT-* (the estimator itself: product-limit arithmetic, Greenwood / log-log intervals, the survfit cross-validation, the risk-table definitions, degenerate inputs), TTE-CURV-* (step rendering, censor marks, the band, axis labelling, the flat tail, group styling), TTE-RISK-* (the in-canvas strip table), TTE-USER-* (controls, tooltips, selection, empty states), TTE-GUIDE-* (the statistical-honesty language in-app and in the clinical guide), and TTE-DEMO-* (the vendored adae.csv + adsl.csv demo extracts and their drift guards).
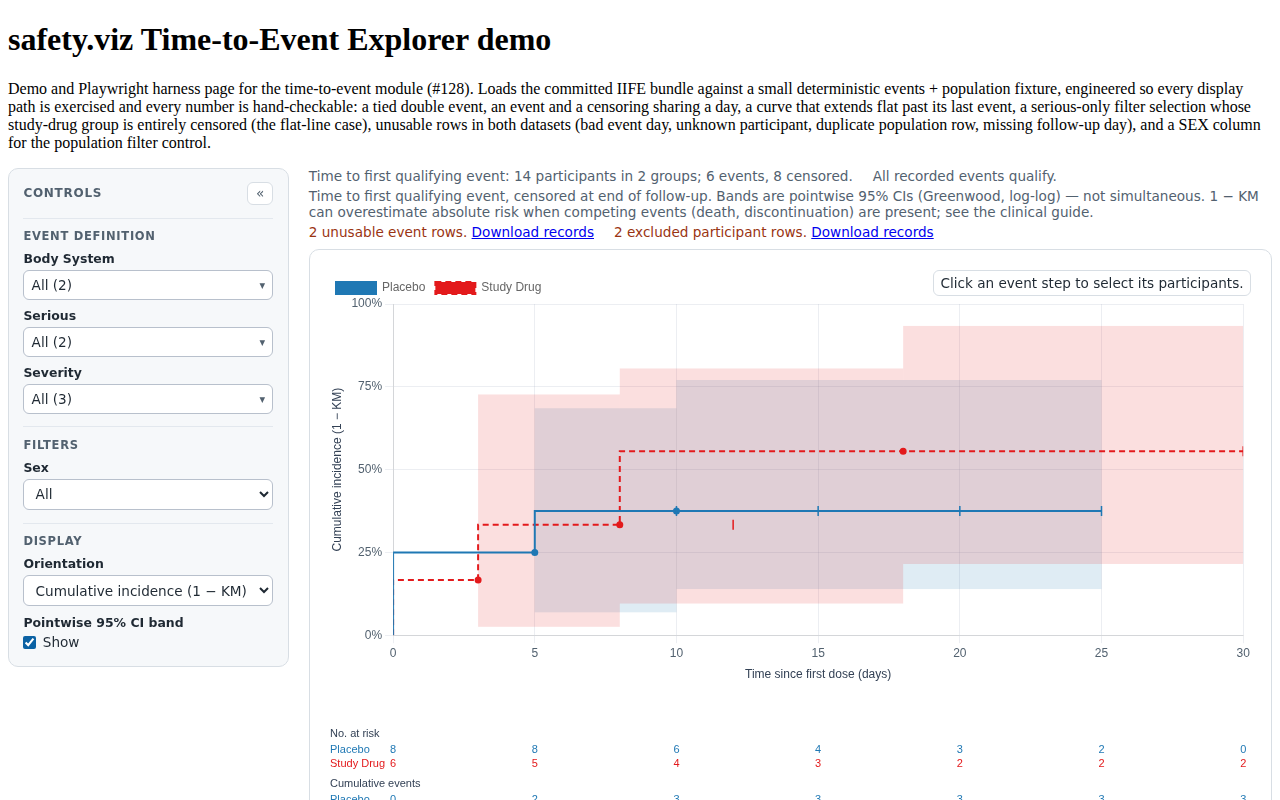
The estimator gets three independent checks (design §7): hand-computed unit tests (a tiny exact example plus the Freireich 6-MP textbook values), the committed survival::survfit reference fixture asserted to 1e-10 per endpoint × arm, and the browser suite's hand-computed fixture curves. One derivation feeds curve, band, marks and table (TTE-STAT-001), so the browser assertions read the module's own recorded geometry (chart.$tteBand, chart.$tteRiskTable) rather than re-deriving expectations.
Each table row traces one requirement to the automated test(s) that evidence it: the Requirement column shows the reviewed requirement text and its ID, the source-matrix rows link back to the specification, the issue column links the implementing work, and the result column shows the recorded outcome of every matching test from the committed evidence.json with its captured screenshots. Browser evidence is captured at fixed conditions (1280×800, device scale 1) on the canonical Linux CI environment.
Browser evidence (Playwright — tests/e2e/time-to-event.spec.js)
18 requirement rows · 18 tests
| Requirement | Source matrix rows | Issue | Tests & evidence |
|---|---|---|---|
TTE-CURV-001, TTE-CURV-005, TTE-STAT-001, TTE-DERIV-001 TTE-CURV-001 The curves render as step functions with TTE-CURV-005 A curve whose largest observed time is a censoring extends flat to that time and stops — the flat tail is the absence of information, not evidence of safety, and the guide says so. TTE-STAT-001 One estimator pass per group feeds everything shown: the curve, the band, the censor marks, and every number in the strip table come from the same TTE-DERIV-001 Each participant's observation is their earliest qualifying event day, ties broken by input order; later events for the same participant never displace the first. | TTE-CURV-001, TTE-CURV-005, TTE-STAT-001, TTE-DERIV-001 | #128 |
 |
TTE-CURV-002, TTE-DERIV-002 TTE-CURV-002 Censoring tick marks sit on the curve at each censored time, one per distinct time with the survival level in force, following their group's color and visibility. TTE-DERIV-002 An event-free participant censors at the population follow-up-end day, carrying the population censoring description into the censor-mark tooltip; without a usable follow-up day the participant is excluded with a counted reason, never silently. | TTE-CURV-002, TTE-DERIV-002 | #128 |
|
TTE-CURV-003, TTE-STAT-004 TTE-CURV-003 The pointwise band is drawn as exact step rectangles per inter-event interval from the same estimate, at low opacity in the group color, and visibly gaps where the interval is undefined rather than extrapolating. TTE-STAT-004 The estimator is cross-validated against R | TTE-CURV-003, TTE-STAT-004 | #128 |
|
TTE-ANIM-001 TTE-ANIM-001 The chart renders without intro animation: transition frames would pair an interpolated line with a band and risk table already at final geometry — transient states that are not estimates of anything. Every render, including each live filter change, shows one truthful frame. | TTE-ANIM-001 | #128 |
|
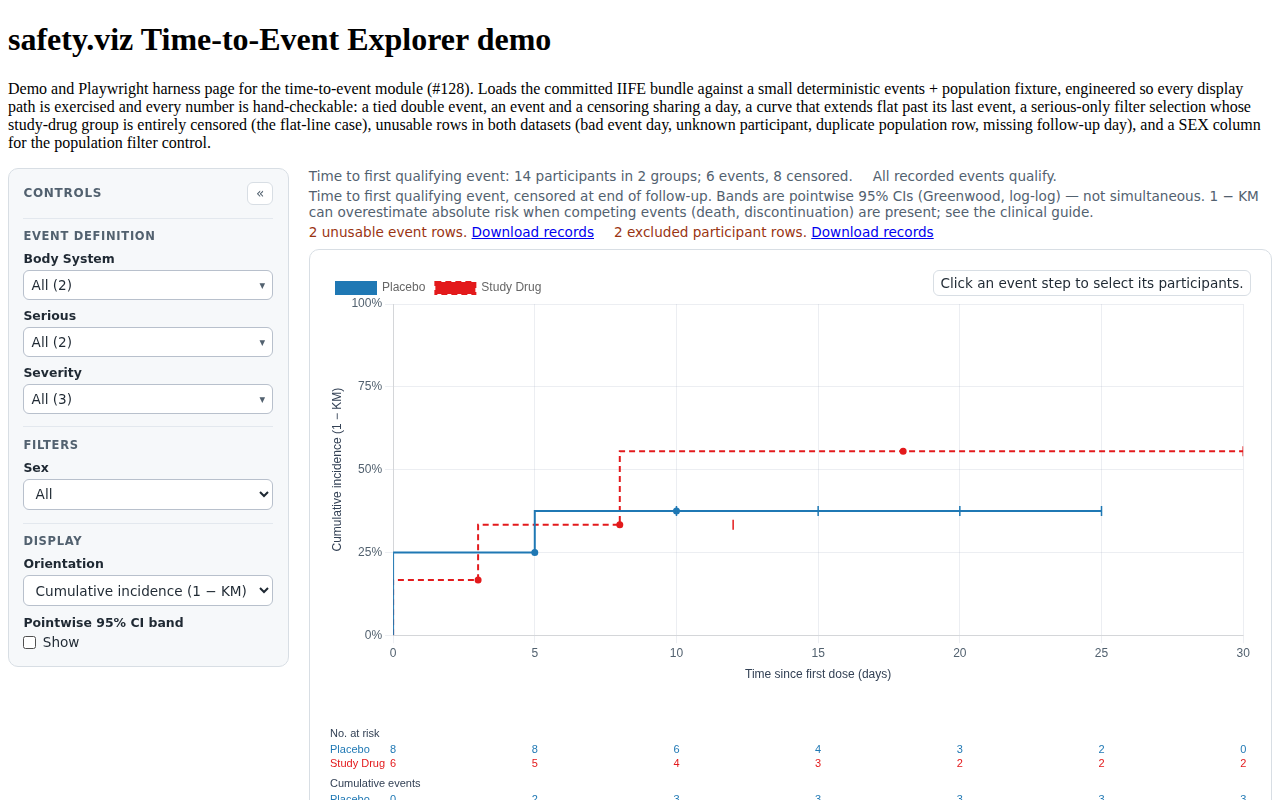
TTE-USER-003 TTE-USER-003 A CI toggle shows or hides the pointwise band without touching the curves or the strip table. | TTE-USER-003 | #128 |
 |
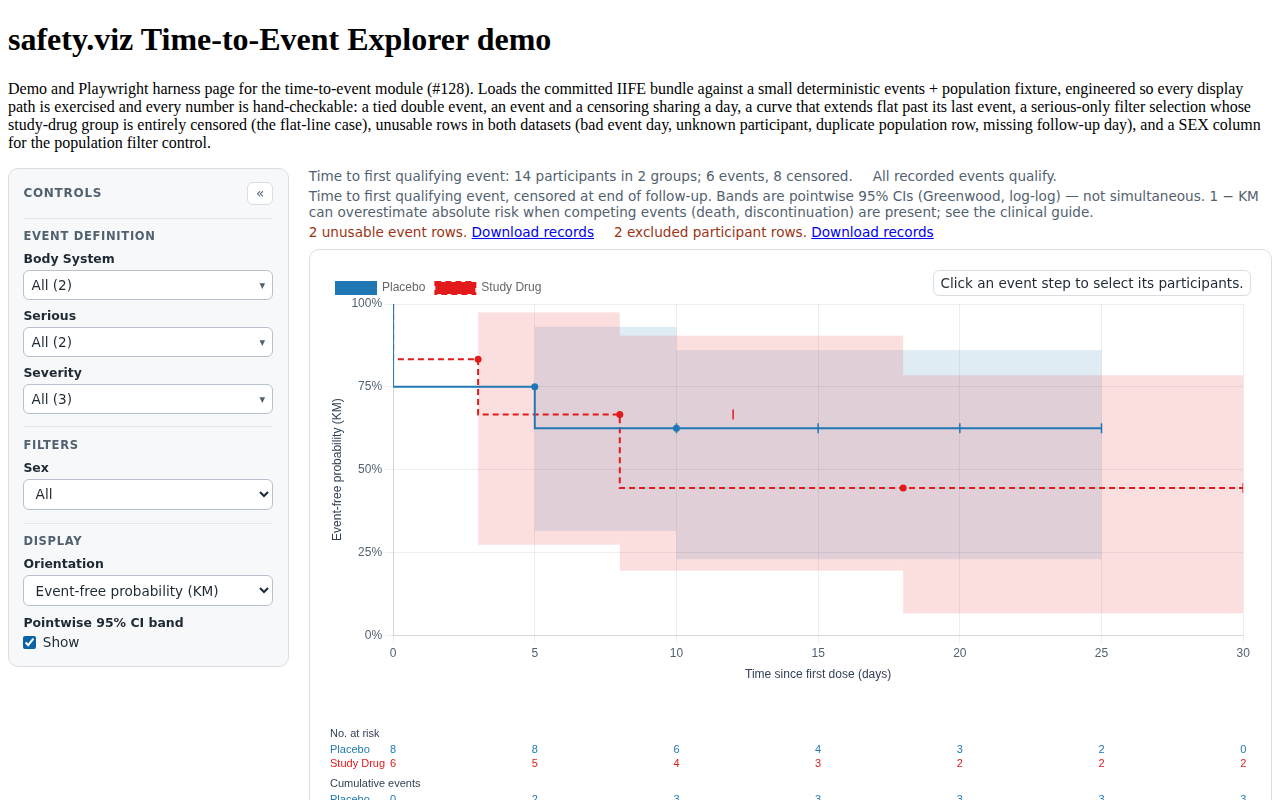
TTE-CURV-004, TTE-USER-002 TTE-CURV-004 The y-axis always names the estimator — "Cumulative incidence (1 − KM)" or "Event-free probability (KM)" — never a bare percentage, in both orientations. TTE-USER-002 An orientation control flips between cumulative incidence and event-free probability; the curves, band and axis title flip together. | TTE-CURV-004, TTE-USER-002 | #128 |
 |
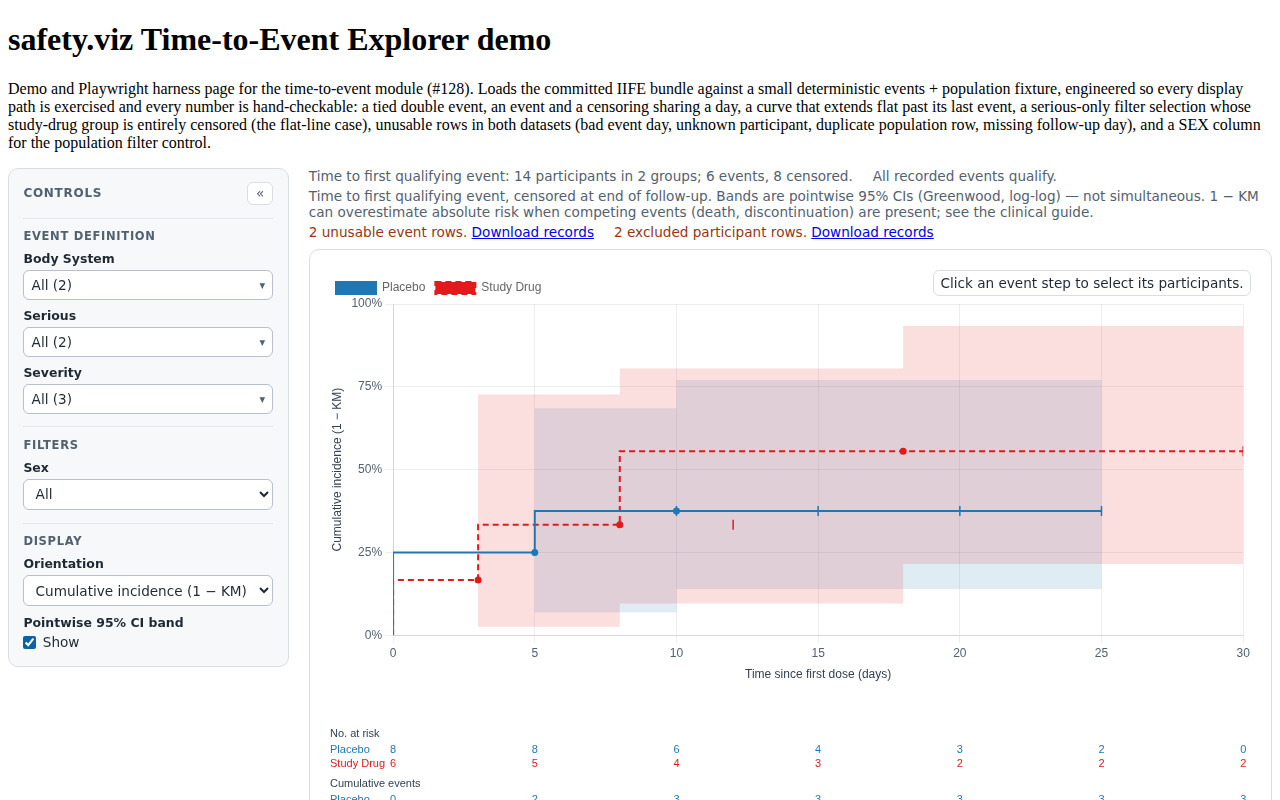
TTE-RISK-001, TTE-RISK-002 TTE-RISK-001 The strip table shows number at risk and cumulative events per group beneath the time axis — the ST&F guide's mandated furniture — with row labels naming each group in its color. TTE-RISK-002 Every strip number is centered on its tick's live pixel position via the chart's own scale, over ticks generated by the module — aligned by construction, never by a parallel layout. | TTE-RISK-001, TTE-RISK-002 | #128 |
 |
TTE-RISK-003 TTE-RISK-003 Hiding a group via the legend hides its curve, censor marks, band and strip rows together; the remaining display stays consistent. | TTE-RISK-003 | #128 |
|
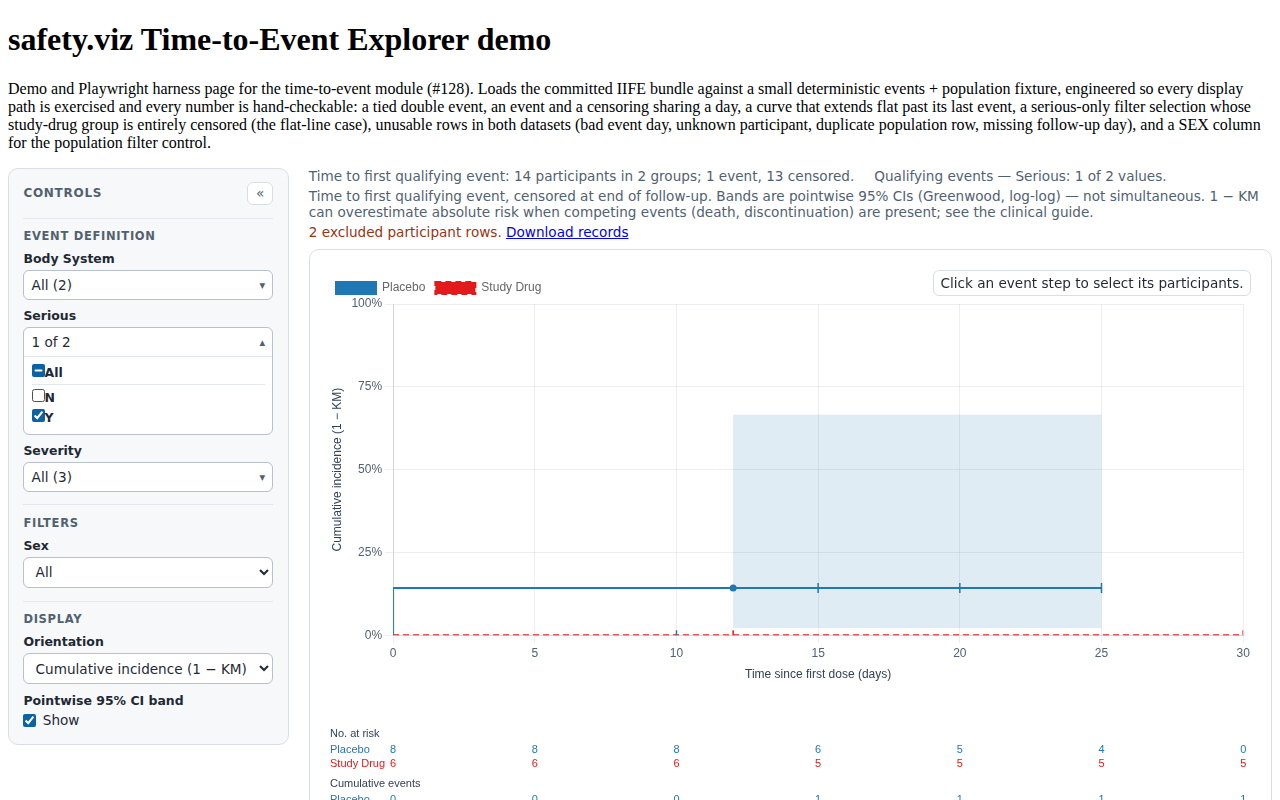
TTE-FILT-001 TTE-FILT-001 Multiselect filters over the event dataset compose the endpoint live: an event qualifies when, for every filter with an active selection, its value is in the selected set — the whole population stays the denominator, and participants whose events no longer qualify censor at follow-up end. No endpoint list is hard-coded. TTE-STAT-006 An entirely-censored group stays at S = 1 with censor marks and no confidence band — true, and visibly different from "no data"; an empty group returns an empty estimate rather than throwing. | TTE-FILT-001, TTE-STAT-006 | #128 |
 |
TTE-FILT-002 TTE-FILT-002 A filter with no active selection qualifies every event; an empty selection qualifies none and draws the honest all-censored display rather than failing. Which columns get a filter is configurable ( | TTE-FILT-002 | #128 |
|
TTE-FILT-003 TTE-FILT-003 The notes name the composed endpoint ( | TTE-FILT-003 | #128 |
|
TTE-USER-004 TTE-USER-004 Configured single-select population filters constrain the denominator before derivation; a filter whose column is absent from the population is dropped with a console warning, per the house pattern. | TTE-USER-004 | #128 |
|
TTE-DATA-002, TTE-DATA-003 TTE-DATA-002 Event rows with a missing / non-numeric / non-positive onset day, or a participant absent from the population data, are excluded with a named reason, counted in the notes, and exportable as CSV — nothing is dropped silently, in either dataset. TTE-DATA-003 One population row per participant: later duplicates are dropped with a named, counted reason; the first row is kept. | TTE-DATA-002, TTE-DATA-003 | #128 |
|
TTE-GUIDE-001 TTE-GUIDE-001 The in-app notes state, on every render: the derivation rule (time to first qualifying event, censored at end of follow-up), the bands are pointwise 95% CIs (not simultaneous), and 1 − KM can overestimate absolute risk when competing events are present — with the clinical guide carrying the full account. | TTE-GUIDE-001 | #128 |
|
TTE-USER-008 TTE-USER-008 Clicking an event step dispatches the shared | TTE-USER-008 | #128 |
|
TTE-USER-007 TTE-USER-007 A selection with no usable records renders the standard empty-state message and no chart — never an empty confident curve. | TTE-USER-007 | #128 |
|
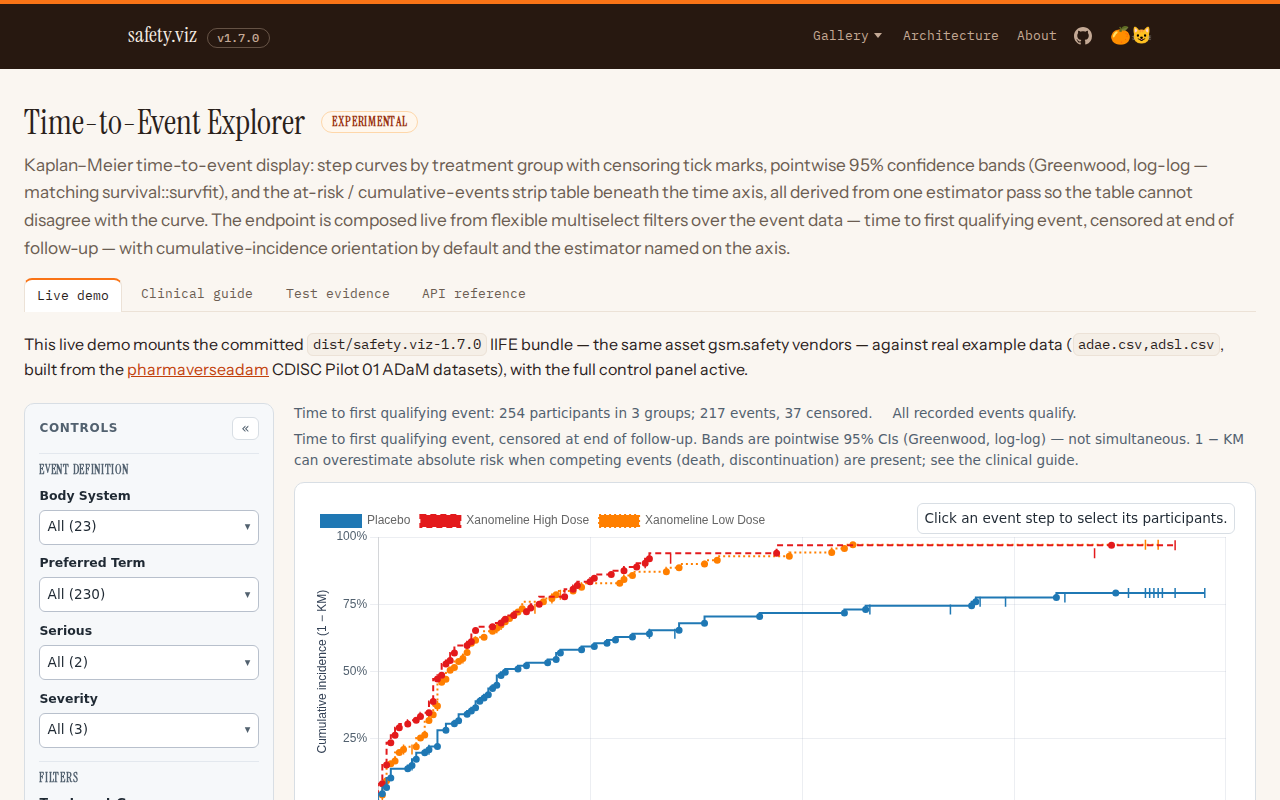
TTE-DEMO-001 TTE-DEMO-001 The built demo page composes the endpoint from the vendored | TTE-DEMO-001 | #128 |
 |
TTE-GUIDE-002 TTE-GUIDE-002 The clinical guide states the estimator's assumptions and limits plainly: the competing-risks overestimation worked through the demo's own censored deaths, the uninformative-censoring assumption, the pointwise-vs-simultaneous distinction, the sparse-endpoint display, and the right-tail at-risk caveat. | TTE-GUIDE-002 | #128 |
|
Unit evidence (Vitest — tests/unit/time-to-event/, tests/unit/demo-data/adsl.test.js, tests/unit/shell/multiSelect.test.js)
27 requirement rows · 64 tests
| Requirement | Source matrix rows | Issue | Tests & evidence |
|---|---|---|---|
TTE-CFG-001 TTE-CFG-001 The default settings carry the events + population mapping: participant id, group, follow-up-end day and censoring description on the population side; onset day, event description and the default multiselect filter columns on the event side. | TTE-CFG-001 | #128 |
|
TTE-CFG-002 TTE-CFG-002 The display orientation is a validated | TTE-CFG-002 | #128 |
|
TTE-CFG-003 TTE-CFG-003 The pointwise-95%-band toggle is a boolean | TTE-CFG-003 | #128 |
|
TTE-DATA-001 TTE-DATA-001 The module validates both datasets against the mapping in one error naming every missing dataset and column (events: id + onset day; population: id + follow-up day); the group and description columns stay optional. | TTE-DATA-001 | #128 |
|
TTE-DATA-002 TTE-DATA-002 Event rows with a missing / non-numeric / non-positive onset day, or a participant absent from the population data, are excluded with a named reason, counted in the notes, and exportable as CSV — nothing is dropped silently, in either dataset. | TTE-DATA-002 | #128 |
|
TTE-FILT-001 TTE-FILT-001 Multiselect filters over the event dataset compose the endpoint live: an event qualifies when, for every filter with an active selection, its value is in the selected set — the whole population stays the denominator, and participants whose events no longer qualify censor at follow-up end. No endpoint list is hard-coded. | TTE-FILT-001 | #128 |
|
TTE-FILT-002 TTE-FILT-002 A filter with no active selection qualifies every event; an empty selection qualifies none and draws the honest all-censored display rather than failing. Which columns get a filter is configurable ( | TTE-FILT-002 | #128 |
|
TTE-FILT-003 TTE-FILT-003 The notes name the composed endpoint ( | TTE-FILT-003 | #128 |
|
TTE-DERIV-001 TTE-DERIV-001 Each participant's observation is their earliest qualifying event day, ties broken by input order; later events for the same participant never displace the first. | TTE-DERIV-001 | #128 |
|
TTE-DERIV-002 TTE-DERIV-002 An event-free participant censors at the population follow-up-end day, carrying the population censoring description into the censor-mark tooltip; without a usable follow-up day the participant is excluded with a counted reason, never silently. | TTE-DERIV-002 | #128 |
|
TTE-DATA-003 TTE-DATA-003 One population row per participant: later duplicates are dropped with a named, counted reason; the first row is kept. | TTE-DATA-003 | #128 |
|
TTE-DATA-004 TTE-DATA-004 A population with no group column draws one pooled curve labelled "All participants" rather than failing or guessing a grouping. | TTE-DATA-004 | #128 |
|
TTE-STAT-001 TTE-STAT-001 One estimator pass per group feeds everything shown: the curve, the band, the censor marks, and every number in the strip table come from the same | TTE-STAT-001 | #128 |
|
TTE-STAT-002 TTE-STAT-002 The product-limit estimator is computed exactly as design §3.1 states, including tie conventions: at risk means observed time ≥ t, and a participant censored at an event time is still in that event's risk set (the survfit convention). Verified digit-for-digit against hand-computed values and the Freireich 6-MP textbook example. | TTE-STAT-002 | #128 |
|
TTE-STAT-003 TTE-STAT-003 The variance is Greenwood's formula and the pointwise 95% interval uses the complementary log-log transform, so bounds respect [0, 1] structurally; where the transform is undefined (S = 1 before the first event, S = 0, an exhausted risk set) the bound is null — reported absent, never extrapolated. | TTE-STAT-003 | #128 |
|
TTE-STAT-004 TTE-STAT-004 The estimator is cross-validated against R | TTE-STAT-004 | #128 |
|
TTE-STAT-005 TTE-STAT-005 The strip-table numbers are defined exactly: n at risk at t = participants with observed time ≥ t; cumulative events at t = events at times ≤ t — read from the same sorted arrays the estimator walked. | TTE-STAT-005 | #128 |
|
TTE-STAT-006 TTE-STAT-006 An entirely-censored group stays at S = 1 with censor marks and no confidence band — true, and visibly different from "no data"; an empty group returns an empty estimate rather than throwing. | TTE-STAT-006 | #128 |
|
TTE-CURV-005 TTE-CURV-005 A curve whose largest observed time is a censoring extends flat to that time and stops — the flat tail is the absence of information, not evidence of safety, and the guide says so. | TTE-CURV-005 | #128 |
|
TTE-CURV-006 TTE-CURV-006 Group identity is color plus a per-group dash pattern in fixed order — identity, never rank: filters and legend toggles never repaint surviving groups, and the dash is the non-color channel for colorblind readers and monochrome print. | TTE-CURV-006 | #128 |
|
TTE-RISK-001 TTE-RISK-001 The strip table shows number at risk and cumulative events per group beneath the time axis — the ST&F guide's mandated furniture — with row labels naming each group in its color. | TTE-RISK-001 | #128 |
|
TTE-RISK-002 TTE-RISK-002 Every strip number is centered on its tick's live pixel position via the chart's own scale, over ticks generated by the module — aligned by construction, never by a parallel layout. | TTE-RISK-002 | #128 |
|
TTE-USER-005 TTE-USER-005 An event step's tooltip names the time, the group, the display value with its interval labelled "pointwise 95% CI", and the step's own arithmetic (events over at-risk, censorings sharing the time). | TTE-USER-005 | #128 |
|
TTE-USER-006 TTE-USER-006 A censor mark's tooltip names the time, the count censored there, and the censoring reasons when the data carries them ( | TTE-USER-006 | #128 |
|
TTE-DEMO-002 TTE-DEMO-002 The committed population extract is guarded against silent upstream drift: 254 safety participants across the three arms, every follow-up day a positive integer in the measured 1–213 range, each with an end-of-study status. | TTE-DEMO-002 | #128 |
|
TTE-FILT-005..008 (shared filter contract) TTE-FILT-005 A filter spec accepts TTE-FILT-006 TTE-FILT-007 TTE-FILT-008 | TTE-FILT-005, TTE-FILT-006, TTE-FILT-007, TTE-FILT-008 | #166 |
|
TTE-CTRL-001 TTE-CTRL-001 A reset control at the foot of the control panel returns the chart to its opening view: the endpoint composer's event filters, the population filters, the orientation and the confidence-band toggle all return to their configured defaults, the selection is cleared, and the chart is rebuilt from a clean teardown. | TTE-CTRL-001 | #136 |
|
Known gaps, stated
0 requirement rows · 0 tests
| Requirement | Source matrix rows | Issue | Tests & evidence |
|---|
Visual evidence
Every screenshot below is a committed baseline: the same PNG is the visual-regression baseline the browser suite asserts against and the evidence artifact shown here. Click any capture for the full-resolution image.
TTE CURV 001 km curves incidence TTE CURV 004 survival orientation TTE DEMO 001 demo page TTE FILT 001 serious only composed endpoint TTE RISK 001 risk table TTE USER 003 ci band off
Reproducing this report
The evidence set is regenerated from a full test run and committed with the code it qualifies; CI fails when they drift. To verify or rebuild it:
npm ci
npm run evidence:check   # compare a fresh run against the committed evidence
npm run evidence         # regenerate docs/evidence/time-to-event/evidence.json
Screenshot baselines are canonical to the Linux CI runner; the repository's Update evidence baselines workflow is the authoritative way to refresh them. See CONTRIBUTING.md for the traceability convention.