Hepatic ALT Waterfall: test evidence Experimental
Requirement-traced qualification evidence for the safety.viz hep-waterfall module.
Requirement matrix ↗ — the reviewed source specification these tests trace to.
- Scope
- 32 coverage rows61 distinct requirement IDs
- Tests executed
- 853 automated checks124 browser · 729 unit
- Result
- pass all passing9 evidence screenshots
- Generated
- 2026-10-04 12:03 UTC
- Environment
linux 6.17.0-1022-azure · node v22.23.3 · playwright 1.61.1 · chromium 149.0.7827.55- Test run
- Actions run #37200787716
Scope & approach
Traceability for the hep-waterfall module — the modified ALT waterfall of Amirzadegan et al., "Emerging Tools to Support DILI Assessment in Clinical Trials with Abnormal Baseline Serum Liver Tests or Pre-existing Liver Diseases", _Drug Safety_ 2025;48(5):443–453 (DOI, PMID 39932652), Figure 5 — built under #93; parent requirement obot.roadmap#43, per the convention in CONTRIBUTING.md.
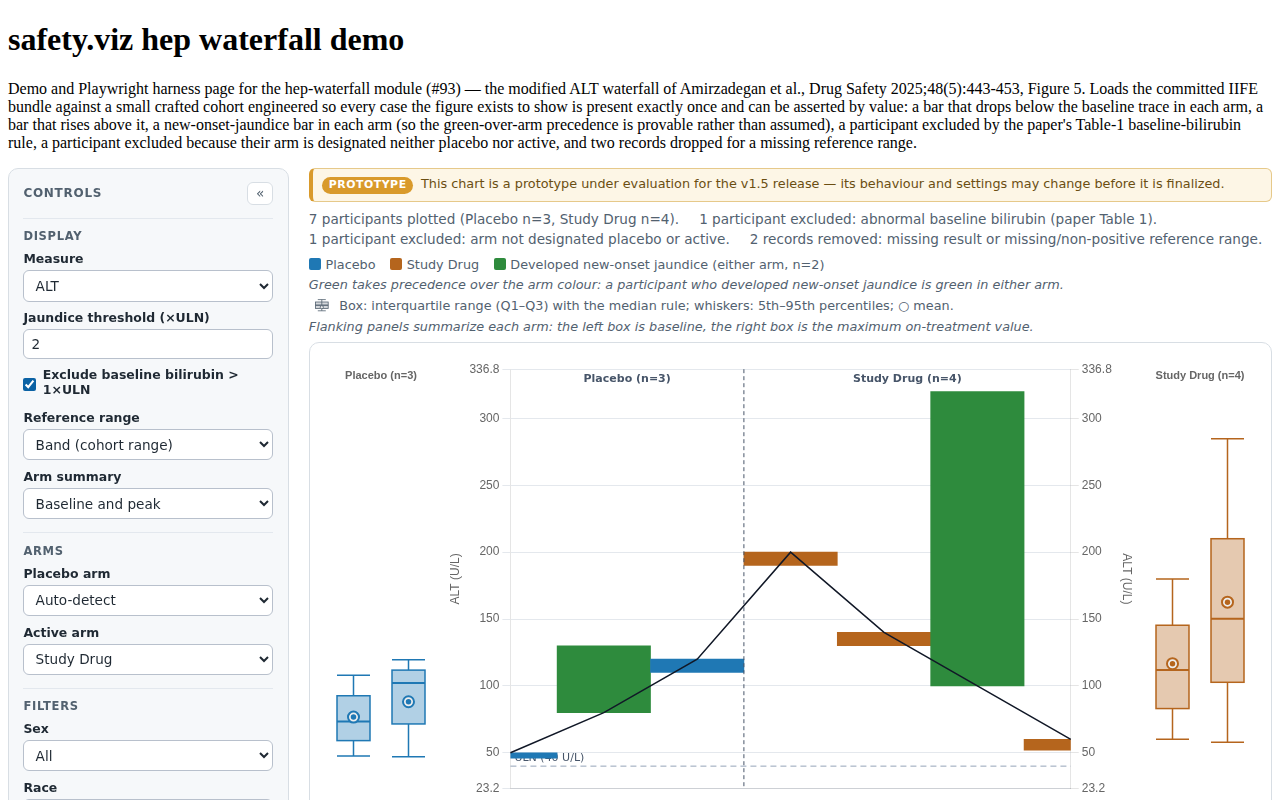
Unlike the other renderers here, this module is not a port of a legacy RhoInc/SafetyGraphics renderer — it is a new renderer derived from a published figure, so the requirement matrix cites the paper's figure caption, its Table-1 applicability rule and its body text rather than a source repository. Requirement IDs use the module's condensed **HWF-*** scheme cited in the source and test names — HWF-CFG-* (settings normalization), HWF-DATA-* (data contract, the cohort rules, the baseline/on-treatment split, units), HWF-ORDER-* (the baseline ranking and the mountain invariant), HWF-BAR-* (the floating bars and the baseline trace), HWF-AXIS-* (the absolute-unit mirrored axes and the reference range), HWF-COLOR-* (the semantic arm palette and the jaundice override), HWF-BOX-* (the flanking summary panels, their hover and their labelling), HWF-CTRL-* (controls), HWF-SELECT-* (tooltip, selection, event), HWF-API-* (factory and lifecycle), and HWF-COHORT-* (the invariants the synthetic demo cohort must keep for the figure to be demonstrable at all).
Each table row traces one requirement to the automated test(s) that evidence it: the Requirement column shows the reviewed requirement text and its ID, the source-matrix rows link back to the specification, the issue column links the implementing work, and the result column shows the recorded outcome of every matching test from the committed evidence.json with its captured screenshots. Browser evidence is captured at fixed conditions (1280×800, device scale 1) on the canonical Linux CI environment.
Browser evidence (Playwright — tests/e2e/hep-waterfall.spec.js)
18 requirement rows · 18 tests
| Requirement | Source matrix rows | Issue | Tests & evidence |
|---|---|---|---|
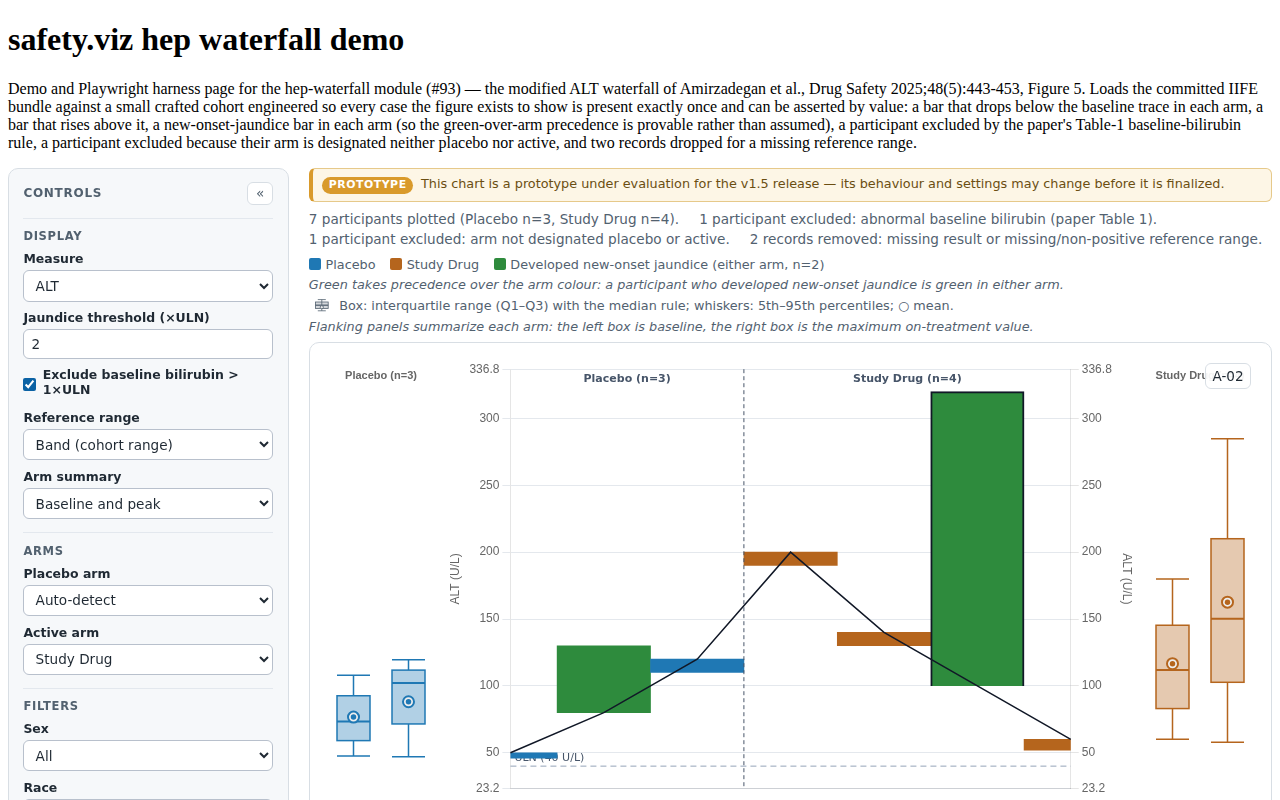
HWF-BAR-001/002/003/004, HWF-ORDER-001/002/003 HWF-BAR-001 Each plotted participant is drawn as exactly one floating bar spanning from their baseline value to their maximum on-treatment value, with no gap between adjacent bars so the cohort reads as one continuous profile. HWF-BAR-002 A bar extends upward from the baseline trace when the participant's maximum on-treatment value exceeds their baseline, and downward when it falls below, so direction alone distinguishes a rise from a fall. HWF-BAR-003 A single continuous black line traces every plotted participant's baseline value across the ordered participants, drawn without point markers. HWF-BAR-004 The baseline trace is drawn on top of the bars, so it stays visible wherever a bar crosses it. HWF-ORDER-001 Placebo participants occupy the left half of the plot ordered by ascending baseline value, so the arm's lowest baseline sits at the far left edge. HWF-ORDER-002 Active participants occupy the right half of the plot ordered by descending baseline value, so the two arms' highest baselines meet at the placebo/active boundary in the centre of the plot. HWF-ORDER-003 Across the ordered participants the baseline series is non-decreasing over the placebo span and non-increasing over the active span, so the baseline trace is unimodal with its single peak at the arm boundary. | HWF-BAR-001..004, HWF-ORDER-001..003 | #93 |
 |
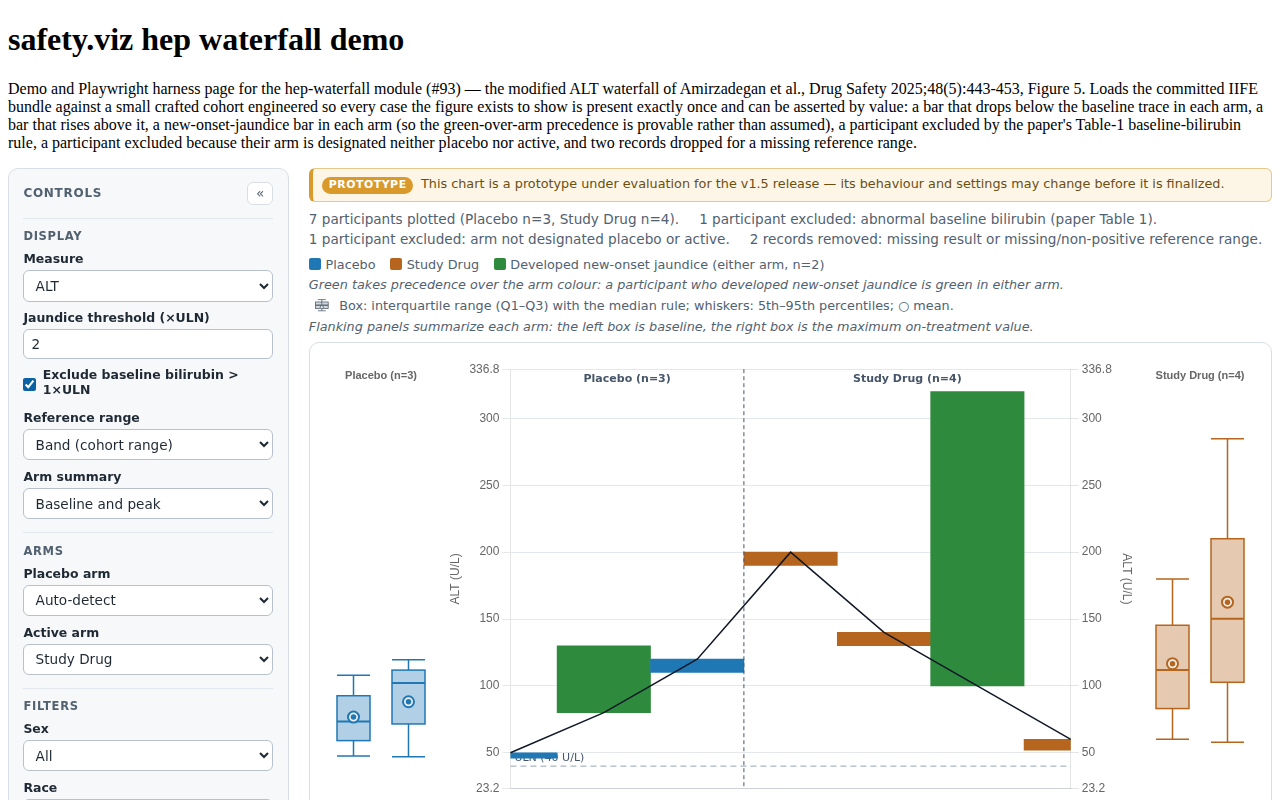
HWF-COLOR-001, HWF-COLOR-002, HWF-COLOR-004 HWF-COLOR-001 Placebo-arm bars are blue and active-arm bars are bronze, taken from a fixed semantic arm palette rather than the library's index-cycling group palette, so a change in arm ordering cannot swap the two colours. HWF-COLOR-002 A participant flagged with new-onset jaundice is drawn green regardless of their arm, so the jaundice encoding takes precedence over the arm encoding. HWF-COLOR-004 The legend states that the jaundice colour overrides the arm colour, so the bar colours cannot be mistaken for a complete count of each arm. | HWF-COLOR-001, HWF-COLOR-002, HWF-COLOR-004 | #93 |
 |
HWF-COLOR-003 HWF-COLOR-003 A vertical divider marks the placebo/active boundary, and each half is captioned with its arm name and its plotted participant count. | HWF-COLOR-003 | #93 |
|
HWF-AXIS-002, HWF-AXIS-003, HWF-AXIS-004 HWF-AXIS-002 The right-hand axis mirrors the left: both take their minimum and maximum from a single domain computation, and no dataset is plotted against the right-hand axis. HWF-AXIS-003 Both axis titles name the plotted measure and its resolved unit. HWF-AXIS-004 When every plotted participant shares one reference range the upper limit of normal is drawn as a single horizontal line; when the reference range varies it is drawn as a shaded band spanning the cohort's minimum to maximum reference value, labelled with that range. | HWF-AXIS-002, HWF-AXIS-003, HWF-AXIS-004 | #93 |
|
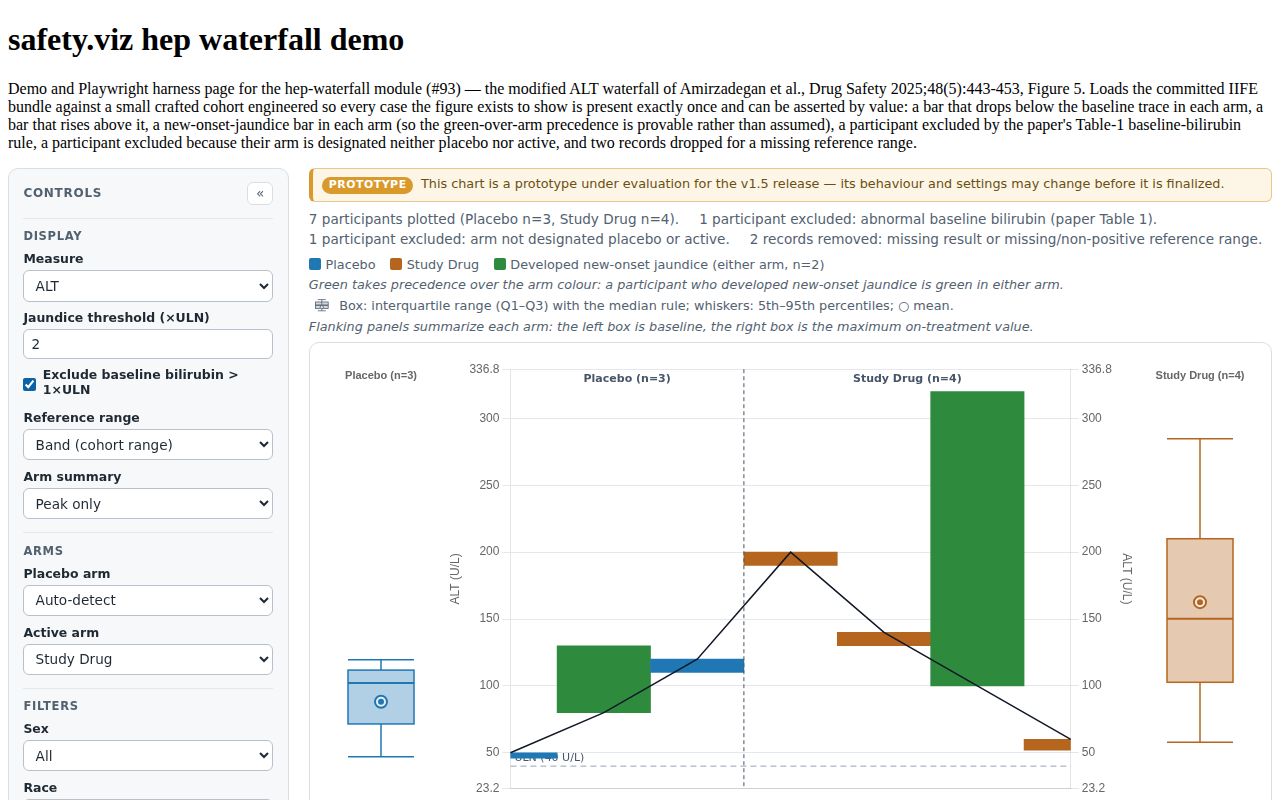
HWF-BOX-001, HWF-BOX-002, HWF-BOX-003 HWF-BOX-001 A summary box-and-whisker panel is rendered on each flank of the main chart — placebo on the left and active on the right. HWF-BOX-002 Each flanking panel is pinned to the same vertical minimum and maximum as the main chart, so its marks are vertically registered with the bars and directly comparable to them. HWF-BOX-003 With summary set to baseline_peak, each flanking panel shows two boxes for its arm — the distribution of baseline values and the distribution of maximum on-treatment values — so the panel summarises the shift the bars show per participant; with summary set to peak, the maximum-on-treatment box is shown alone. | HWF-BOX-001, HWF-BOX-002, HWF-BOX-003 | #93 |
 |
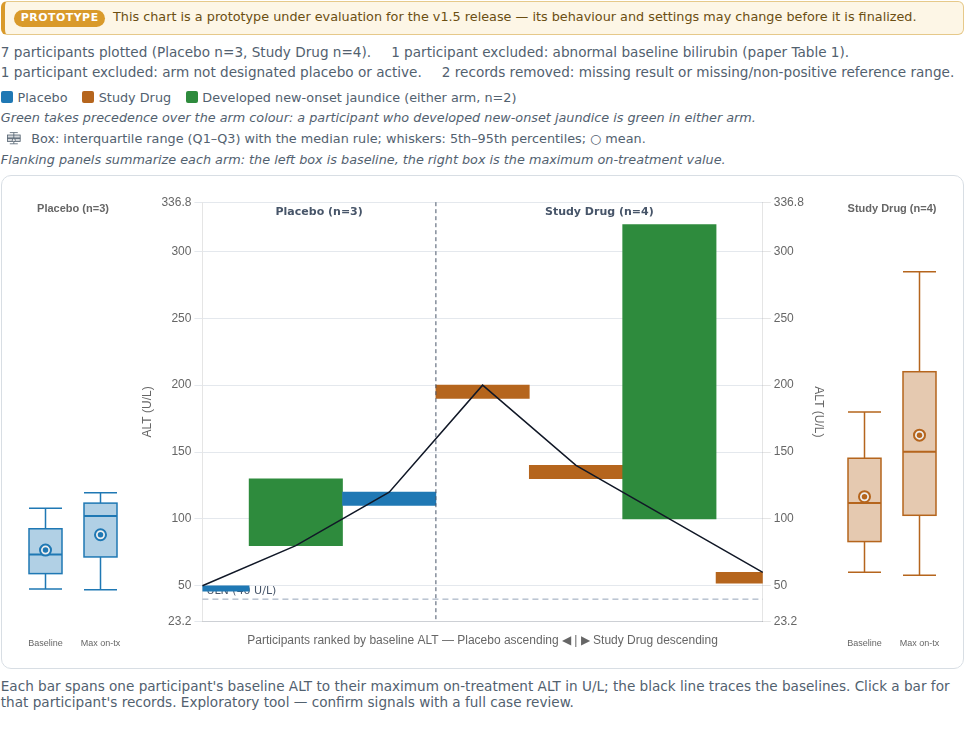
HWF-BOX-006, HWF-BOX-007 HWF-BOX-006 Each flanking panel labels its slots — baseline and maximum on-treatment — and titles itself with its arm name and that arm's plotted participant count; the chart legend carries a drawn key naming every mark the panels use (the interquartile box, the median rule, the 5th/95th whiskers and the mean marker) and a note spelling out which box is which. HWF-BOX-007 Each flanking panel canvas carries an accessible description of its own contents — the arm, and per box the participant count, the median, the interquartile range and the 5th-to-95th-percentile span — so the summary is readable without a pointer or a screenshot. | HWF-BOX-006, HWF-BOX-007 | #83 |
 |
HWF-BOX-005 HWF-BOX-005 Pointing at a box in a flanking panel opens a tooltip naming the arm and which box it is, and giving n and every statistic the panel draws — 5th percentile, first quartile, median, mean, third quartile, 95th percentile — plus the observed range; the hovered box is marked out from its neighbour while the tooltip is open, and the same tooltips are reachable by focusing the panel and stepping between its boxes with the arrow keys. | HWF-BOX-005 | #83 |
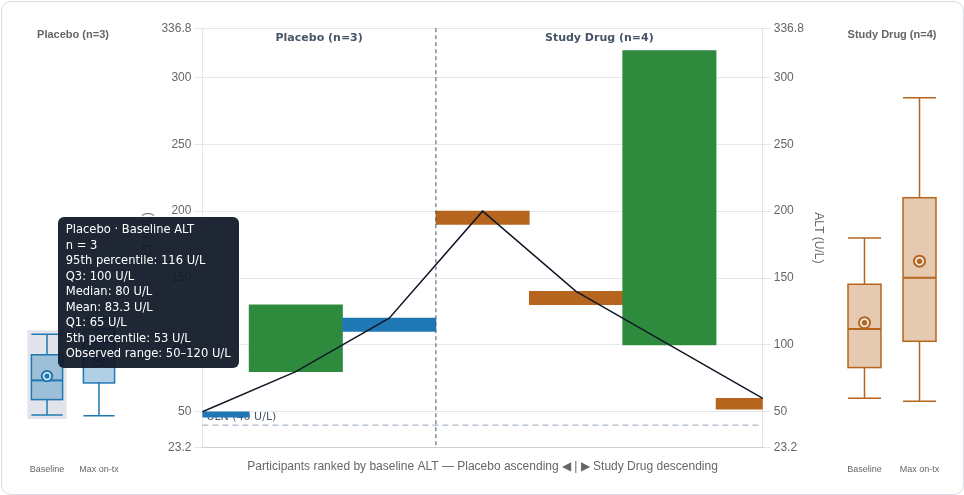 |
HWF-BOX-005 HWF-BOX-005 Pointing at a box in a flanking panel opens a tooltip naming the arm and which box it is, and giving n and every statistic the panel draws — 5th percentile, first quartile, median, mean, third quartile, 95th percentile — plus the observed range; the hovered box is marked out from its neighbour while the tooltip is open, and the same tooltips are reachable by focusing the panel and stepping between its boxes with the arrow keys. | HWF-BOX-005 | #83 |
|
HWF-DATA-003, HWF-DATA-005, HWF-DATA-008 HWF-DATA-003 When apply_tb_cohort is true, participants whose baseline total bilirubin exceeds baseline_tb_max are excluded from the plotted cohort, and their count is reported in an on-page note naming the baseline-bilirubin rule as the reason. HWF-DATA-005 Participants whose arm value resolves to neither placebo nor active are excluded from the plotted cohort, and their count is reported in a note kept separate from the baseline-bilirubin exclusion note. HWF-DATA-008 The count of records dropped for a missing or non-positive reference range is reported in the notes rather than dropped silently. | HWF-DATA-003, HWF-DATA-005, HWF-DATA-008 | #93 |
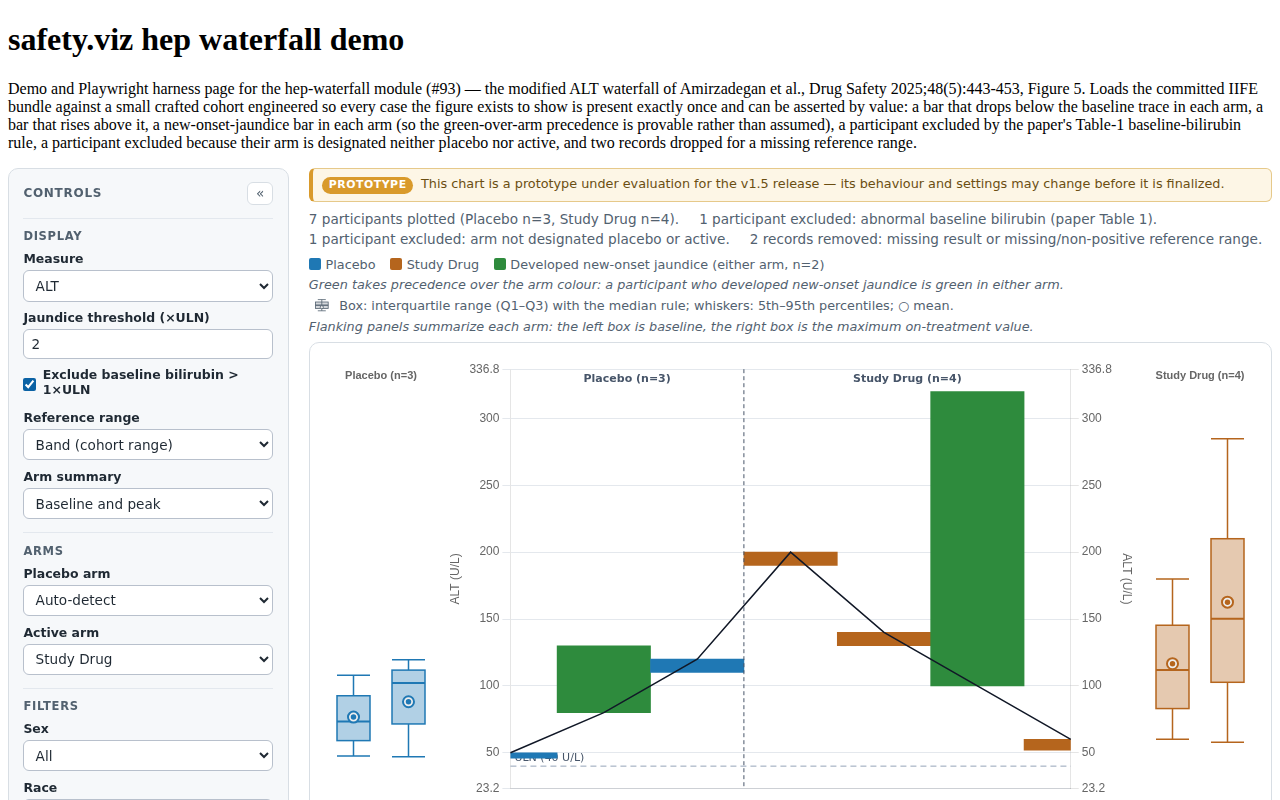 |
HWF-DATA-003 HWF-DATA-003 When apply_tb_cohort is true, participants whose baseline total bilirubin exceeds baseline_tb_max are excluded from the plotted cohort, and their count is reported in an on-page note naming the baseline-bilirubin rule as the reason. | HWF-DATA-003 | #93 |
|
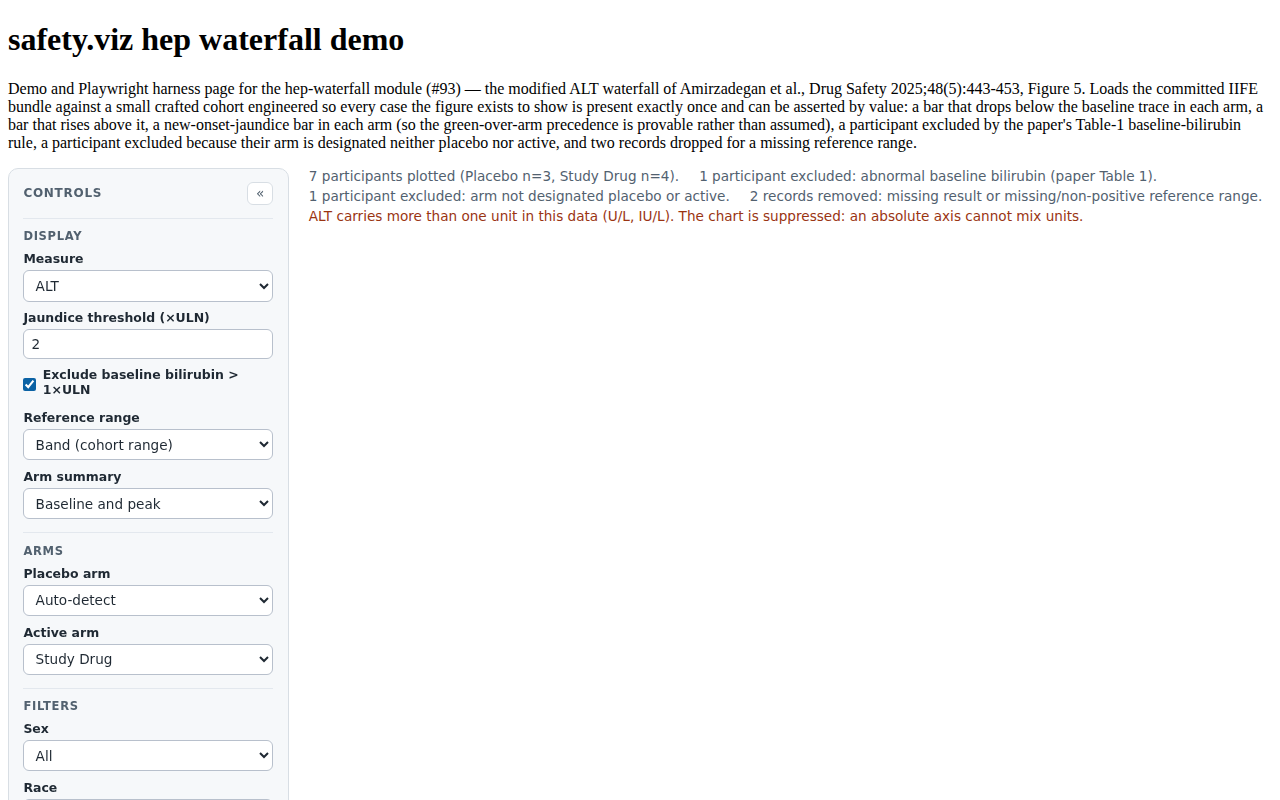
HWF-DATA-007 HWF-DATA-007 When the plotted measure carries more than one distinct unit across the cohort, a warning naming the conflicting units is rendered and the chart is suppressed, rather than plotting mixed units on a single absolute axis. | HWF-DATA-007 | #93 |
 |
HWF-CTRL-001, HWF-CTRL-002 HWF-CTRL-001 The control panel exposes the plotted measure, the jaundice threshold, the baseline-bilirubin cohort toggle, the upper-limit display mode and the summary mode, and changing any of them re-renders the chart and its flanking panels. HWF-CTRL-002 The control panel exposes an arm-mapping control listing every arm value present in the data, so a reviewer can designate which arm is placebo and which arms are active without editing settings. | HWF-CTRL-001, HWF-CTRL-002 | #93 |
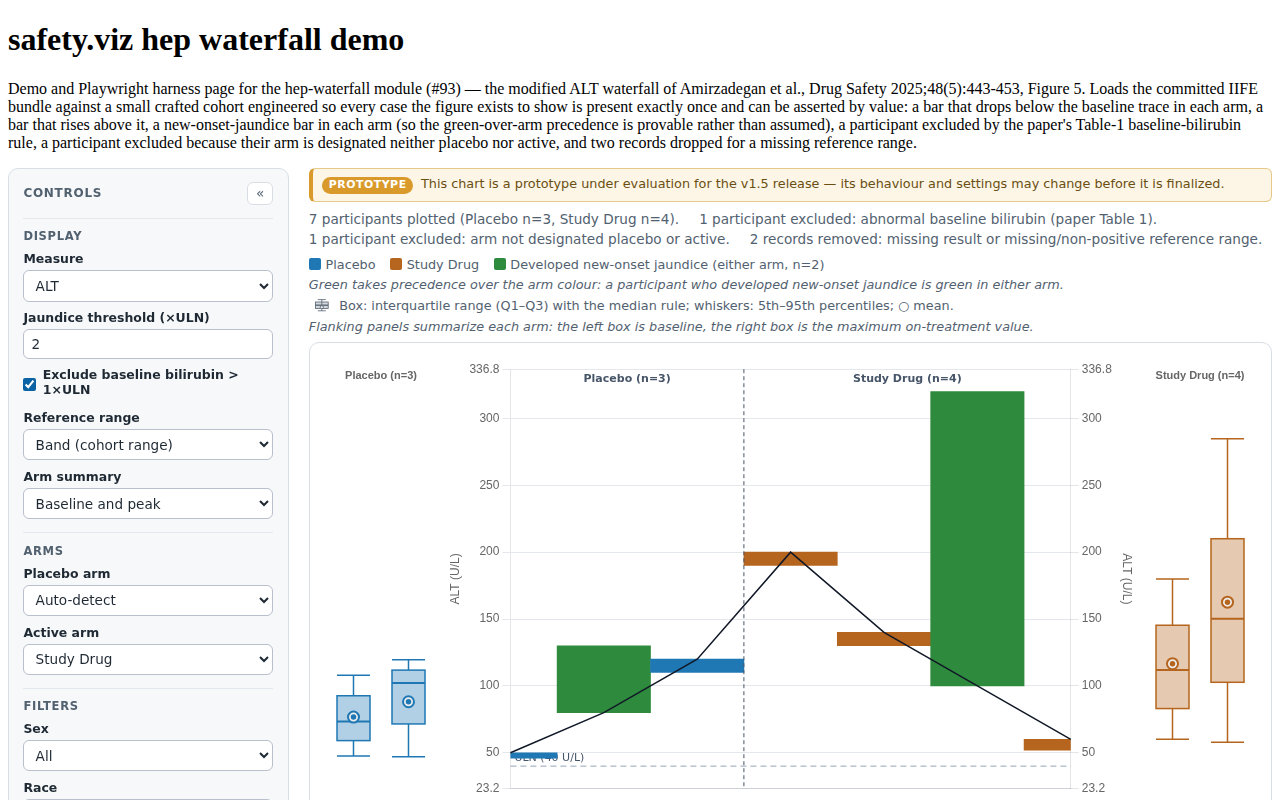 |
HWF-CTRL-001 HWF-CTRL-001 The control panel exposes the plotted measure, the jaundice threshold, the baseline-bilirubin cohort toggle, the upper-limit display mode and the summary mode, and changing any of them re-renders the chart and its flanking panels. | HWF-CTRL-001 | #93 |
|
HWF-CTRL-001 HWF-CTRL-001 The control panel exposes the plotted measure, the jaundice threshold, the baseline-bilirubin cohort toggle, the upper-limit display mode and the summary mode, and changing any of them re-renders the chart and its flanking panels. | HWF-CTRL-001 | #93 |
|
HWF-CTRL-003 HWF-CTRL-003 Configured filters are rendered as controls that restrict the plotted cohort, with the plotted and excluded participant counts in the notes updating on every filter change. | HWF-CTRL-003 | #93 |
|
HWF-CTRL-004 HWF-CTRL-004 A reset control restores every settings-derived control to its configured default and re-renders. | HWF-CTRL-004 | #93 |
|
HWF-SELECT-001 HWF-SELECT-001 Hovering a bar shows a tooltip listing the participant identifier, arm, baseline value, maximum on-treatment value with the study day it occurred, the change from baseline in both absolute units and multiples of baseline, the participant's maximum total bilirubin in ×ULN, and their jaundice status. | HWF-SELECT-001 | #93 |
|
HWF-SELECT-002, HWF-SELECT-003 HWF-SELECT-002 Clicking a bar selects that participant, highlights their bar against the rest of the cohort, and opens the participant listing. HWF-SELECT-003 A selection dispatches a participantsSelected event on the module's root element carrying the selected participant identifiers. | HWF-SELECT-002, HWF-SELECT-003 | #93 |
 |
Unit evidence (Vitest — tests/unit/hep-waterfall/)
14 requirement rows · 100 tests
| Requirement | Source matrix rows | Issue | Tests & evidence |
|---|---|---|---|
HWF-CFG-001..005 (defaults, thresholds, arm designation, the two enum settings) HWF-CFG-001 syncSettings fills every unset setting from the module defaults and normalizes the field-list settings (filters, groups) supplied as a bare column name, a spec object, or an array of either, into a uniform array of specs. HWF-CFG-002 The measure (default ALT), jaundice_uln (default 2) and baseline_tb_max (default 1) settings are settable; both thresholds are numified with a non-numeric or negative value rejected in favour of the default, and apply_tb_cohort is coerced to a boolean defaulting to true. HWF-CFG-003 The placebo_arm and active_arms settings carry arm values rather than positions, with active_arms arrayified from a single string, and are resolved to a placebo/active side map at render time, so a change in arm ordering in the data cannot re-assign a participant's side. HWF-CFG-004 The uln_display setting accepts band, per_subject and none, and falls back to band for any unrecognized value. HWF-CFG-005 The summary setting accepts baseline_peak and peak, and falls back to baseline_peak for any unrecognized value. | HWF-CFG-001..005 | #93 |
|
HWF-DATA-001, HWF-DATA-005 (schema required columns, arm required) HWF-DATA-001 Each plotted participant carries exactly one baseline value and one maximum on-treatment value for the configured measure, both in the data's absolute reporting units rather than as multiples of the upper limit of normal or of baseline. HWF-DATA-005 Participants whose arm value resolves to neither placebo nor active are excluded from the plotted cohort, and their count is reported in a note kept separate from the baseline-bilirubin exclusion note. | HWF-DATA-001, -005 | #93 |
|
HWF-DATA-001/002/003/004/005/008 (the shared reduction, cohort rules, counted drops) HWF-DATA-001 Each plotted participant carries exactly one baseline value and one maximum on-treatment value for the configured measure, both in the data's absolute reporting units rather than as multiples of the upper limit of normal or of baseline. HWF-DATA-002 The maximum on-treatment value excludes the resolved baseline record by record identity rather than by study day, so a participant whose highest recorded value is their baseline is plotted with a bar extending below the baseline trace. HWF-DATA-003 When apply_tb_cohort is true, participants whose baseline total bilirubin exceeds baseline_tb_max are excluded from the plotted cohort, and their count is reported in an on-page note naming the baseline-bilirubin rule as the reason. HWF-DATA-004 A participant is flagged with new-onset jaundice when their baseline total bilirubin is at or below jaundice_uln and their maximum on-treatment total bilirubin exceeds it; both clauses are evaluated, so the flag stays correct when apply_tb_cohort is turned off. HWF-DATA-005 Participants whose arm value resolves to neither placebo nor active are excluded from the plotted cohort, and their count is reported in a note kept separate from the baseline-bilirubin exclusion note. HWF-DATA-008 The count of records dropped for a missing or non-positive reference range is reported in the notes rather than dropped silently. | HWF-DATA-001..005, -008 | #93 |
|
HWF-ORDER-001/002/003/004 (the mountain, and the mandatory identifier tie-break) HWF-ORDER-001 Placebo participants occupy the left half of the plot ordered by ascending baseline value, so the arm's lowest baseline sits at the far left edge. HWF-ORDER-002 Active participants occupy the right half of the plot ordered by descending baseline value, so the two arms' highest baselines meet at the placebo/active boundary in the centre of the plot. HWF-ORDER-003 Across the ordered participants the baseline series is non-decreasing over the placebo span and non-increasing over the active span, so the baseline trace is unimodal with its single peak at the arm boundary. HWF-ORDER-004 Participants with equal baseline values are ordered by participant identifier, so repeated renders of the same cohort produce an identical participant order. | HWF-ORDER-001..004 | #93 |
|
HWF-BAR-001/002/003/004 (floating-bar pairs, direction, the trace and its draw order) HWF-BAR-001 Each plotted participant is drawn as exactly one floating bar spanning from their baseline value to their maximum on-treatment value, with no gap between adjacent bars so the cohort reads as one continuous profile. HWF-BAR-002 A bar extends upward from the baseline trace when the participant's maximum on-treatment value exceeds their baseline, and downward when it falls below, so direction alone distinguishes a rise from a fall. HWF-BAR-003 A single continuous black line traces every plotted participant's baseline value across the ordered participants, drawn without point markers. HWF-BAR-004 The baseline trace is drawn on top of the bars, so it stays visible wherever a bar crosses it. | HWF-BAR-001..004 | #93 |
|
HWF-BOX-003/004, HWF-CTRL-003 (staged box specs, R-7 statistics, filters) HWF-BOX-003 With summary set to baseline_peak, each flanking panel shows two boxes for its arm — the distribution of baseline values and the distribution of maximum on-treatment values — so the panel summarises the shift the bars show per participant; with summary set to peak, the maximum-on-treatment box is shown alone. HWF-BOX-004 Box statistics — n, 5th percentile, first quartile, median, third quartile, 95th percentile and mean — are computed from the plotted cohort using R-7 interpolated quantiles and drawn by the library's shared box-and-whisker renderer rather than a second implementation. HWF-CTRL-003 Configured filters are rendered as controls that restrict the plotted cohort, with the plotted and excluded participant counts in the notes updating on every filter change. | HWF-BOX-003, -004 | #93 |
|
HWF-AXIS-001/002/003, HWF-BOX-002, HWF-DATA-006/007 (domain, mirroring, units) HWF-AXIS-001 The vertical axis is in the measure's absolute reporting units — not multiples of the upper limit of normal and not multiples of baseline — so participants with different baselines remain comparable on one severity scale. HWF-AXIS-002 The right-hand axis mirrors the left: both take their minimum and maximum from a single domain computation, and no dataset is plotted against the right-hand axis. HWF-AXIS-003 Both axis titles name the plotted measure and its resolved unit. HWF-BOX-002 Each flanking panel is pinned to the same vertical minimum and maximum as the main chart, so its marks are vertically registered with the bars and directly comparable to them. HWF-DATA-006 The vertical axis unit is the modal unit_col value across the plotted measure's retained records, falling back to U/L when no unit column is mapped or every unit value is blank. HWF-DATA-007 When the plotted measure carries more than one distinct unit across the cohort, a warning naming the conflicting units is rendered and the chart is suppressed, rather than plotting mixed units on a single absolute axis. | HWF-AXIS-001..003 | #93 |
|
HWF-COLOR-001..004, HWF-AXIS-004, HWF-SELECT-001 (palette, divider, band, tooltip) HWF-COLOR-001 Placebo-arm bars are blue and active-arm bars are bronze, taken from a fixed semantic arm palette rather than the library's index-cycling group palette, so a change in arm ordering cannot swap the two colours. HWF-COLOR-002 A participant flagged with new-onset jaundice is drawn green regardless of their arm, so the jaundice encoding takes precedence over the arm encoding. HWF-COLOR-003 A vertical divider marks the placebo/active boundary, and each half is captioned with its arm name and its plotted participant count. HWF-COLOR-004 The legend states that the jaundice colour overrides the arm colour, so the bar colours cannot be mistaken for a complete count of each arm. HWF-AXIS-004 When every plotted participant shares one reference range the upper limit of normal is drawn as a single horizontal line; when the reference range varies it is drawn as a shaded band spanning the cohort's minimum to maximum reference value, labelled with that range. HWF-SELECT-001 Hovering a bar shows a tooltip listing the participant identifier, arm, baseline value, maximum on-treatment value with the study day it occurred, the change from baseline in both absolute units and multiples of baseline, the participant's maximum total bilirubin in ×ULN, and their jaundice status. | HWF-COLOR-001..004 | #93 |
|
HWF-BOX-005/006/007 (the hit test, the tooltip text, the anatomy key, the description) HWF-BOX-005 Pointing at a box in a flanking panel opens a tooltip naming the arm and which box it is, and giving n and every statistic the panel draws — 5th percentile, first quartile, median, mean, third quartile, 95th percentile — plus the observed range; the hovered box is marked out from its neighbour while the tooltip is open, and the same tooltips are reachable by focusing the panel and stepping between its boxes with the arrow keys. HWF-BOX-006 Each flanking panel labels its slots — baseline and maximum on-treatment — and titles itself with its arm name and that arm's plotted participant count; the chart legend carries a drawn key naming every mark the panels use (the interquartile box, the median rule, the 5th/95th whiskers and the mean marker) and a note spelling out which box is which. HWF-BOX-007 Each flanking panel canvas carries an accessible description of its own contents — the arm, and per box the participant count, the median, the interquartile range and the 5th-to-95th-percentile span — so the summary is readable without a pointer or a screenshot. | HWF-BOX-005..007 | #83 |
|
HWF-API-002, HWF-API-003, HWF-BOX-001, HWF-CTRL-001..004, HWF-SELECT-002/003 HWF-API-002 The init, setData and setSettings methods replace the instance's data or settings, re-render, and return the instance. HWF-API-003 The resize method re-measures every chart the module owns and destroy destroys them all and empties the target element, leaving no Chart.js instance behind. HWF-BOX-001 A summary box-and-whisker panel is rendered on each flank of the main chart — placebo on the left and active on the right. HWF-CTRL-001 The control panel exposes the plotted measure, the jaundice threshold, the baseline-bilirubin cohort toggle, the upper-limit display mode and the summary mode, and changing any of them re-renders the chart and its flanking panels. HWF-CTRL-002 The control panel exposes an arm-mapping control listing every arm value present in the data, so a reviewer can designate which arm is placebo and which arms are active without editing settings. HWF-CTRL-003 Configured filters are rendered as controls that restrict the plotted cohort, with the plotted and excluded participant counts in the notes updating on every filter change. HWF-CTRL-004 A reset control restores every settings-derived control to its configured default and re-renders. HWF-SELECT-002 Clicking a bar selects that participant, highlights their bar against the rest of the cohort, and opens the participant listing. HWF-SELECT-003 A selection dispatches a participantsSelected event on the module's root element carrying the selected participant identifiers. | HWF-API-002, -003 | #93 |
|
HWF-BOX-005/006/007 (hover wiring, slot labels, panel titles, the accessible label) HWF-BOX-005 Pointing at a box in a flanking panel opens a tooltip naming the arm and which box it is, and giving n and every statistic the panel draws — 5th percentile, first quartile, median, mean, third quartile, 95th percentile — plus the observed range; the hovered box is marked out from its neighbour while the tooltip is open, and the same tooltips are reachable by focusing the panel and stepping between its boxes with the arrow keys. HWF-BOX-006 Each flanking panel labels its slots — baseline and maximum on-treatment — and titles itself with its arm name and that arm's plotted participant count; the chart legend carries a drawn key naming every mark the panels use (the interquartile box, the median rule, the 5th/95th whiskers and the mean marker) and a note spelling out which box is which. HWF-BOX-007 Each flanking panel canvas carries an accessible description of its own contents — the arm, and per box the participant count, the median, the interquartile range and the 5th-to-95th-percentile span — so the summary is readable without a pointer or a screenshot. | HWF-BOX-005..007 | #83 |
|
HWF-API-001 (module export) HWF-API-001 The library's default export collection exposes a hepWaterfall factory that is identical to the named hepWaterfall export and returns a module instance. | HWF-API-001 | #93 |
|
HWF-COHORT-001..011 (the synthetic demo cohort's invariants) HWF-COHORT-001 Every synthetic ABL- participant carries a study-day-0 baseline record for all four liver analytes, so the cohort never exercises the day-0-absent fallback path that affects 24 of 318 participants in adbds.csv. HWF-COHORT-002 The generated file carries the same column contract as adbds.csv and every participant identifier is prefixed ABL- with a site naming the cohort synthetic. HWF-COHORT-003 The cohort contains exactly two treatment arms, one placebo and one active, of 40 participants each. HWF-COHORT-004 Alanine aminotransferase carries a single cohort-wide upper limit of normal of 40 U/L and a single unit string across every record. HWF-COHORT-005 At least 55 participants have a baseline total bilirubin at or below 0.8x the upper limit of normal, and no participant falls between 0.8x and 1.0x. HWF-COHORT-006 At least 20 participants have a baseline total bilirubin above 1x the upper limit of normal, so the Table-1 baseline-jaundice exclusion has a non-empty population to report. HWF-COHORT-007 Exactly six active-arm and one placebo-arm participant develop new-onset jaundice, each combining a substantial ALT rise with a peak bilirubin of 2.5-4.0x the upper limit of normal. HWF-COHORT-008 More active-arm than placebo-arm participants show a maximum on-treatment ALT below their own baseline. HWF-COHORT-009 A participant designated as declining declines at every on-treatment visit, so the maximum on-treatment value is genuinely below baseline rather than an artefact of one visit. HWF-COHORT-010 Baseline ALT across the plotted cohort spans 1x to 8x the upper limit of normal with no gap large enough to break the baseline trace into steps. HWF-COHORT-011 Eight active-arm participants carry a maximum on-treatment ALT of three to six times their own baseline. | HWF-COHORT-001..011 | #93 |
|
HWF-FILT-001..004 (shared filter contract) HWF-FILT-001 A filter spec accepts HWF-FILT-002 HWF-FILT-003 HWF-FILT-004 | HWF-FILT-001, HWF-FILT-002, HWF-FILT-003, HWF-FILT-004 | #166 |
|
Visual evidence
Every screenshot below is a committed baseline: the same PNG is the visual-regression baseline the browser suite asserts against and the evidence artifact shown here. Click any capture for the full-resolution image.
HWF BAR 001 waterfall default HWF BOX 001 flanking summary panels HWF BOX 005 summary box hover HWF BOX 006 panel labels and anatomy key HWF COLOR 002 jaundice precedence HWF CTRL 001 control panel HWF DATA 003 cohort exclusion notes HWF DATA 007 mixed unit warning HWF SELECT 002 participant selection
Source-matrix routing status
The source matrix (hep-waterfall.md, 57 rows) is merged in the requirements repo and extracted into docs/requirements/hep-waterfall.json by npm run requirements, so the evidence page renders real requirement text rather than IDs alone. Two of its rows carry a needs-jeremy-review flag and are called out below.
The three HWF-BOX-005/006/007 rows are new with obot.roadmap#83 — user feedback on the shipped v1.5 prototype — and land in the matrix repo alongside this change; until that companion PR merges and the extract is regenerated, the evidence page shows those three IDs without their text.
- Implemented (
browser/unitabove): the settings surface and its normalization, including the two thresholds that do two different jobs —jaundice_uln(the new-onset event, 2×ULN) andbaseline_tb_max(the paper's Table-1 cohort rule, 1×ULN) — and the arm designation carried as arm _values_ rather than positions (HWF-CFG-001..005); the per-participant reduction to one baseline and one maximum on-treatment value in absolute reporting units, taken from the sharedsrc/hep-core/subjects.jsreduction so the waterfall, the migration Sankey and the composite plot can never disagree about what a participant's baseline is (HWF-DATA-001, HWF-DATA-002); the two separately counted cohort exclusions — baseline bilirubin above the Table-1 rule, and an arm designated neither placebo nor active — reported in on-page notes so the applicability rule is demonstrable evidence rather than a claim (HWF-DATA-003, HWF-DATA-005); the new-onset-jaundice predicate with both clauses evaluated (HWF-DATA-004); modal unit resolution with a mixed-unit cohort warned and suppressed rather than plotted (HWF-DATA-006, HWF-DATA-007); the counted reference-range drops (HWF-DATA-008); the ranking — placebo ascending, active descending, identifier tie-break — and the unimodal baseline-trace invariant it produces (HWF-ORDER-001..004); the floating[baseline, maximum]bars with direction alone separating a rise from a fall, under a continuous black baseline trace painted on top of them (HWF-BAR-001..004); the absolute-unit domain assigned to both the left and right axes from one computation, with the measure and its unit in both titles and the reference range drawn as a line, a band or per participant (HWF-AXIS-001..004); the fixed semantic palette with green overriding the arm colour and the legend stating that precedence out loud (HWF-COLOR-001..004); the arm divider and its per-half counts (HWF-COLOR-003); the two flanking box-and-whisker panels, drawn by the sharedsrc/box-whisker.jsrenderer from R-7 statistics and pinned to the main chart's domain (HWF-BOX-001..004); the control panel, arm mapping, filters and reset (HWF-CTRL-001..004); the tooltip, the click-to-select drill-down and theparticipantsSelectedevent (HWF-SELECT-001..003); the factory and lifecycle API (HWF-API-001..003); and the synthetic demo cohort's own invariants (HWF-COHORT-001..011).
- Two judgement calls a human reviewer must check against the published figure (recorded as open calls in the obot.roadmap#43 design §K and flagged
needs-jeremy-reviewin the matrix):
1. Participant ordering (HWF-ORDER-002, HWF-ORDER-003). The Figure 5 caption contradicts itself. Read literally, "active drug subjects run right-to-center highest-to-lowest" puts the _lowest_ active baselines at the centre, which contradicts the same sentence's controlling clause that the highest baselines meet in the centre. This implementation takes the latter as intent and pins it as a testable invariant, because it is the arrangement that makes the figure readable — the two arms' comparable participants sit next to each other at the seam. 2. Two boxes per flanking panel (HWF-BOX-003). The caption says only "summary box-and-whisker plots, one per arm" and never states how many boxes each panel carries. This implementation reads the panel's job as summarising the _shift_ — the arm-level answer to the question the bars answer per participant — and draws a baseline box and a maximum-on-treatment box. The summary: 'peak' setting exposes the single-box alternative.
- Deferred (recorded costs, not part of the claim): selection does not carry between
hep-waterfallandhep-explorer— the two modules serve different trials, and a cross-link in the gallery and the guides is all the relationship they get. The figure's own acknowledged limitation is not engineered around either: using the maximum on-treatment value can miss a drug-related rise that is smaller than a preceding decline, so a participant who falls from 300 to 60 U/L and then climbs back to 250 draws a bar that points _down_. Reviewing the participant's trajectory — click the bar for their records — is the mitigation.
Demo data
The demo runs on site/data/adbds-abnbl.csv, a fully synthetic 80-participant cohort with no published source, because the shared adbds.csv extract verifiably cannot carry this figure: after the paper's baseline-bilirubin exclusion, zero of its 234 surviving participants reach a baseline ALT of 3×ULN, it holds two new-onset-jaundice participants in total, and its baseline trace is flat and discontinuous. Provenance, composition and the regeneration command are in DATA_SOURCES.md; the cohort's invariants are asserted against the committed CSV by tests/unit/hep-waterfall/abnbl.test.js (HWF-COHORT-001..011), so a regeneration that loses the signal fails the suite rather than quietly degrading the demo.
Reproducing this report
The evidence set is regenerated from a full test run and committed with the code it qualifies; CI fails when they drift. To verify or rebuild it:
npm ci
npm run evidence:check   # compare a fresh run against the committed evidence
npm run evidence         # regenerate docs/evidence/hep-waterfall/evidence.json
Screenshot baselines are canonical to the Linux CI runner; the repository's Update evidence baselines workflow is the authoritative way to refresh them. See CONTRIBUTING.md for the traceability convention.