Safety Histogram: test evidence Safety Histogram is exploratoryQualifiedValidated for regulated use. Nothing in safety.viz is, yet.ExploratoryThis chartTested and documented. Confirm every result.ExperimentalTested and documented, but what it shows or how it behaves may still change.PrototypeAn early look, on the docs site only. Not in the demo app.What each rung means
Requirement-traced qualification evidence for the safety.viz histogram module.
Requirement matrix ↗ — the reviewed source specification these tests trace to.
- Scope
- 46 coverage rows71 distinct requirement IDs
- Tests executed
- 1256 automated checks202 browser · 1054 unit
- Result
- pass all passing19 evidence screenshots
- Generated
- 2026-10-10 18:05 UTC
- Environment
linux 6.17.0-1022-azure · node v22.23.3 · playwright 1.61.1 · chromium 149.0.7827.55- Test run
- Actions run #38072575214
Scope & approach
Traceability for the histogram module (extracted from the safety-histogram pilot, dev @ a3ff9f7, under #2), per the convention in CONTRIBUTING.md. Two requirement-ID schemes appear:
- Module IDs (
SH-CTRL-*,SH-CHART-*,SH-LIST-*,SH-DATA-*,SH-API-*) — the pilot's condensed matrix, used by design #2's decomposition mapping. - Source matrix rows (
SH-FUNC-*,SH-REG-*,SH-CFG-*, …) — the reviewed matrix atrequirements/safety-histogram.md, whoseEvidence Typecolumn routes rows (unit→ Vitest,browser→ Playwright).SH-OVW-*rows are post-pilot additions — the all-measures overview (#39) is new capability beyond the original renderer.
Each table row traces one requirement to the automated test(s) that evidence it: the Requirement column shows the reviewed requirement text and its ID, the source-matrix rows link back to the specification, the issue column links the implementing work, and the result column shows the recorded outcome of every matching test from the committed evidence.json with its captured screenshots. Browser evidence is captured at fixed conditions (1280×800, device scale 1) on the canonical Linux CI environment.
Browser evidence (Playwright — tests/e2e/histogram.spec.js)
29 requirement rows · 28 tests
| Requirement | Source matrix rows | Issue | Tests & evidence |
|---|---|---|---|
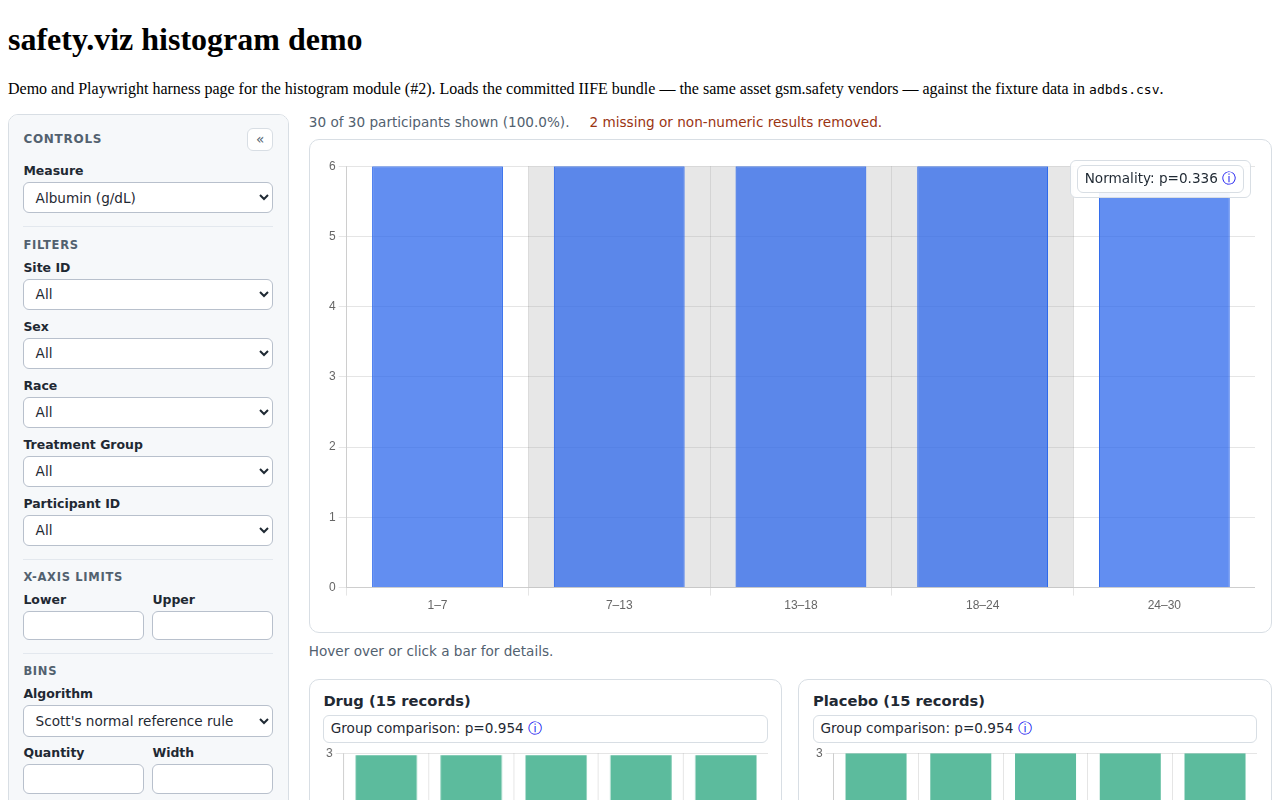
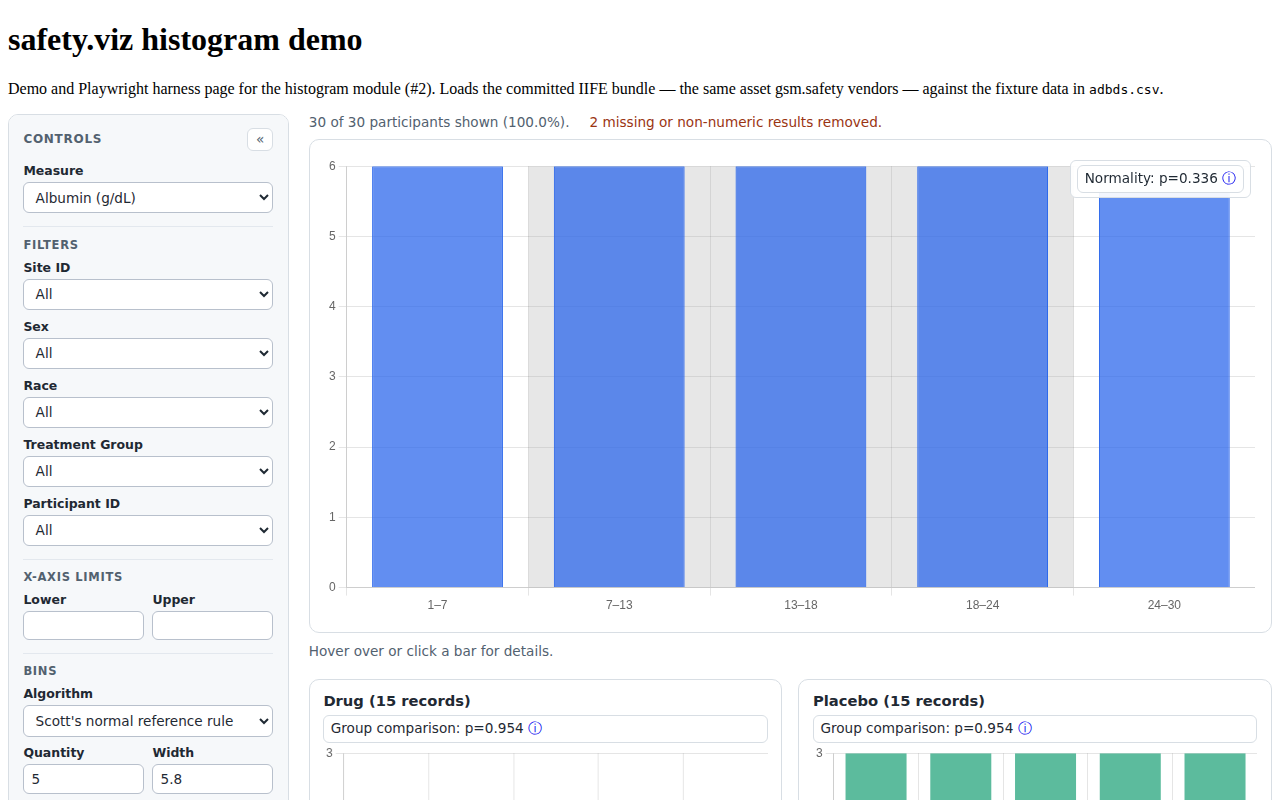
SH-CTRL-001/SH-CTRL-002/SH-CTRL-006 SH-FUNC-001 This drop-down menu is used to filter the lab variable that is displayed in the chart. The default measure is set to the first variable in the data set, but the default value can be adjusted to any measure upon the project team's request. Users can select any pre-defined measure in this filter. Selecting a measure will display the range of the measure and the number of observations collected for this variable. SH-FUNC-002 The chart can be configured to have any number of data filters. Each specified filter has a drop-down menu that is used to filter the visit data that is displayed in the chart. | SH-FUNC-001, SH-FUNC-002 | #2 |
  |
SH-CTRL-003 SH-FUNC-003 Displayed under the header, this statement provides the total number of participants in the data set in integers as well as the percentage of participants shown to one decimal place. In the default view, all participant data is included in the chart, or 100%, unless the project team requests otherwise. When filters are used, the data shown in the histogram is manipulated and the number of participant records shown at the top of the page may increase or decrease, depending on the variable selected. | SH-FUNC-003 | #2 |
|
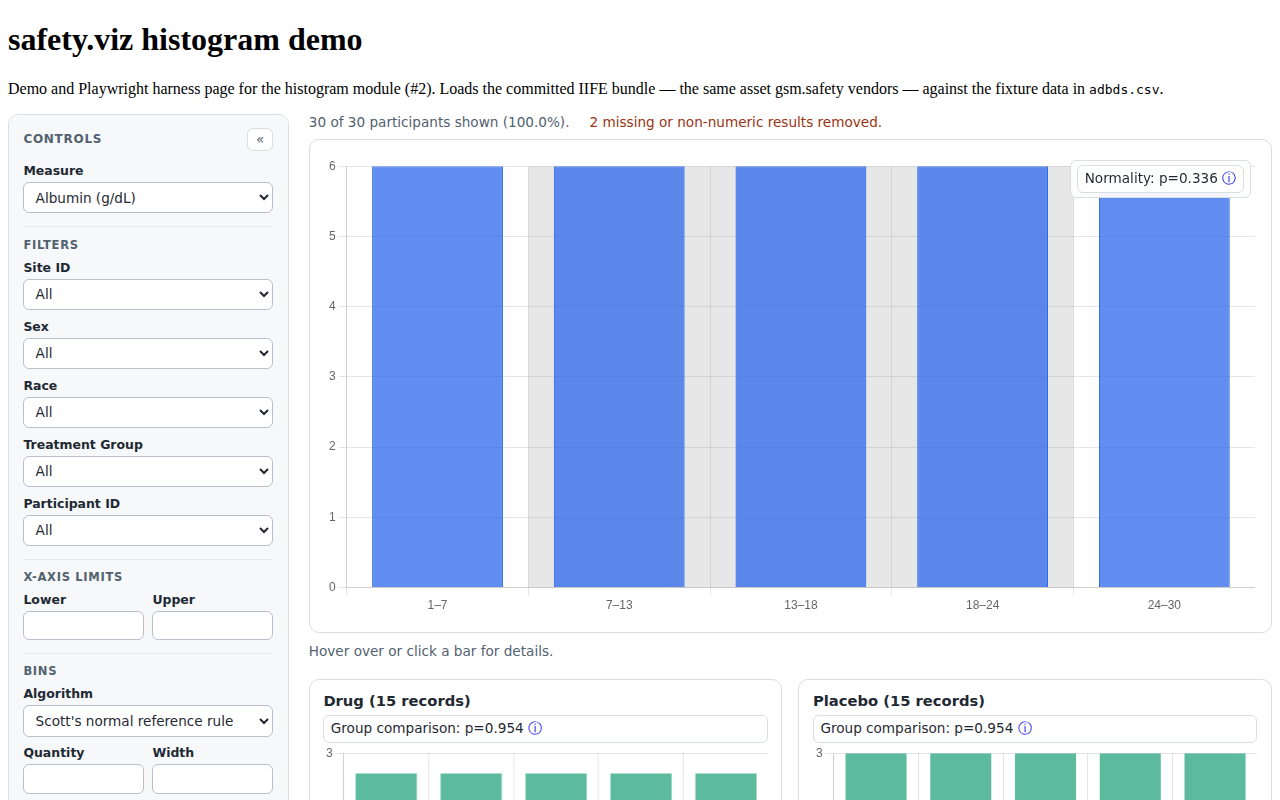
SH-DATA-002 SH-CFG-005 a variable that contains the results for each medical sign; non-numeric results are removed with a notification thrown to the log SH-DATA-002 The following data specs and chart settings can be used to create a chart with several custom filters, including Sex, Race and Query Status. A sample chart using this configuration is found here. | SH-CFG-005 | #2 |
 |
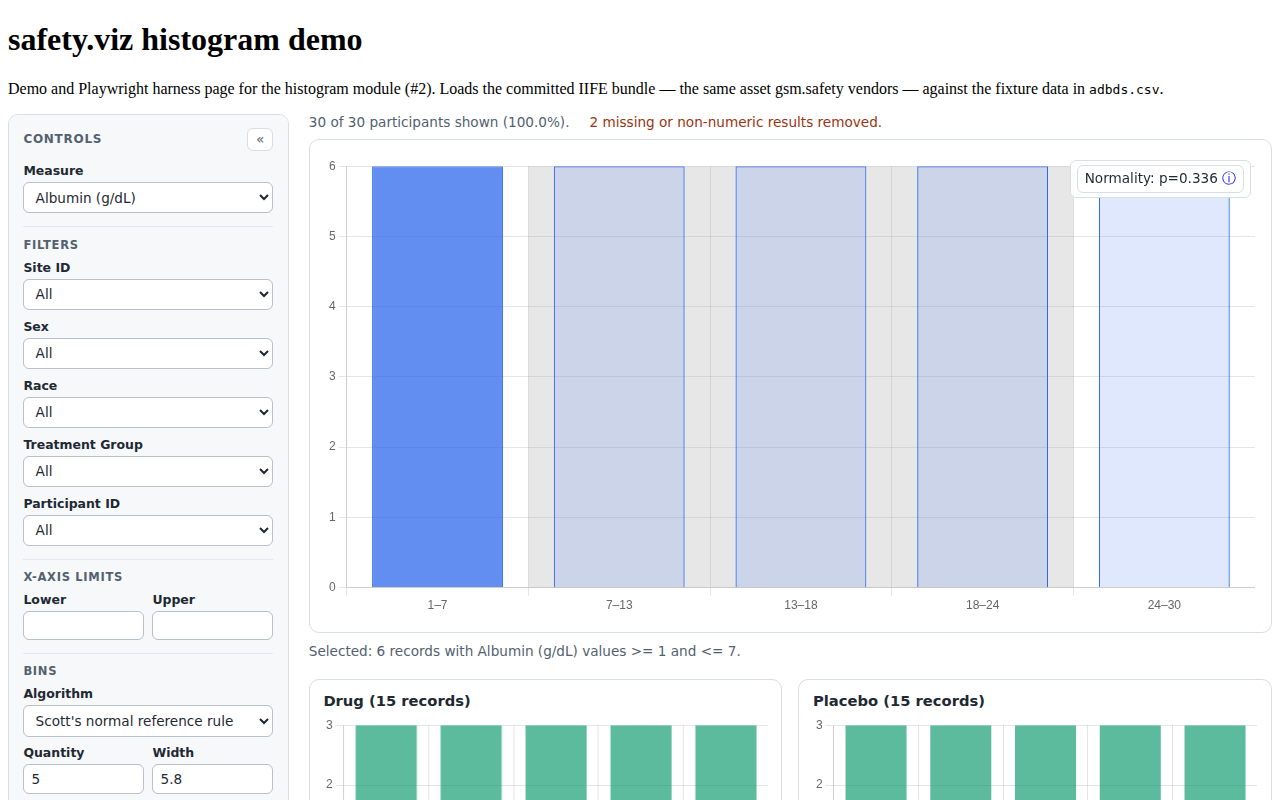
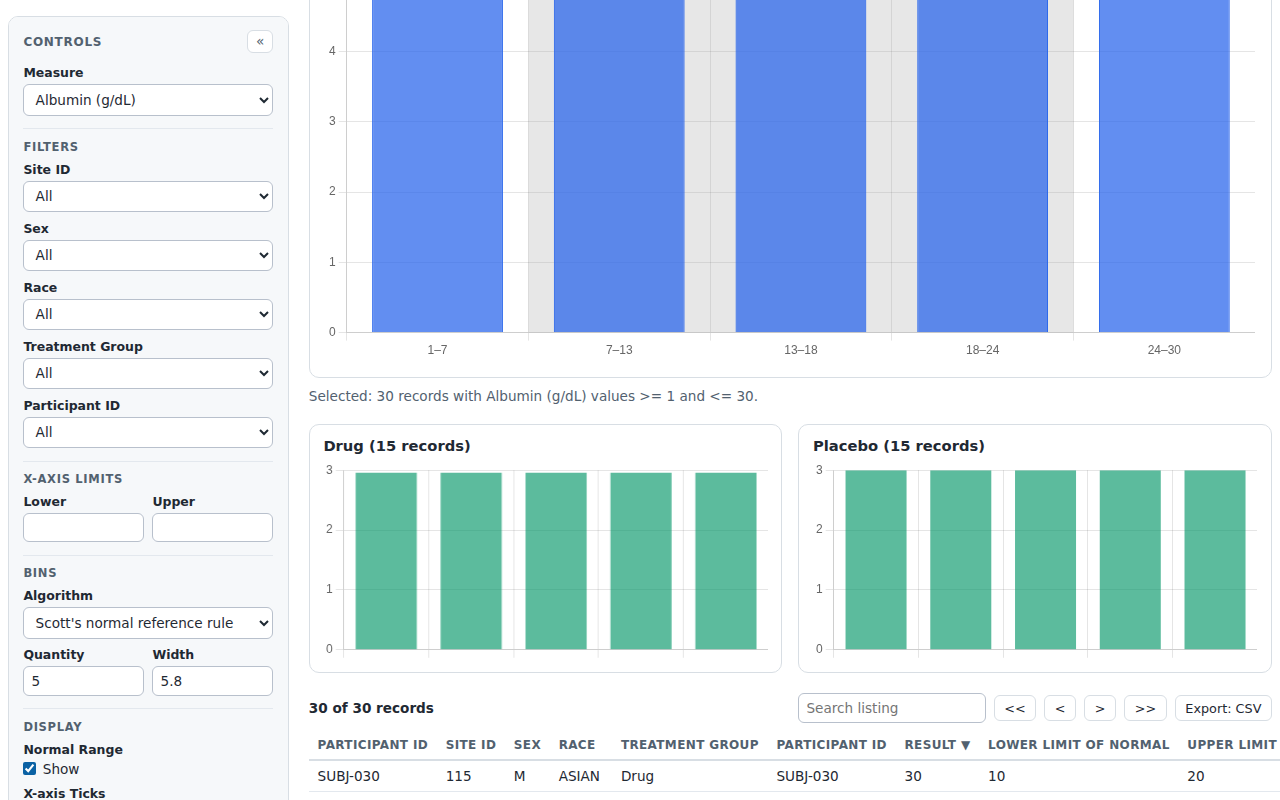
SH-CHART-003 SH-FUNC-008 Clicking on a bar in the chart will open a table below the chart that contains a detailed listing of participant records. This linked table contains a standard set of default columns that appear consistently across all filters. When a bar is clicked the other available bars lighten, the table header defines the data included in the table, and the records appear in a table below the chart. When a user clicks outside of a bar, the detailed table disappears and the table header will prompt the user to "Click a bar for details." SH-FUNC-010 When a histogram bar is clicked, display the raw data records represented by that bar in the linked detail table, including subject identifier, result, lower limit of normal, and upper limit of normal. SH-FUNC-012 When a histogram bar is selected, display the number of records represented by that bar underneath the chart. | SH-FUNC-008, SH-FUNC-010, SH-FUNC-012 | #2 |
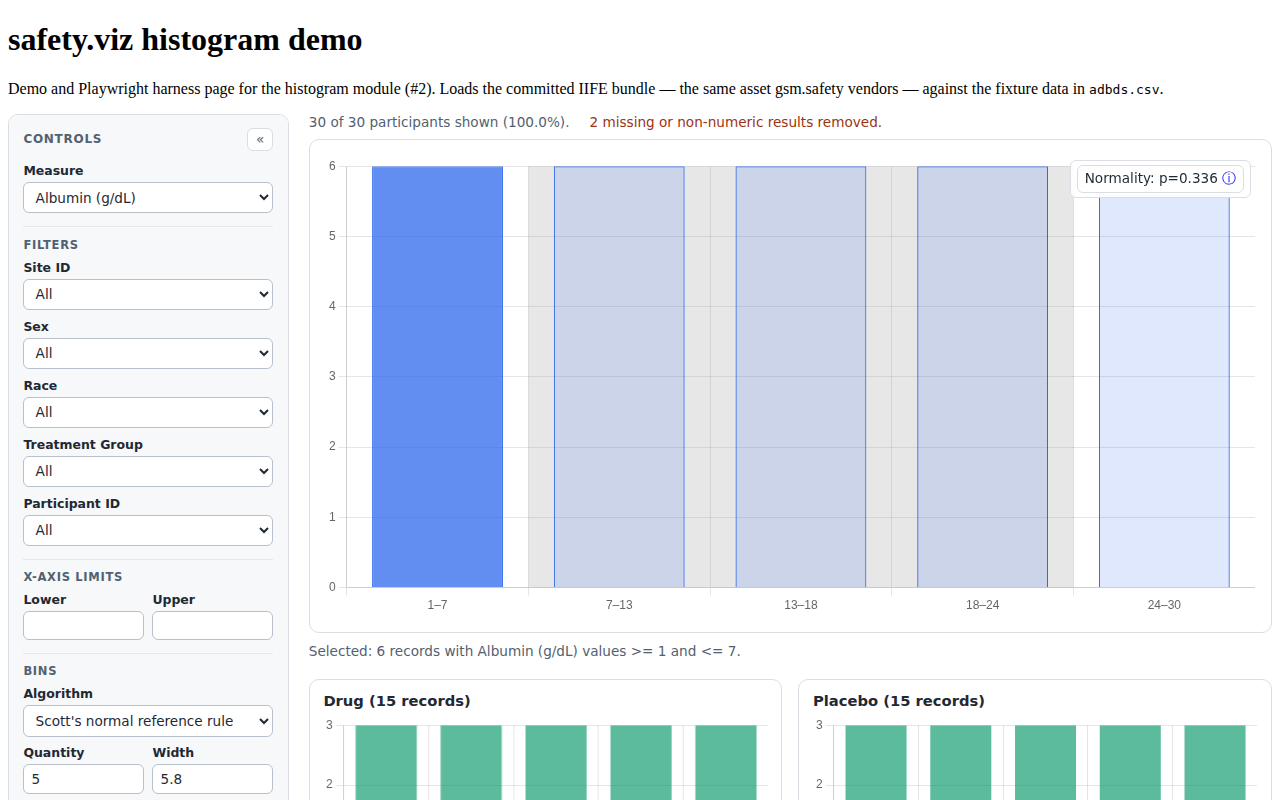 |
— SH-FUNC-011 When a histogram bar is selected, visually de-emphasize/lighten all bars not represented in the linked detail table. | SH-FUNC-011 | #2 |
 |
SH-LIST-001/002/003/004 SH-FUNC-008 Clicking on a bar in the chart will open a table below the chart that contains a detailed listing of participant records. This linked table contains a standard set of default columns that appear consistently across all filters. When a bar is clicked the other available bars lighten, the table header defines the data included in the table, and the records appear in a table below the chart. When a user clicks outside of a bar, the detailed table disappears and the table header will prompt the user to "Click a bar for details." | SH-FUNC-008 | #2 |
 |
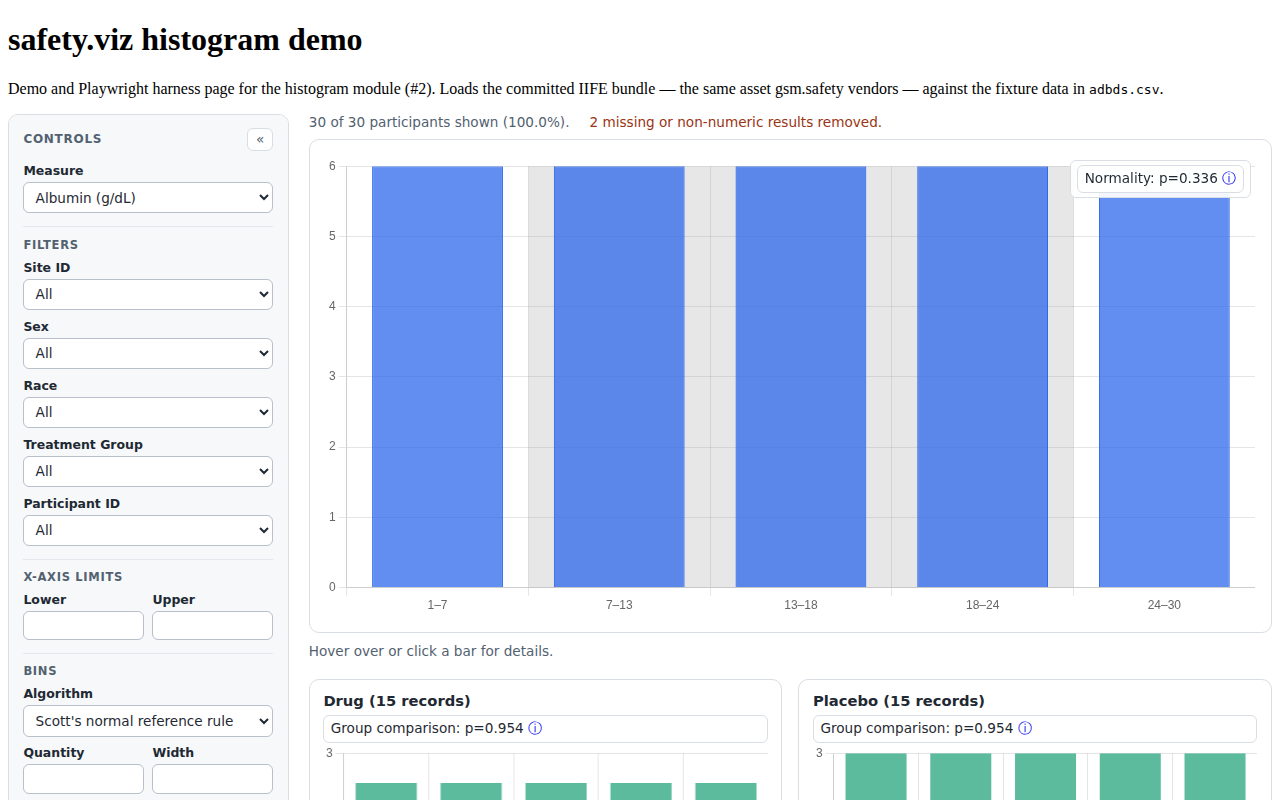
SH-CTRL-004 SH-FUNC-004A When normal ranges are enabled for the selected measure, render a gray normal-range band/rectangle behind histogram data using the measure lower and upper normal limits. SH-FUNC-004B Normal ranges are hidden by default and can be shown by activating the Normal Range checkbox/control above the chart. | SH-FUNC-004A, SH-FUNC-004B | #2 |
 |
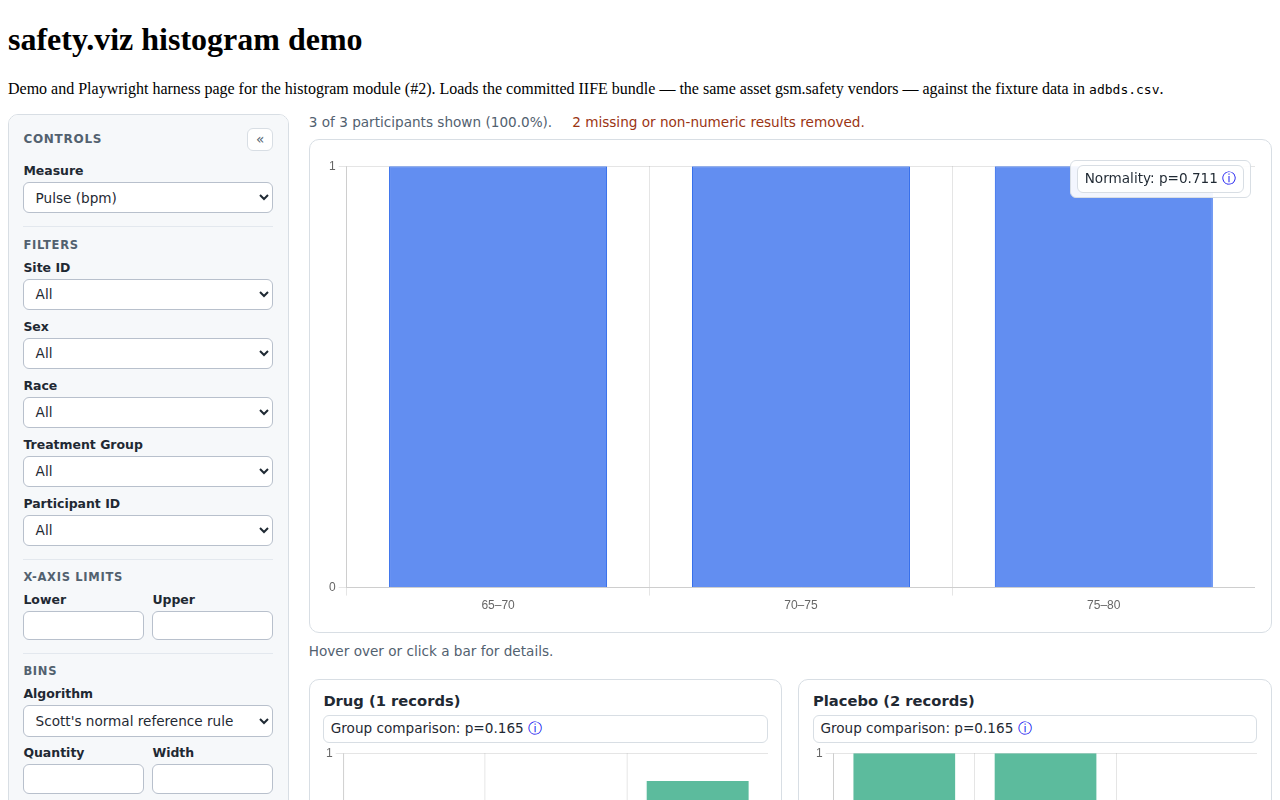
— SH-FUNC-004C If the selected measure does not include lower/upper normal range data, the Normal Range control is unavailable/hidden. | SH-FUNC-004C | #2 |
 |
SH-CTRL-005 SH-FUNC-005A The Lower Limit input updates the histogram x-axis minimum for the selected measure. SH-FUNC-005B The Upper Limit input updates the histogram x-axis maximum for the selected measure. SH-FUNC-005D Typed x-axis limit changes apply when the input loses focus, and the histogram redraws to reflect valid updated limits. | SH-FUNC-005A, SH-FUNC-005B, SH-FUNC-005D | #2 |
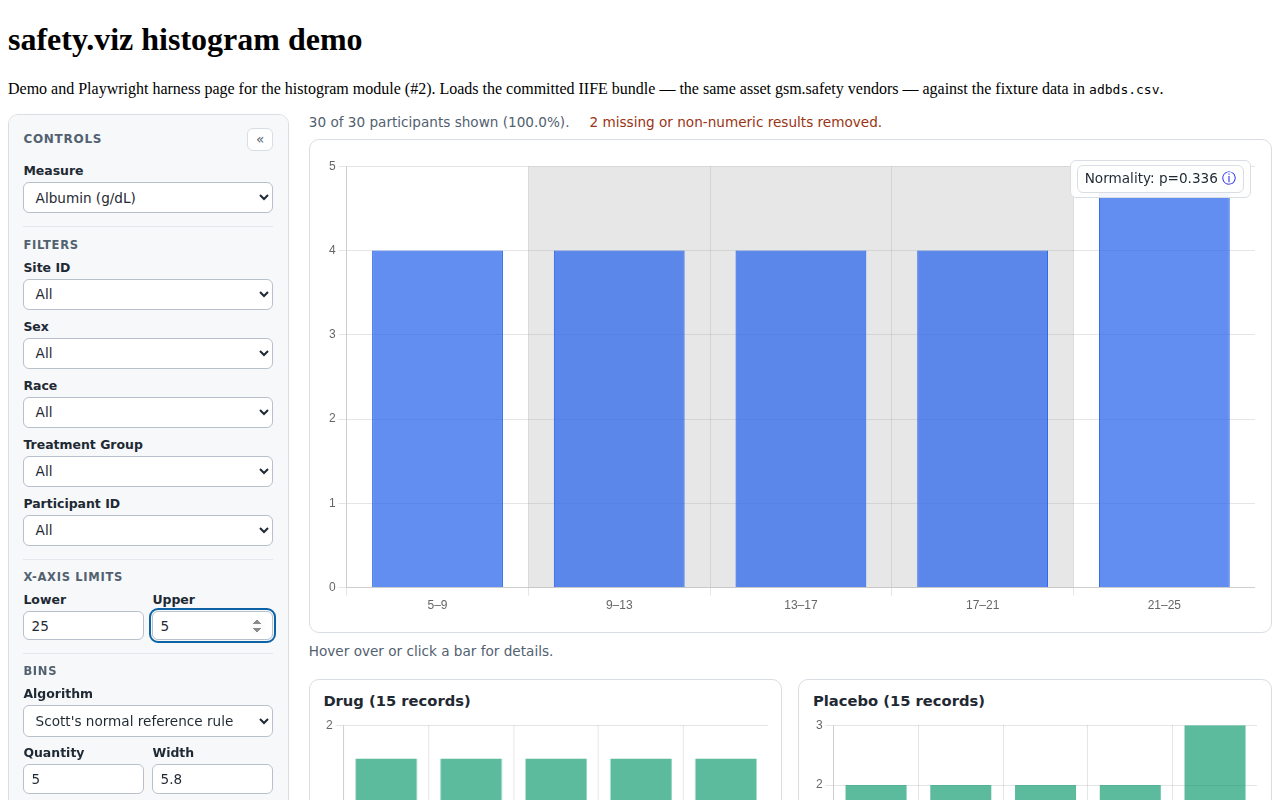 |
— SH-FUNC-005C X-axis limit inputs support increment/decrement stepper behavior by 1 where the browser/control supports steppers. | SH-FUNC-005C | #2 |
|
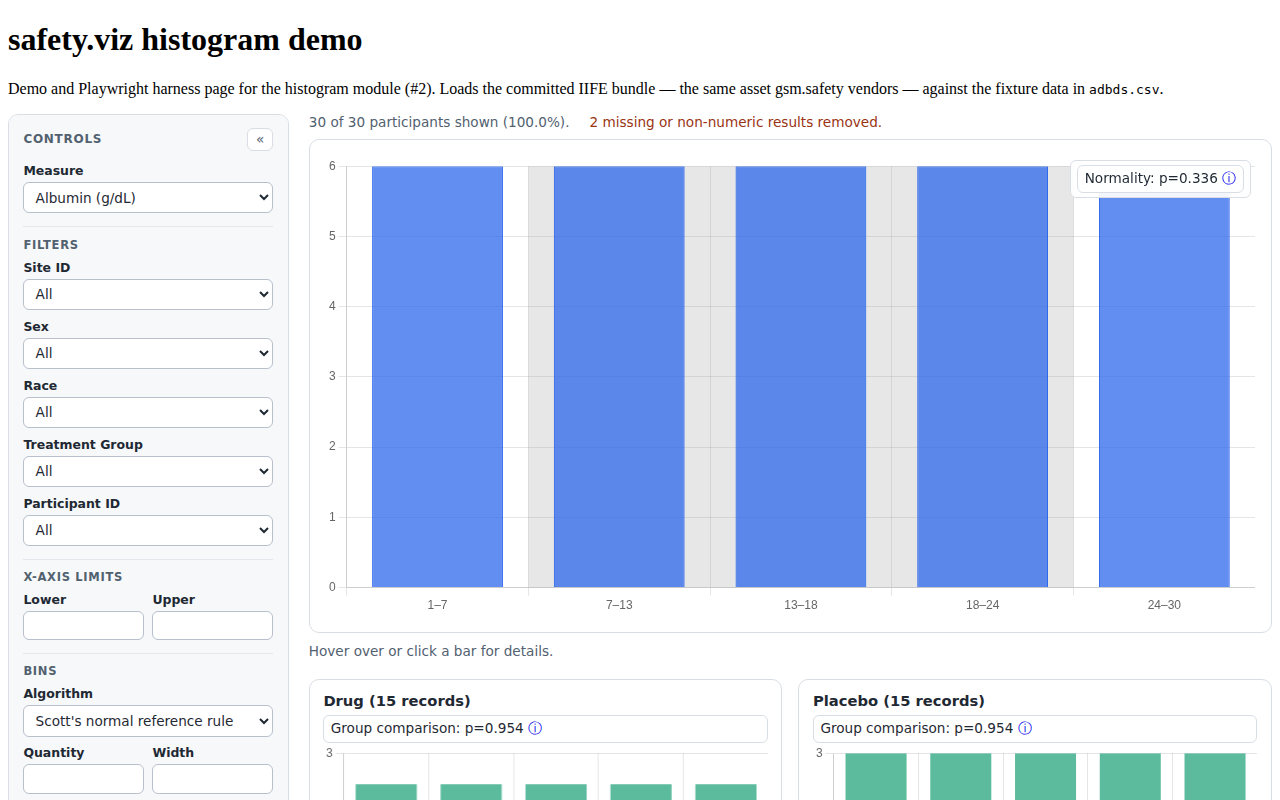
SH-CTRL-007 | — | #2 |
 |
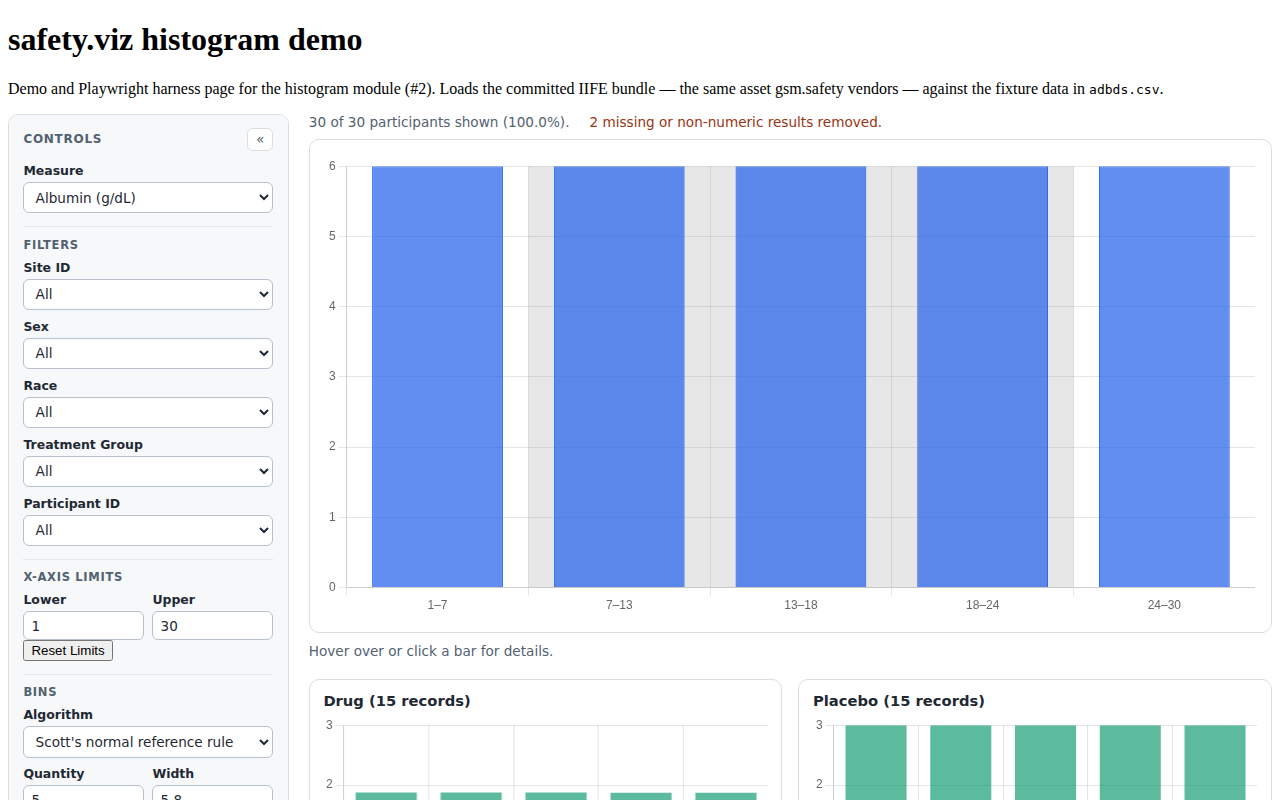
SH-CHART-008 | — | #188 |
 |
SH-CHART-005/006/007 | — | #188 |
|
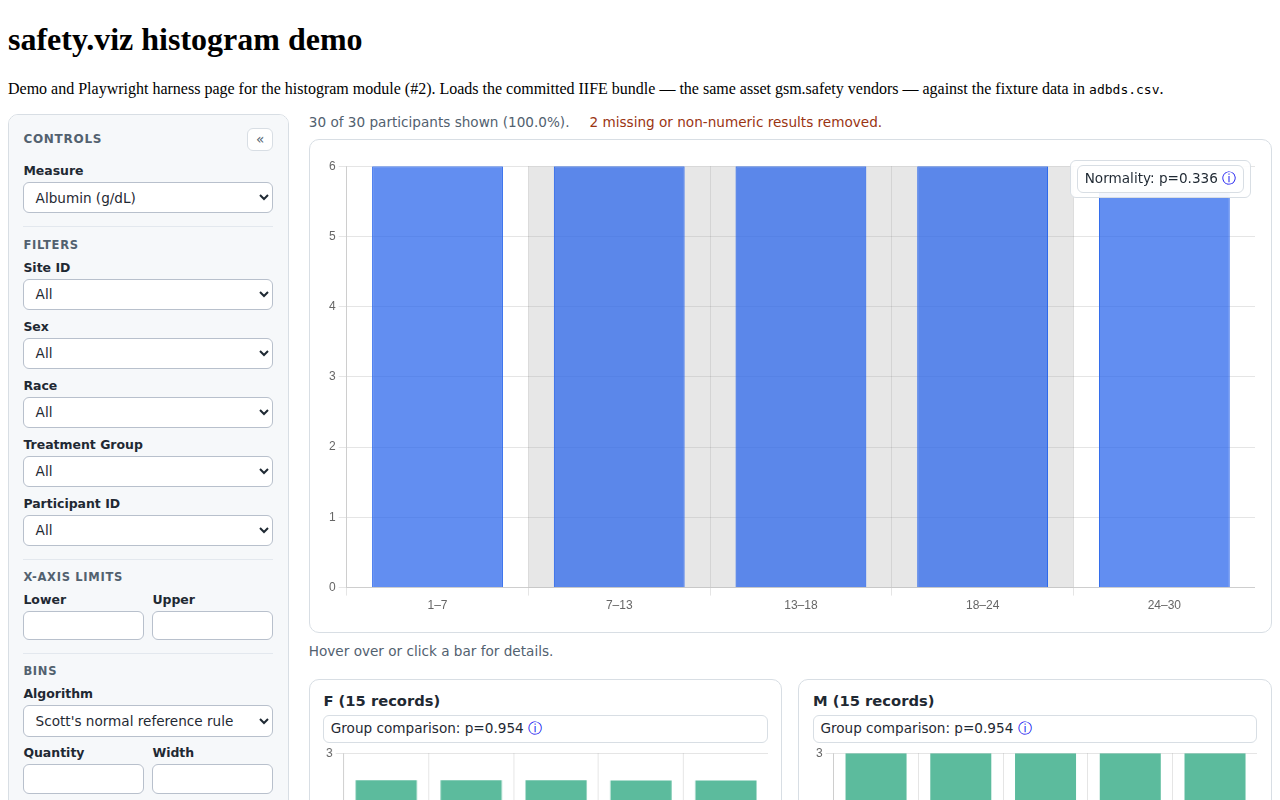
SH-CHART-004 | — | #2 |
 |
SH-CHART-004/SH-CTRL-006 | — | #19 |
|
SH-CTRL-006 | — | #19 |
|
SH-CTRL-008 SH-REG-024 Confirm that if you select an algorithm other than "Custom", the following occurs: The algorithm returns the number of bins and the width of each bin, the Quantity and Width inputs update accordingly, the info icon updates with a link to an description of the algorithm SH-REG-025 Confirm the number of bins in the Quantity input matches the number of bars in the chart SH-REG-026 Confirm the width of each bin in the Width input matches the width of the bars in the chart | SH-REG-024, SH-REG-025, SH-REG-026 | #19 |
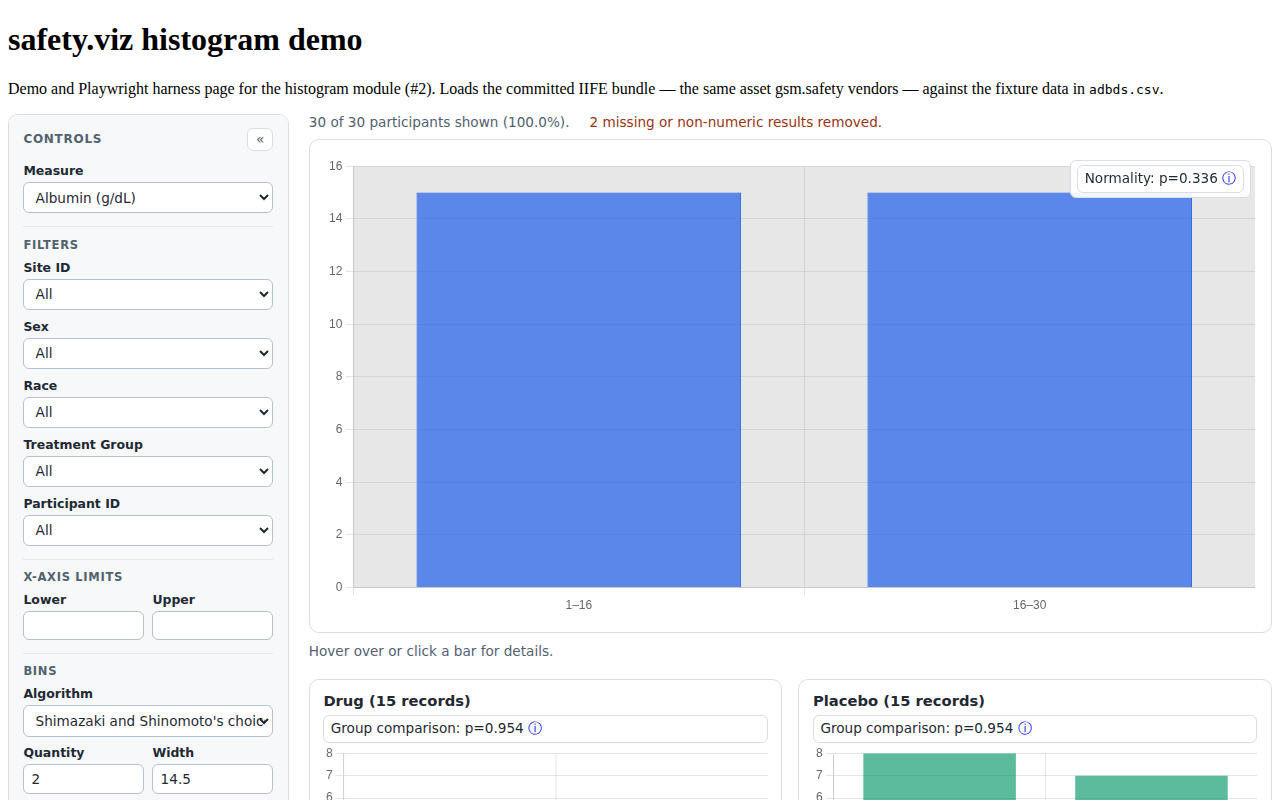 |
SH-CTRL-008 SH-REG-020 Confirm changing the Quantity sets the Algorithm control to Custom and sets the Width input to the range of the data divided by the number of bins | SH-REG-020 | #19 |
|
SH-API-001 (module scheme) SH-API-001 a factory to create a custom Webcharts chart object | — (see legacy-API note) | #2 |
|
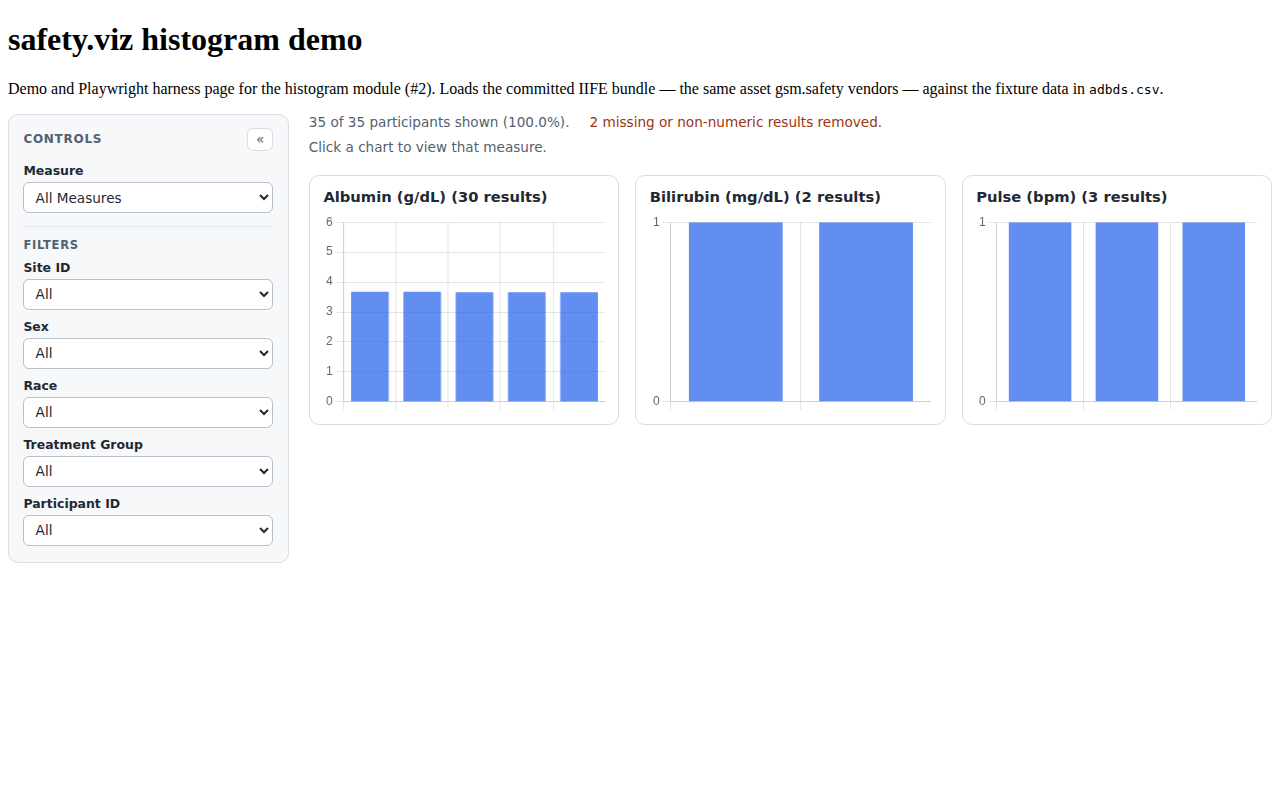
— SH-OVW-001 The Measure control offers an "All Measures" option, selected by default when start_value is not set: the chart opens on an all-measures overview. An explicit start_value opens on that measure; an unknown start_value warns and falls back to the overview. | SH-OVW-001 | #39 |
|
— SH-OVW-001 The Measure control offers an "All Measures" option, selected by default when start_value is not set: the chart opens on an all-measures overview. An explicit start_value opens on that measure; an unknown start_value warns and falls back to the overview. | SH-OVW-001 | #39 |
|
— SH-OVW-002 The overview renders one small-multiple histogram per measure in the cleaned data, in Measure-control order, each independently binned over the measure's full value range with the configured bin algorithm. Each panel is titled with the measure name and its result count. | SH-OVW-002 | #39 |
 |
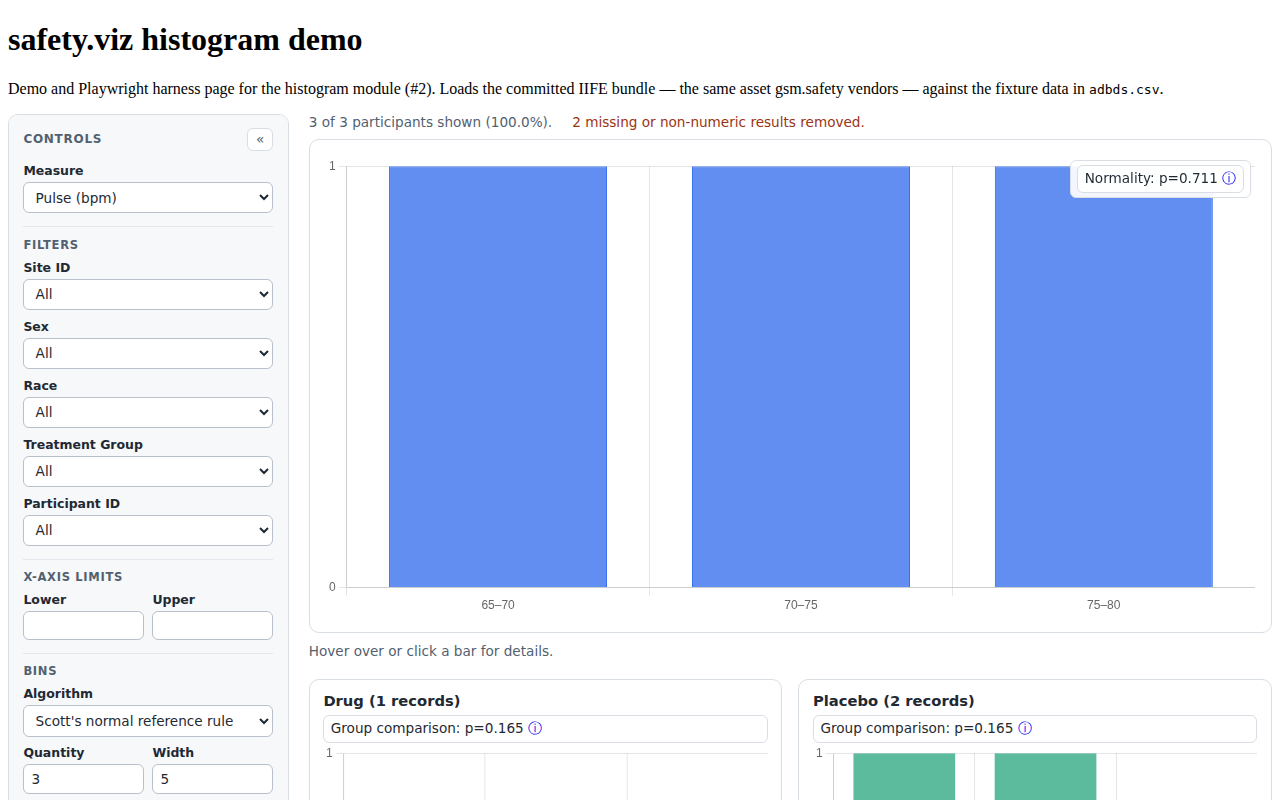
— SH-OVW-003 Clicking a small multiple (or pressing Enter/Space on the focused panel) opens the standard single-measure view for that measure and syncs the Measure control; the overview footnote reads "Click a chart to view that measure." | SH-OVW-003 | #39 |
 |
— SH-OVW-004 Selecting "All Measures" in the Measure control returns from any single-measure view to the overview. | SH-OVW-004 | #39 |
|
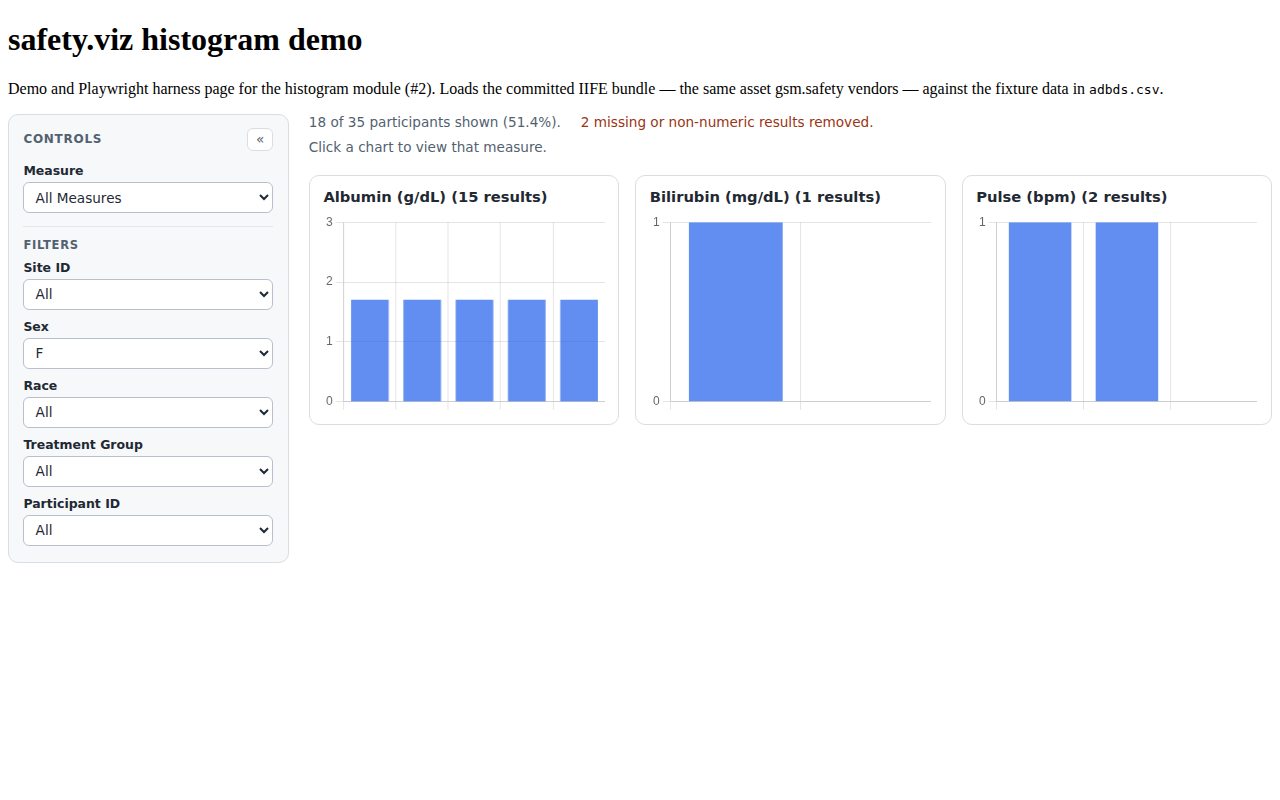
— SH-OVW-005 Filters stay active in the overview and re-render the panels; the x-axis limit, bin, display, and grouping controls are hidden in the overview and restored unchanged in the single-measure view. | SH-OVW-005 | #39 |
 |
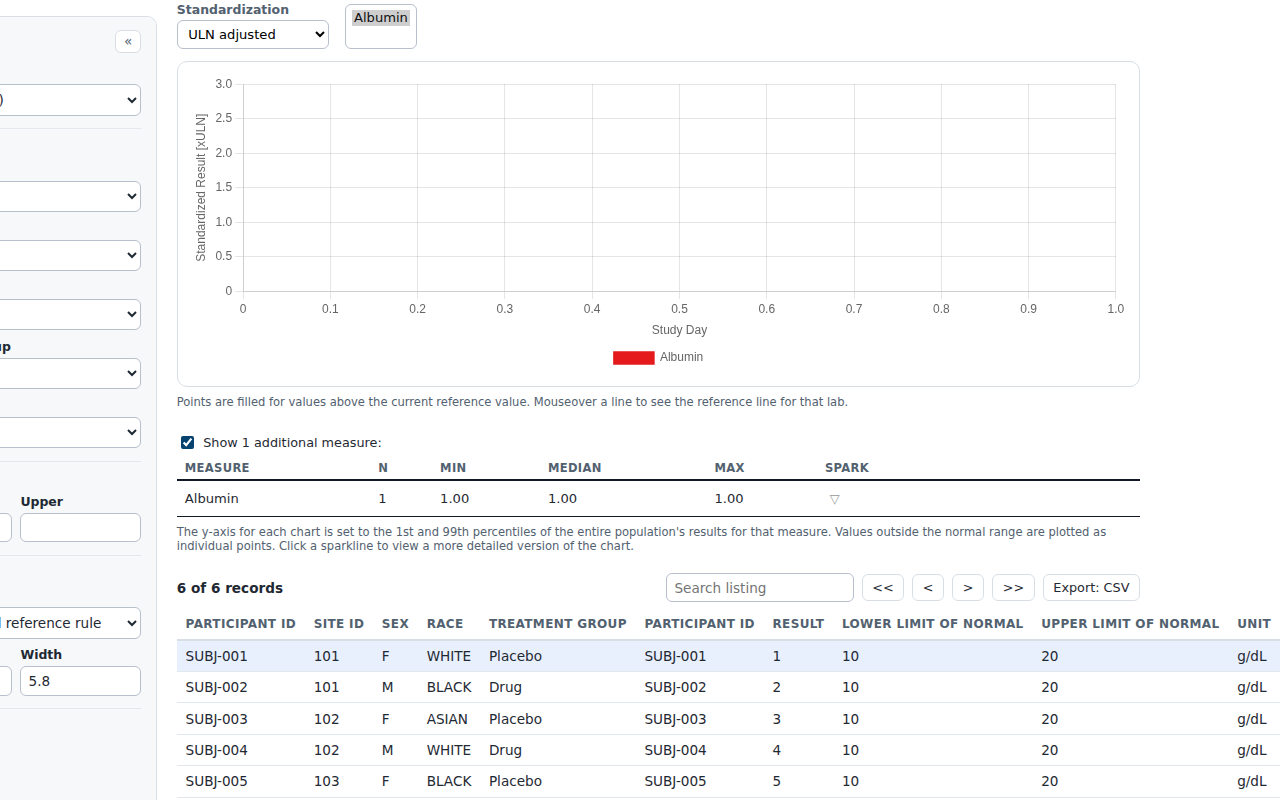
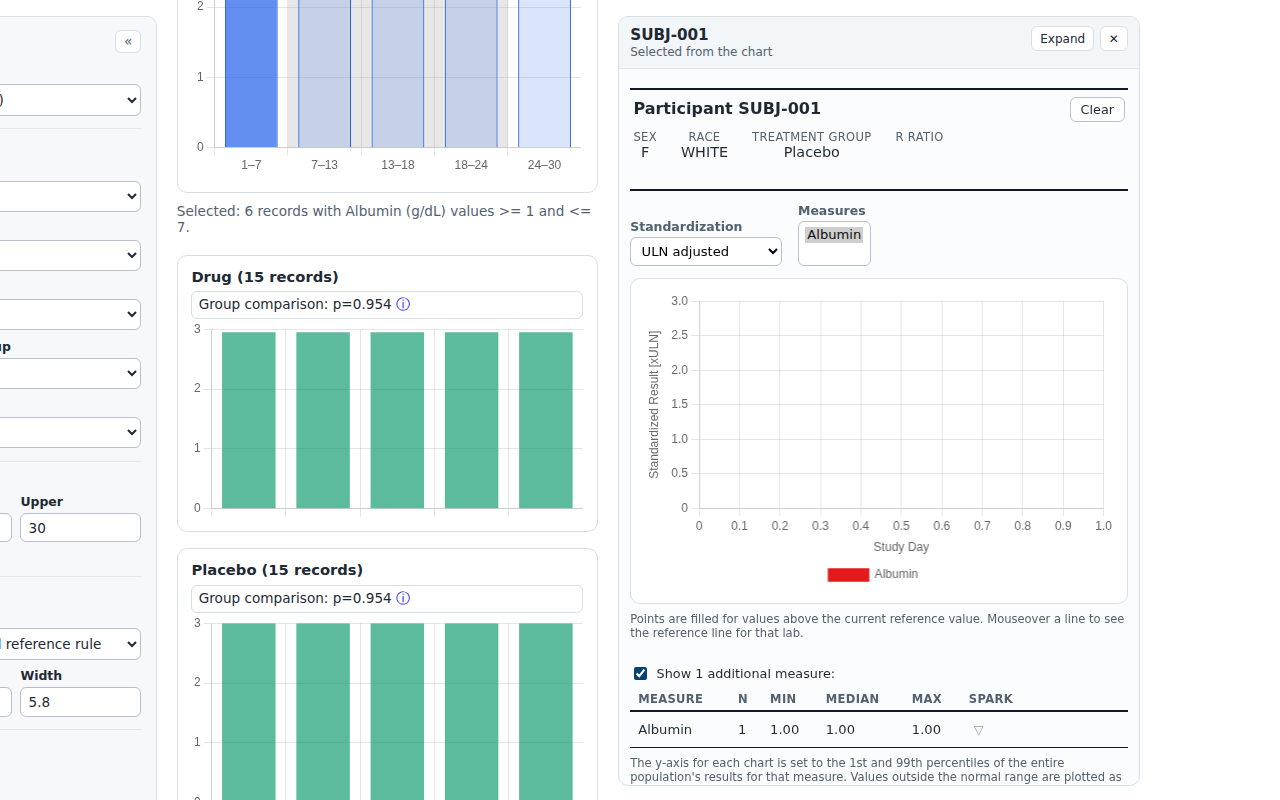
PPRF-SH-001/PPRF-SH-002 | PPRF-SH-001, PPRF-SH-002 (participant-profile matrix) | #99 |
  |
PPRF-SH-003 | PPRF-SH-003 (participant-profile matrix) | #99 |
|
PPRF-SH-003 (bin/control clears) | PPRF-SH-003 (participant-profile matrix) | #99 |
|
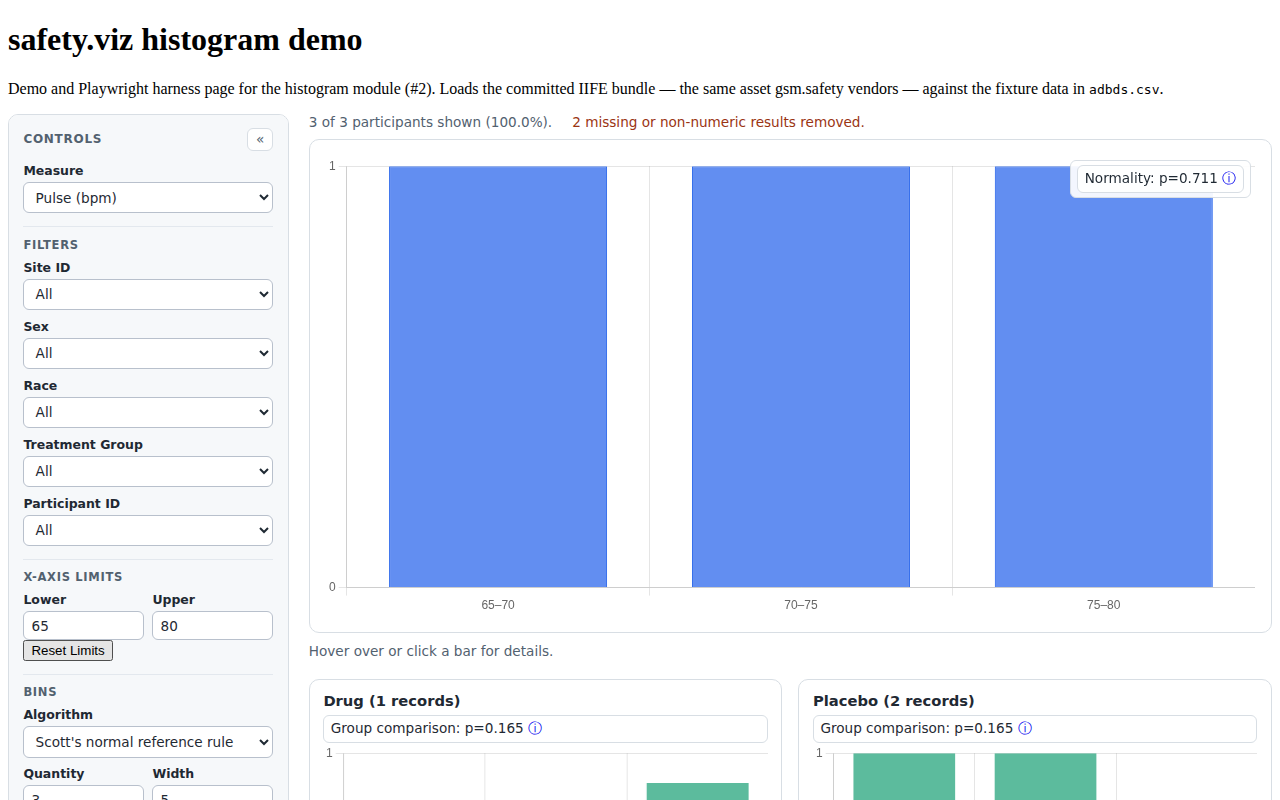
SH-AXIS-001/002/003 SH-AXIS-001 On load and after every render, each X-axis Limits input displays the limit currently in force for the selected measure — the measure's data extent by default, or the user's override — formatted to three significant figures of the axis range. Neither box is ever blank. SH-AXIS-002 Displaying a limit does not pin it. A limit the user has not edited remains automatic — it is re-derived from the data on every render, so changing the measure, the filters, or the y-axis scale updates the value shown — while an edited limit persists as an override until it is reset. The distinction is held in state (an override slot separate from the recorded domain), not inferred from an empty input. SH-AXIS-003 The Reset Limits control clears both x-axis limits overrides and repopulates both inputs with the derived limits, so there is always a way back to automatic now that an empty box no longer means it. SH-FUNC-006 Users can change the upper and lower x-axis limits back to the default values for a measure by selecting the "Reset Limits" button. Pressing the button will erase the current values in the upper and lower limit boxes and replace them with defaults. The chart below will also reflect the changes and will show the default axes. | SH-AXIS-001, SH-AXIS-002, SH-AXIS-003, SH-FUNC-006 | #85 |
 |
Unit evidence (Vitest — tests/unit/histogram/)
17 requirement rows · 90 tests
| Requirement | Source matrix rows | Issue | Tests & evidence |
|---|---|---|---|
SH-CFG-004..009 (defaults) SH-CFG-004 a variable that contains the names of each medical sign SH-CFG-005 a variable that contains the results for each medical sign; non-numeric results are removed with a notification thrown to the log SH-CFG-006 a variable that contains IDs for each participant SH-CFG-007 a variable that contains the units of each medical sign SH-CFG-008 a variable that contains the lower limit of normal of the medical sign SH-CFG-009 a variable that contains the upper limit of normal of the medical sign | SH-CFG-004..009 | #2 |
|
SH-CFG-010/011, SH-CHART-004 SH-CFG-010 an array of variables and metadata that will appear in the controls as data filters SH-CFG-011 an array of variables and metadata that will appear in the data listing | SH-CFG-010, SH-CFG-011 | #2 |
|
SH-CFG-013/014 SH-CFG-013 a boolean that dictates whether the normal range control will be generated SH-CFG-014 a boolean that dictates whether the normal range will be displayed initially | SH-CFG-013, SH-CFG-014 | #2 |
|
SH-DATA-001/002 SH-CFG-005 a variable that contains the results for each medical sign; non-numeric results are removed with a notification thrown to the log SH-DATA-001 The Safety Histogram accepts JSON data of the format returned by SH-DATA-002 The following data specs and chart settings can be used to create a chart with several custom filters, including Sex, Race and Query Status. A sample chart using this configuration is found here. | SH-CFG-005 | #2 |
|
SH-CTRL-002/005/006 SH-FUNC-004C If the selected measure does not include lower/upper normal range data, the Normal Range control is unavailable/hidden. | SH-FUNC-004C (detection) | #2 |
|
SH-CTRL-006 (original QC) | — | #19 |
|
SH-CTRL-005/007 SH-FUNC-005A The Lower Limit input updates the histogram x-axis minimum for the selected measure. SH-FUNC-005B The Upper Limit input updates the histogram x-axis maximum for the selected measure. | SH-FUNC-005A, SH-FUNC-005B | #2 |
|
SH-AXIS-001/002/003/004 SH-AXIS-001 On load and after every render, each X-axis Limits input displays the limit currently in force for the selected measure — the measure's data extent by default, or the user's override — formatted to three significant figures of the axis range. Neither box is ever blank. SH-AXIS-002 Displaying a limit does not pin it. A limit the user has not edited remains automatic — it is re-derived from the data on every render, so changing the measure, the filters, or the y-axis scale updates the value shown — while an edited limit persists as an override until it is reset. The distinction is held in state (an override slot separate from the recorded domain), not inferred from an empty input. SH-AXIS-003 The Reset Limits control clears both x-axis limits overrides and repopulates both inputs with the derived limits, so there is always a way back to automatic now that an empty box no longer means it. SH-AXIS-004 Pre-filling must not let an invalid domain reach the chart: a limit typed across the other limit as currently displayed is swapped rather than inverted, an empty or non-numeric entry returns that limit to automatic, and a log-scale domain stays positive. | SH-AXIS-001, SH-AXIS-002, SH-AXIS-003, SH-AXIS-004 | #85 |
|
SH-CHART-002 SH-FUNC-011 When a histogram bar is selected, visually de-emphasize/lighten all bars not represented in the linked detail table. | SH-FUNC-011 (colors) | #2 |
|
SH-LIST-002/003/004 | — | #2 |
|
SH-DATA-001/003 (schema) | SH-DATA-001 | #2 |
|
SH-API-001 (module export) SH-API-001 a factory to create a custom Webcharts chart object | — | #2 |
|
PPRF-SH-001/002/003 | PPRF-SH-001..003 (participant-profile matrix) | #99 |
|
SH-MEAS-001/002 (measures whitelist) SH-MEAS-001 The SH-MEAS-002 A configured measure absent from the data is dropped from the Measure control with a console warning naming it; when none of the configured measures is present the control falls back to every measure in the data rather than rendering empty. | SH-MEAS-001, SH-MEAS-002 | #136 |
|
SH-FILT-001..004 (shared filter contract) SH-FILT-001 A filter spec accepts SH-FILT-002 SH-FILT-003 SH-FILT-004 | SH-FILT-001, SH-FILT-002, SH-FILT-003, SH-FILT-004 | #166 |
|
SH-CTRL-009 (whole-chart reset) SH-CTRL-009 A reset control at the foot of the control panel restores every settings-derived control to its configured default, re-runs the measure fallback, clears the bar selection and the linked listing, and re-renders. Re-running the fallback is the load-bearing half: a | — | #136 |
|
SH-CHART-008 (removed p-value settings) | — | #188 |
|
Railed participant profile (#99, PPRF-SH)
0 requirement rows · 0 tests
| Requirement | Source matrix rows | Issue | Tests & evidence |
|---|
Visual evidence
Every screenshot below is a committed baseline: the same PNG is the visual-regression baseline the browser suite asserts against and the evidence artifact shown here. Click any capture for the full-resolution image.
PPRF SH 002 docked profile from listing row PPRF SH 002 railed profile from listing row SH-AXIS-001— axis limits prefilledSH-CHART-004— grouped multiplesSH-CHART-008— no pvalueSH-CTRL-001— control panelSH-CTRL-004— normal range overlaySH-CTRL-005— axis limitsSH-CTRL-006— shared bin multiplesSH-CTRL-007— boundary ticksSH-CTRL-008— bins inputs populatedSH-DATA-002— invalid data noteSH-FUNC-004C— control hidden for pulseSH-FUNC-010— linked listingSH-FUNC-011— bar de emphasisSH-LIST-004— search sort paginateSH-OVW-002— overview panelsSH-OVW-003— click through to pulseSH-OVW-005— overview filtered
Source-matrix routing status (125 rows)
browser(11 rows): the 10 reviewed rows are covered above (SH-FUNC-004A–C, SH-FUNC-005A–D, SH-FUNC-010, SH-FUNC-011, SH-FUNC-012). SH-REG-078 (statusreplaced) is superseded by design #2's p-value disposition: the shipped approximate screening annotations intentionally carry the validation disclaimer, so no test asserts the legacy text's removal.manual(8 rows): SH-REG-044/045/047/058/059/061/081/082 carry manual review evidence and are out of scope for automated coverage.planned(106 rows): not yet routed tounit/browserin the source matrix. Where a test here already evidences a planned row it is listed under "Source matrix rows" above; re-typing those rows (planned→unit/browser) with links back to these tests is a safety.agent follow-up.
Legacy-API note: source-matrix SH-API-001 ("a factory to create a custom Webcharts chart object") describes the legacy Webcharts API, which the designs intentionally do not preserve (pilot SH-API-002). The module ships the pilot's lifecycle API instead — SH-API-001 in the module scheme.
SH-REG-024 note: the row's inputs-update behavior is evidenced by SH-CTRL-008; its info-icon clause (an ⓘ link to the algorithm's description) is not ported.
View-selector rollout (VIEW-3, #76)
One representation — a histogram. The "All Measures" overview is a small-multiples data-scope mode and the bar-click listing is a supplementary drill-down; neither is a mutually-exclusive primary-display switch, so promoting would require inventing a new toggle (out of scope). Ruled single-view in the shared view-selector rollout (#76) — no view control is added; see view-selector-inventory.md.
Reproducing this report
The evidence set is regenerated from a full test run and committed with the code it qualifies; CI fails when they drift. To verify or rebuild it:
npm ci
npm run evidence:check   # compare a fresh run against the committed evidence
npm run evidence         # regenerate docs/evidence/histogram/evidence.json
Screenshot baselines are canonical to the Linux CI runner; the repository's Update evidence baselines workflow is the authoritative way to refresh them. See CONTRIBUTING.md for the traceability convention.