Safety Results Over Time: test evidence Safety Results Over Time is exploratoryQualifiedValidated for regulated use. Nothing in safety.viz is, yet.ExploratoryThis chartTested and documented. Confirm every result.ExperimentalTested and documented, but what it shows or how it behaves may still change.PrototypeAn early look, on the docs site only. Not in the demo app.What each rung means
Requirement-traced qualification evidence for the safety.viz results-over-time module.
Requirement matrix ↗ — the reviewed source specification these tests trace to.
- Scope
- 30 coverage rows55 distinct requirement IDs
- Tests executed
- 1219 automated checks190 browser · 1029 unit
- Result
- pass all passing11 evidence screenshots
- Generated
- 2026-10-10 18:05 UTC
- Environment
linux 6.17.0-1022-azure · node v22.23.3 · playwright 1.61.1 · chromium 149.0.7827.55- Test run
- Actions run #38072575214
Scope & approach
Traceability for the results-over-time module (a Chart.js reimplementation of RhoInc/safety-results-over-time, under #27), per the convention in CONTRIBUTING.md. Requirement IDs (SROT-*) come from the reviewed 58-row matrix at requirements/safety-results-over-time.md, whose Evidence Type column routes rows (unit → Vitest, browser → Playwright).
Each table row traces one requirement to the automated test(s) that evidence it: the Requirement column shows the reviewed requirement text and its ID, the source-matrix rows link back to the specification, the issue column links the implementing work, and the result column shows the recorded outcome of every matching test from the committed evidence.json with its captured screenshots. Browser evidence is captured at fixed conditions (1280×800, device scale 1) on the canonical Linux CI environment.
Browser evidence (Playwright — tests/e2e/results-over-time.spec.js)
16 requirement rows · 16 tests
| Requirement | Source matrix rows | Issue | Tests & evidence |
|---|---|---|---|
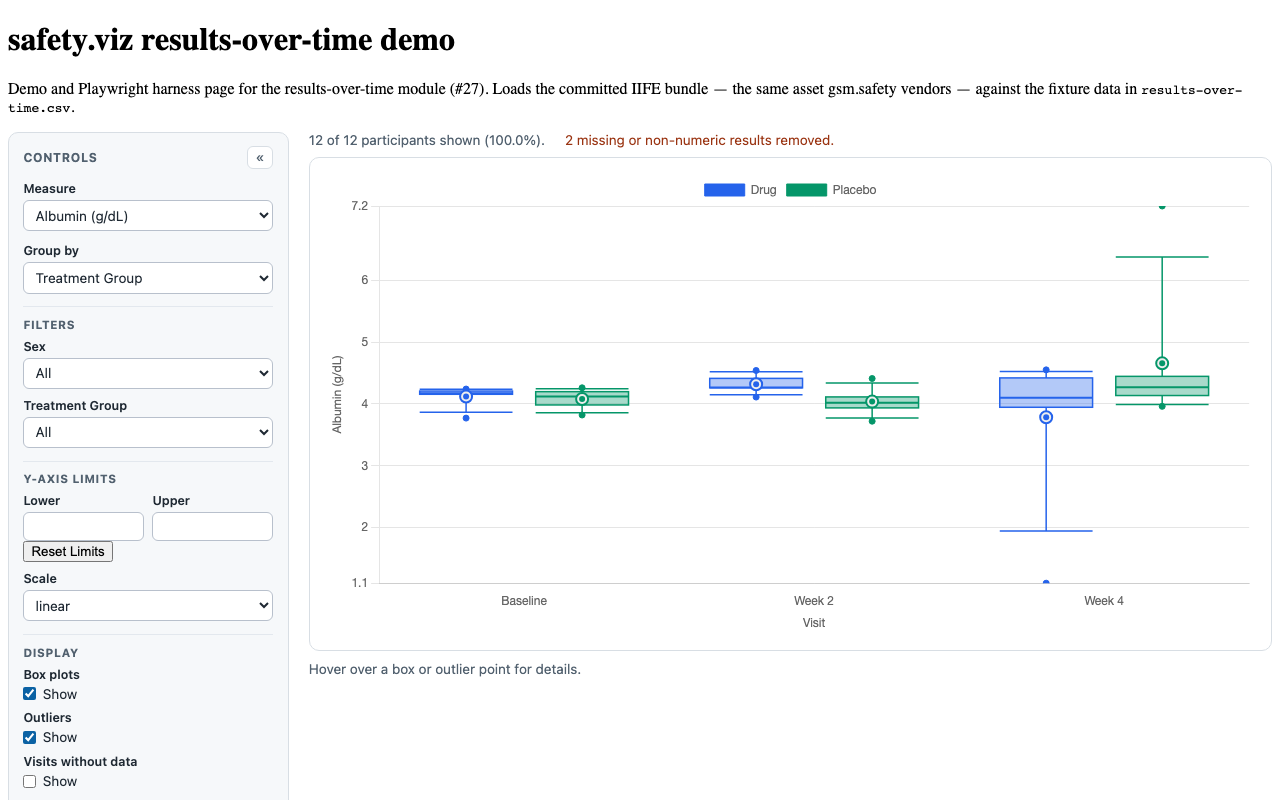
SROT-FUNC-001/SROT-FUNC-002 SROT-FUNC-001 This drop-down menu is used to filter the lab variable that is displayed in the chart. The default measure is set to the first variable in the data set, but the default value can be adjusted to any measure upon the project team's request. Users can select any pre-defined measure in this filter. Selecting a measure will display the data points associated with that measure and will display the visits that the measure is collected at underneath the chart. SROT-FUNC-002 The chart can be configured to have any number of data filters. Each specified filter has a drop-down menu that is used to filter the visit data that is displayed in the chart. | SROT-FUNC-001, SROT-FUNC-002 | #27 |
 |
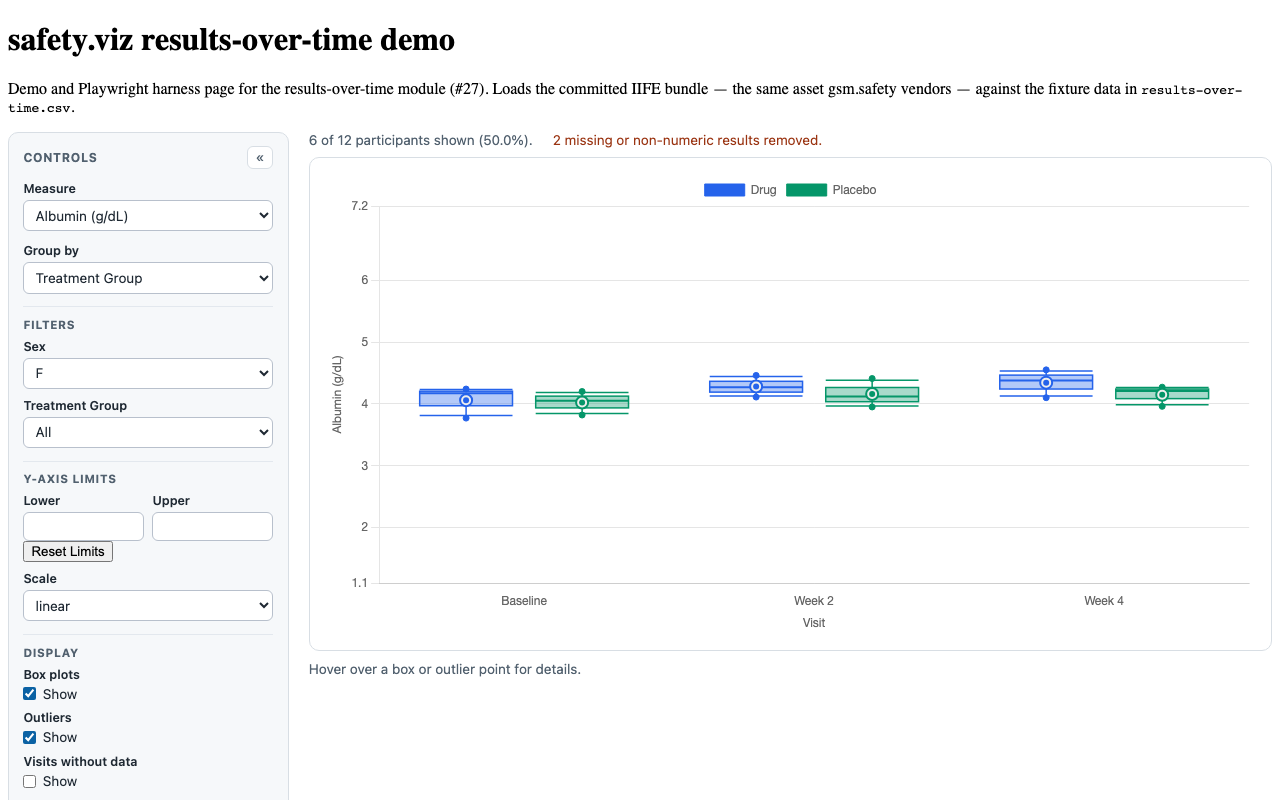
SROT-FUNC-003/SROT-REG-001 SROT-FUNC-003 Displayed under the header, this statement provides the total number of participants in the data set in integers as well as the percentage of participants shown to one decimal place. In the default view, all participant data is included in the chart, or 100%, unless the project team requests otherwise. When filters are used, the data shown in the histogram is manipulated and the number of participant records shown at the top of the page may increase or decrease, depending on the variable selected. SROT-REG-001 Confirm that the number and percentage of participants is displayed | SROT-FUNC-003, SROT-REG-001 | #27 |
 |
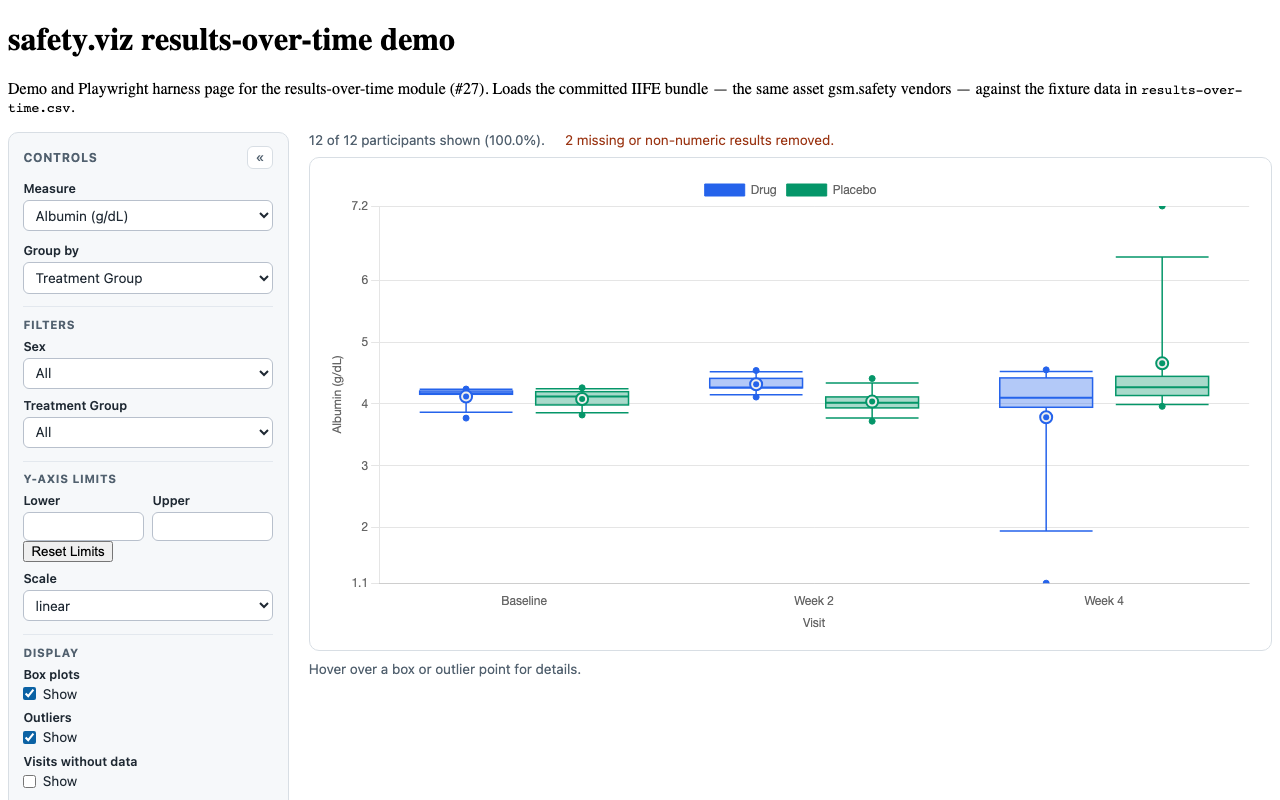
SROT-DATA-002 SROT-DATA-002 one record per participant per visit per medical sign | SROT-DATA-002 | #27 |
 |
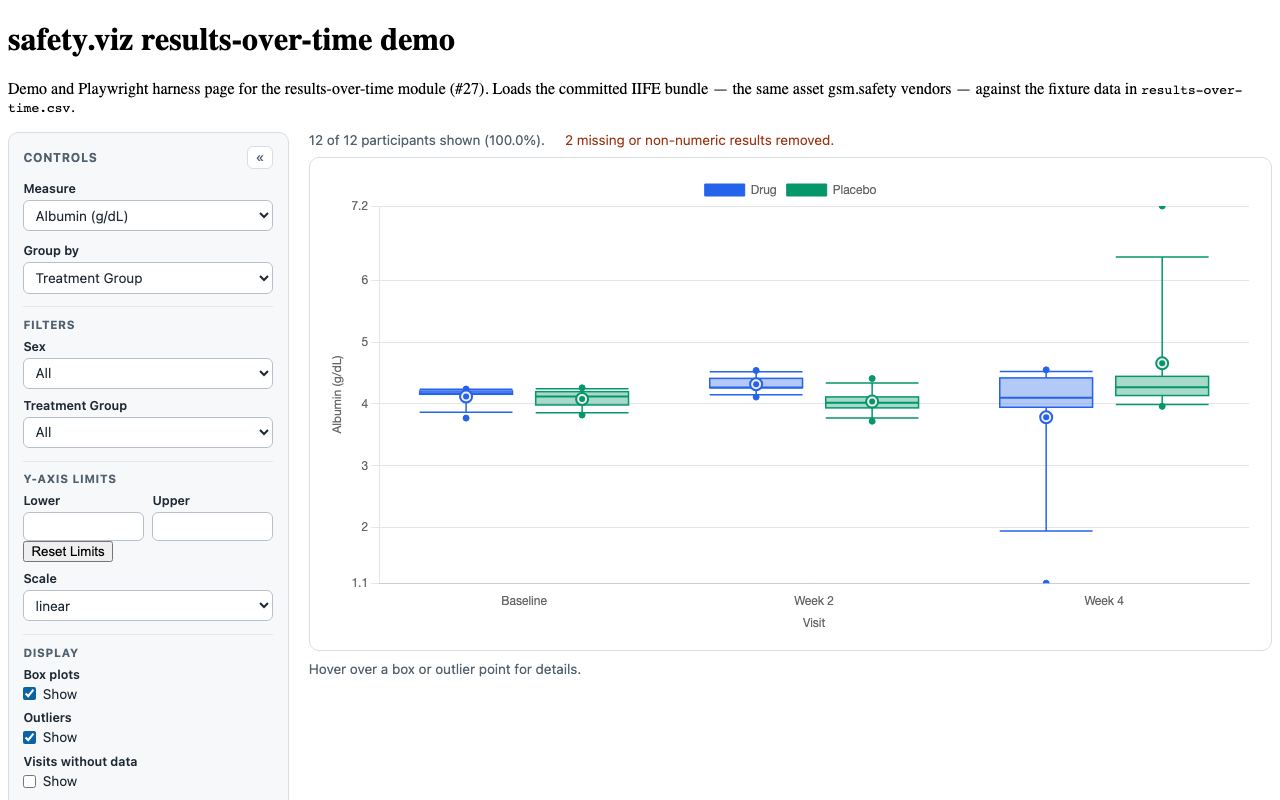
SROT-FUNC-008/SROT-REG-009 SROT-FUNC-008 The chart includes box and whisker plots to show the data distribution for a given measure. These plots show the data distribution for a data measure and can be added to the chart by clicking the box to the right of the Box plots text located above the chart. To take the plots away, the user can uncheck the box by clicking in it again. The box is checked by default, so the box and whisker plots appear when the chart is rendered. SROT-REG-009 Confirm that selecting the box plot option causes box plots to appear around the data ranges | SROT-FUNC-008, SROT-REG-009 | #27 |
 |
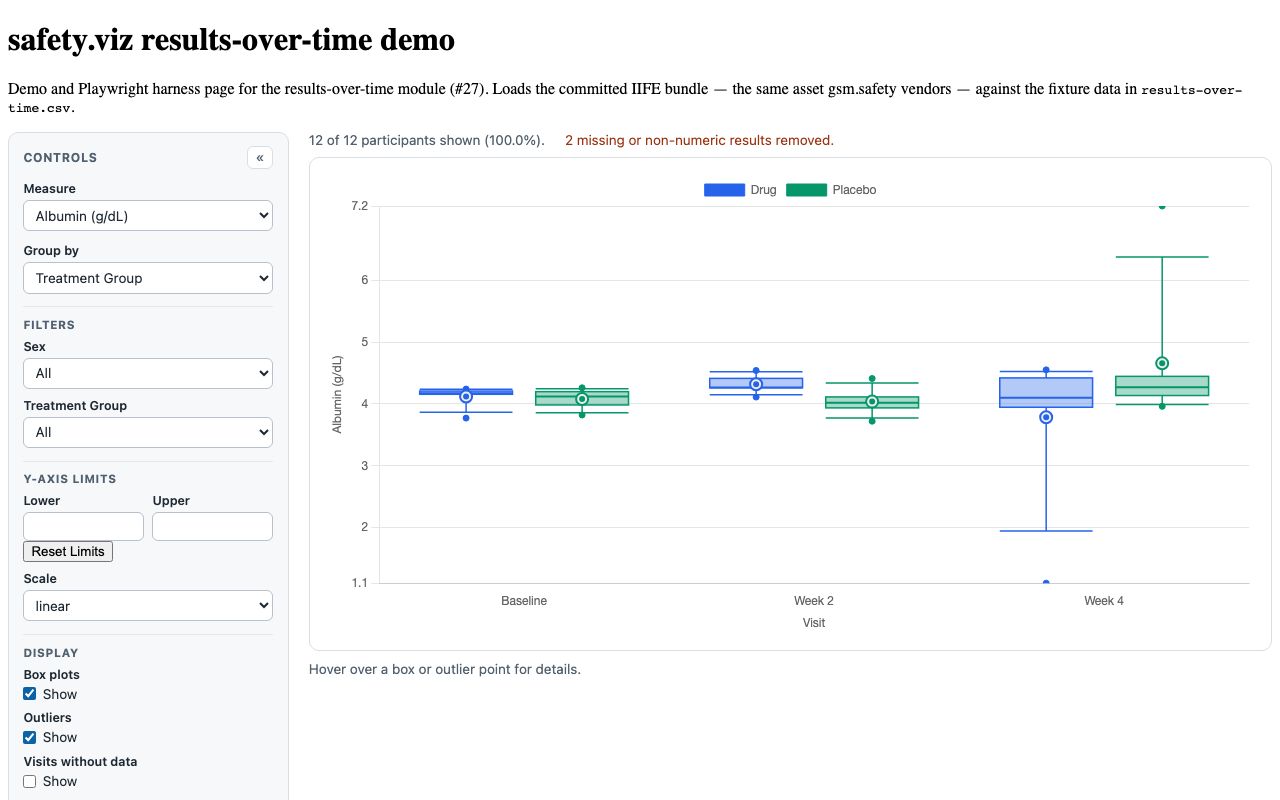
SROT-REG-002/SROT-REG-003 SROT-REG-002 Confirm that the filters are working as expected (Measure, Group): selecting a variable changes the plot values. Customize the chart to add the Group filter: {"groups":["SEX","RACE"]} SROT-REG-003 Confirm that when a grouping is selected, the order of box/violin plots for each x-axis value match the group order in the legend. | SROT-REG-002, SROT-REG-003 | #27 |
 |
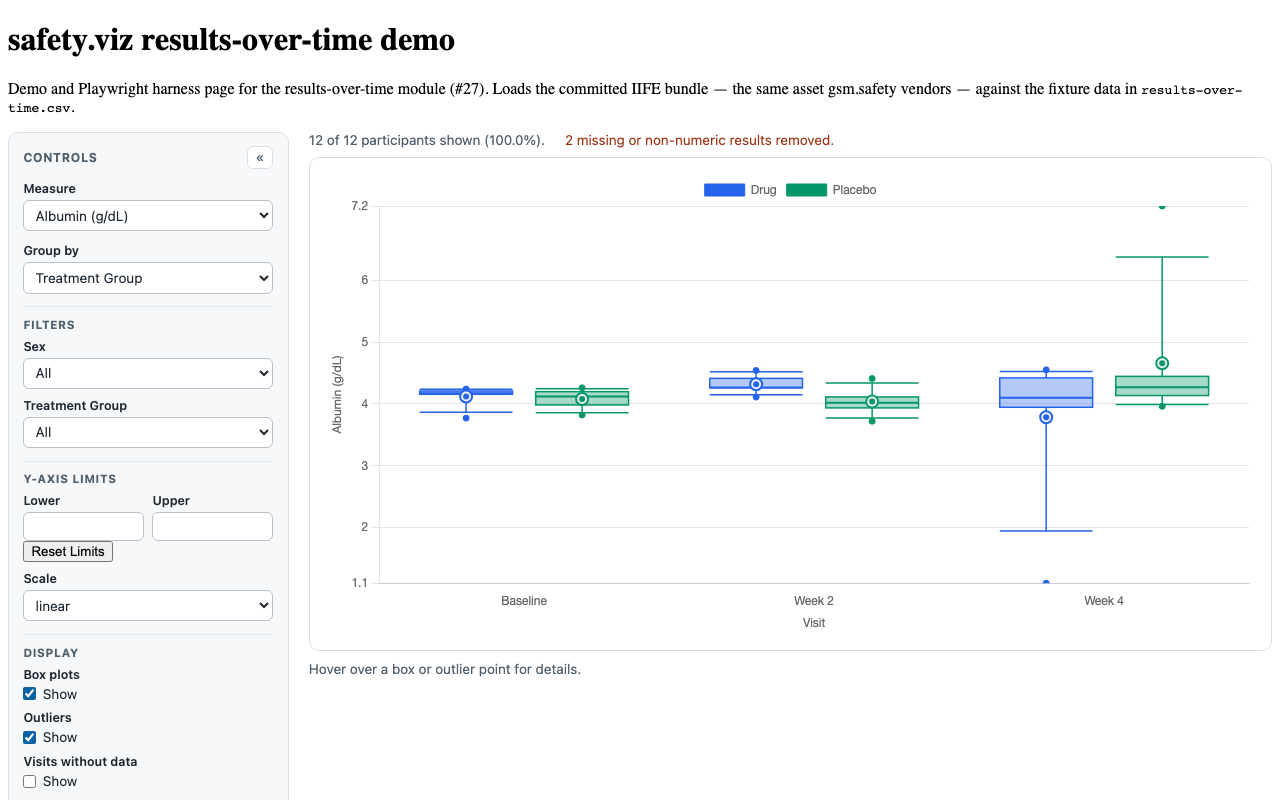
SROT-REG-010/SROT-REG-012 SROT-REG-010 Confirm that checking the Outliers checkbox causes results outside the 5th and 9th percentiles (i.e. results outside the horizontal lines of box plots) to be displayed in the chart. SROT-REG-012 Confirm that unchecking the Outliers checkbox hides the outliers from the chart. | SROT-REG-010, SROT-REG-012 | #27 |
 |
SROT-REG-011 SROT-REG-011 Confirm that Outlier points are clearly visible in the chart, even with Violin plots selected and that hovering on an outlier causes it to expand. | SROT-REG-011 | #27 |
|
SROT-REG-014/SROT-REG-015 SROT-REG-014 Confirm that hovering over a plot displays a tooltip with information about the data (N, Min, Median, etc.). Verify that SROT-REG-015 Min and Max have the lowest precision; 5th %, Q1, Median, Q3, 95th %, and Mean have precision to one more decimal place than the lowest precision; and StDev has precision to two more decimal places than the lowest precision. | SROT-REG-014, SROT-REG-015 | #27 |
|
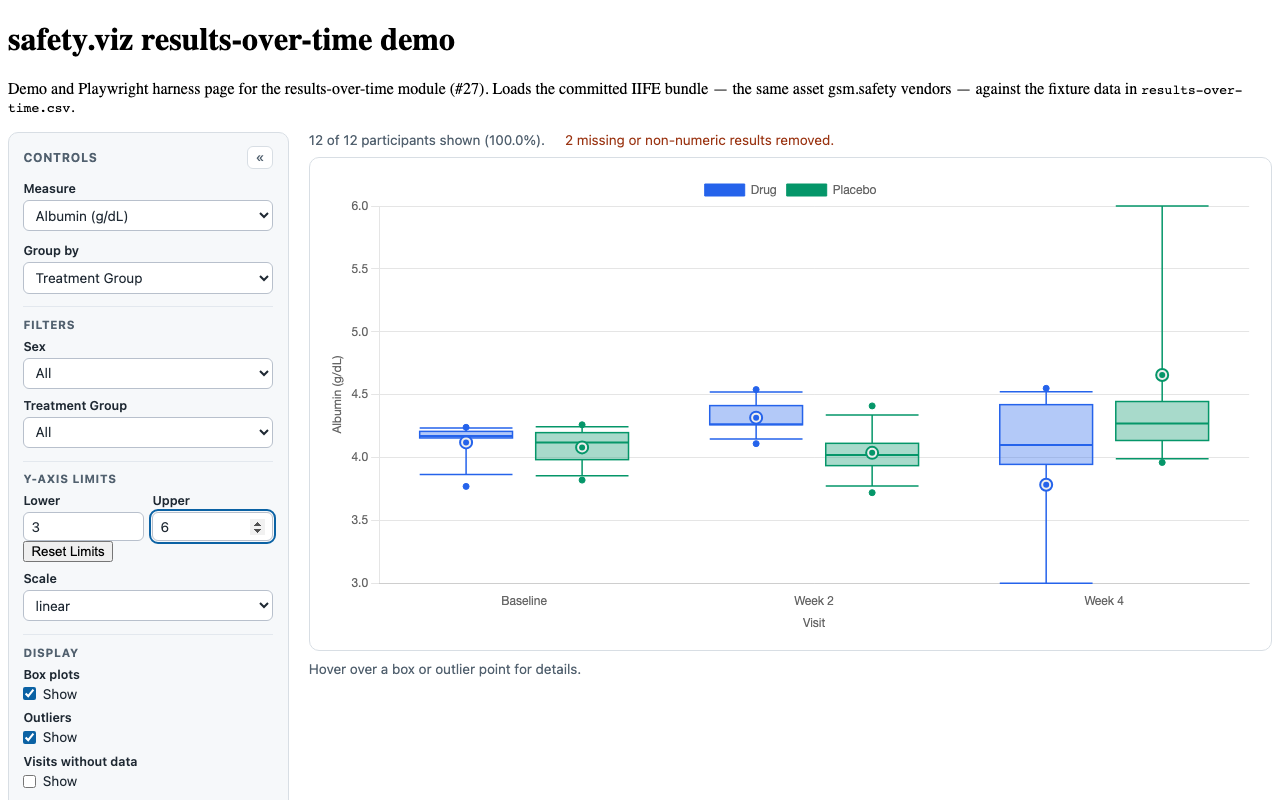
SROT-FUNC-004/SROT-REG-016/SROT-REG-017 SROT-FUNC-004 Users are able to adjust the lower limit of the y-axis by manipulating the input within the Lower Limit box. Users are able to adjust the upper limit of the y-axis by manipulating the input within the Upper Limit box. Each limit box has up and down arrows to adjust the value of the box by 1. Users can select an arrow to change the input or delete the current value in the box and type in a new value. When typing in a value, users must click outside of the box to apply the changes. When a user manipulates a y-axis limit, the y-axis on the chart below the controls will reflect the change. SROT-REG-016 Confirm that typing in a number into either the lower limit or upper limit control updates the y-axis domain accordingly. SROT-REG-017 Confirm that the lower limit cannot be equal to or greater than the upper limit and the upper limit cannot be equal to or less than the lower limit. Entering this condition should cause the limits to flip automatically and always have the larger limit as the Upper Limit. | SROT-FUNC-004, SROT-REG-016, SROT-REG-017 | #27 |
 |
SROT-FUNC-005/SROT-REG-020 SROT-FUNC-005 Users can change the upper and lower y-axis limits back to the default values for a measure by selecting the "Reset Limits" button. Pressing the button will erase the current values in the upper and lower limit boxes and replace them with defaults. The chart below will also reflect the changes and will show the default axes. SROT-REG-020 Confirm that the Reset Limits button resets the y-axis to the minimum and maximum values in the data. | SROT-FUNC-005, SROT-REG-020 | #27 |
|
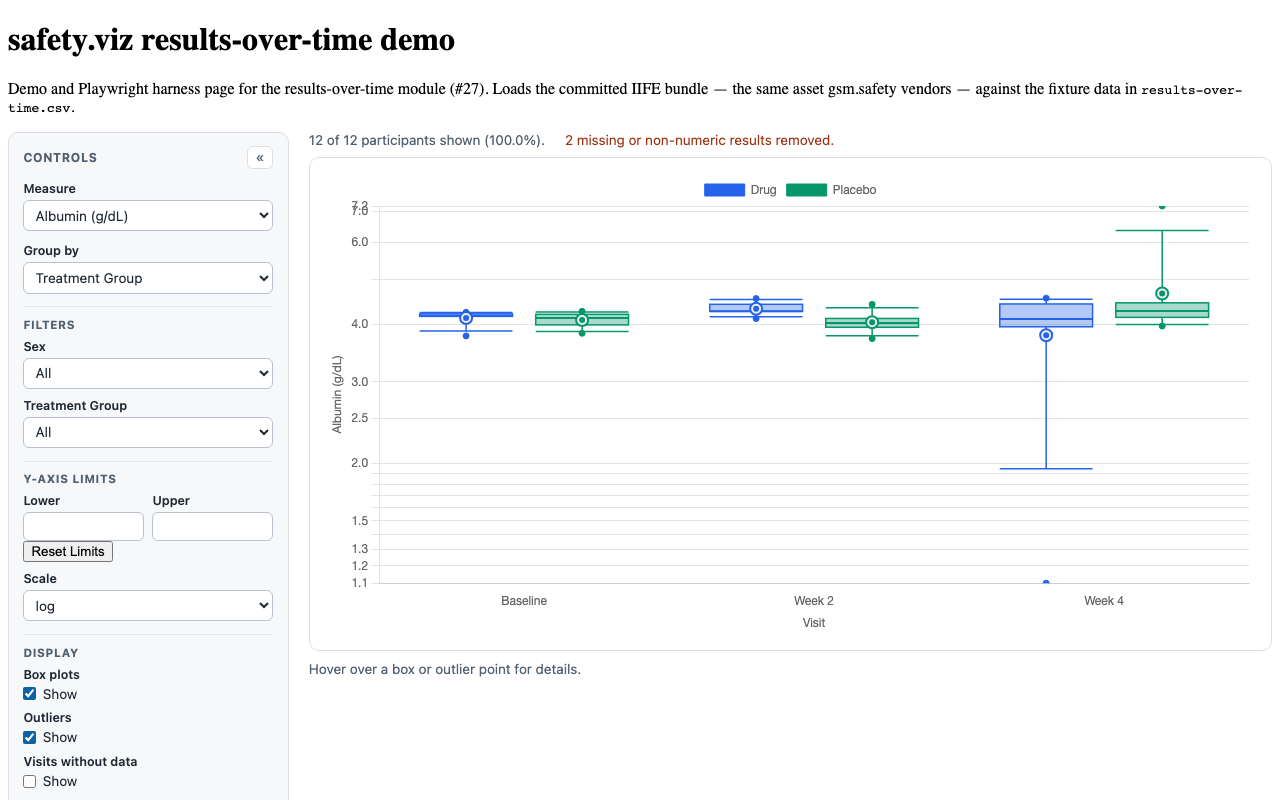
SROT-REG-018 SROT-REG-018 Confirm that a Scale radio control appears next to the y-axis limit controls with two options, linear and log, and that selecting either radio button updates the scale of the y-axis updates as expected. | SROT-REG-018 | #27 |
 |
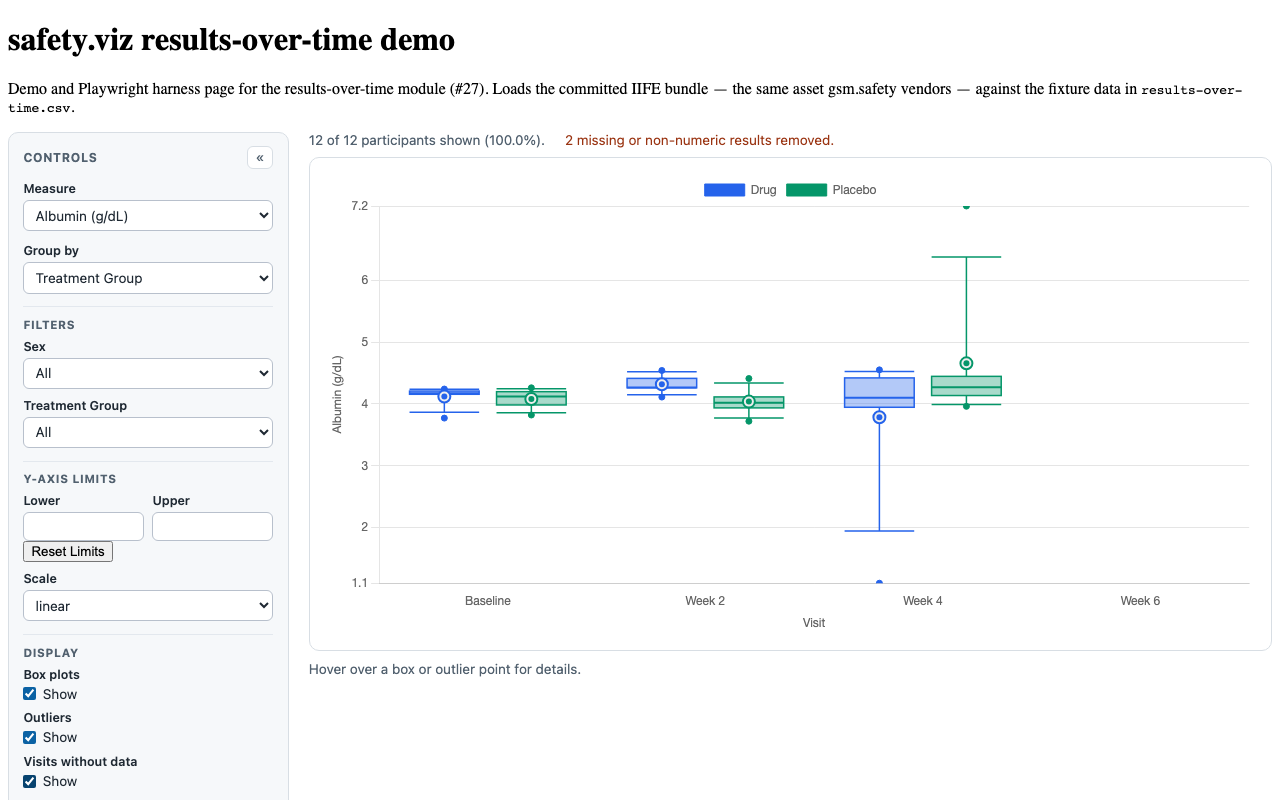
SROT-FUNC-006/SROT-REG-004/SROT-REG-005 SROT-FUNC-006 Users can select the checkbox to view visits that do not contain data. Checking the box will show a timepoint for the visit. Unchecking the checkbox will hide the timepoint for visits without data; visits without data are hidden on default. SROT-REG-004 Confirm that checking the "Visits without data" checkbox shows a timepoint for visits with no associated data points SROT-REG-005 Confirm that unchecking the "Visits without data" checkbox hides the timepoint for visits with no associated data points | SROT-FUNC-006, SROT-REG-004, SROT-REG-005 | #27 |
 |
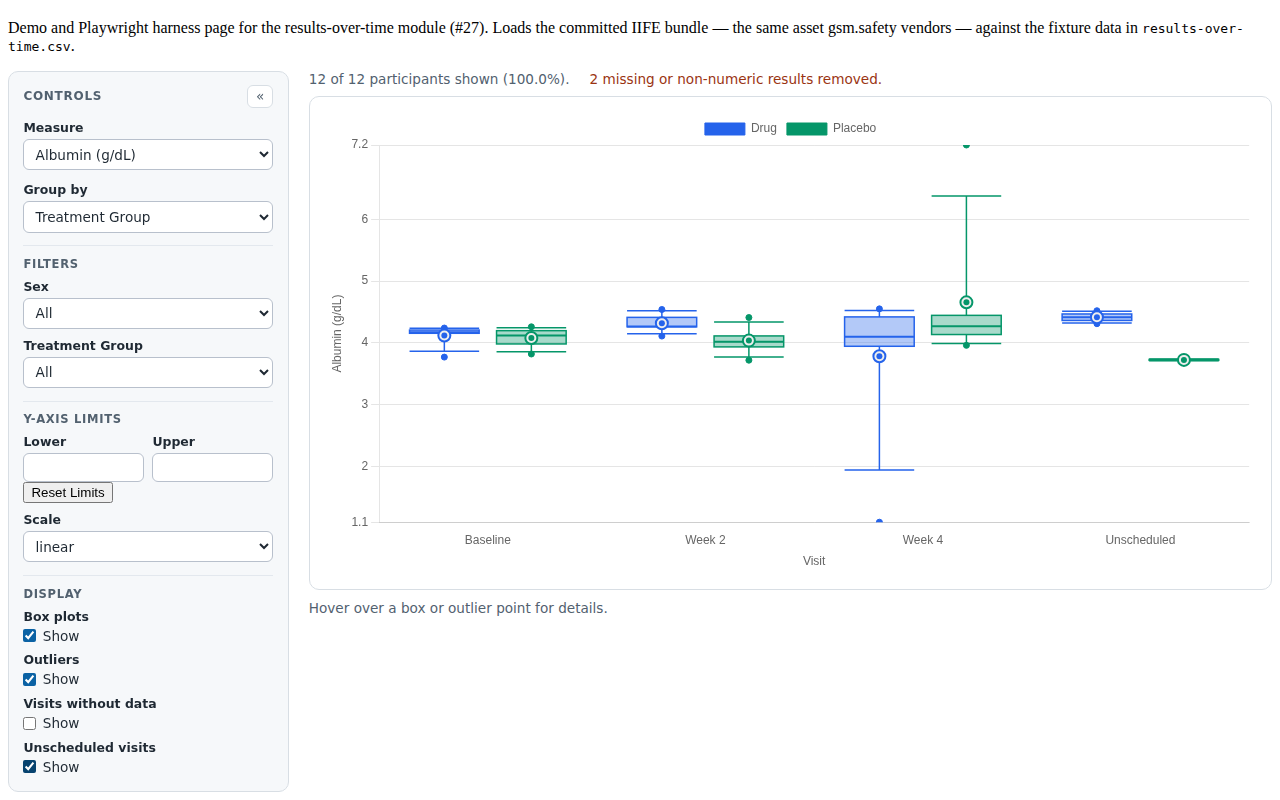
SROT-FUNC-007/SROT-REG-006/SROT-REG-007 SROT-FUNC-007 Users can select the checkbox to view data that is not associated with a scheduled visit. Checking the box will show a timepoint for the unscheduled visit and its associated data. Unselecting the checkbox will hide the unscheduled visit timepoint and its data; unscheduled visits are hidden on default. SROT-REG-006 Confirm that checking the "Unscheduled visits" checkbox shows a timepont for unscheduled visits and their associated data SROT-REG-007 Confirm that unchecking the "Unscheduled visits" checkbox hides the timepoint for unscheduled visits and their associated data | SROT-FUNC-007, SROT-REG-006, SROT-REG-007 | #27 |
 |
SROT-REG-023/SROT-REG-024 SROT-REG-023 Confirm that you can update the start_value setting for a Measure to have the Measure dropdown default to displaying a measure that is not the first one alphabetically in the list. SROT-REG-024 Confirm that you can update the start_value setting for a Measure to have a non-existent Measure and chart will handle it and display an existing measure by default instead. Verify that a warning is written to the console explaining that the specified measure does not exist. | SROT-REG-023, SROT-REG-024 | #27 |
|
SROT-API | — (see legacy-API note) | #27 |
|
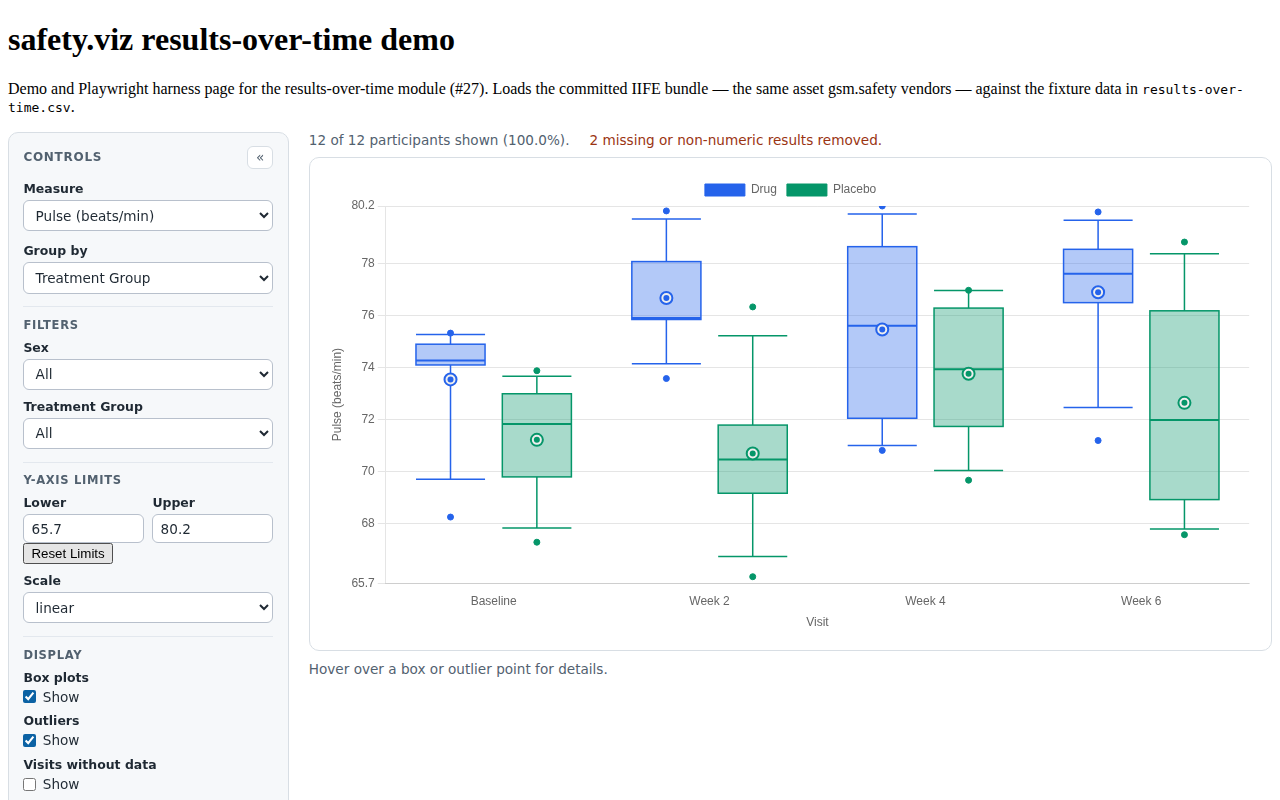
SROT-AXIS-001/002/003 SROT-AXIS-001 On load and after every render, each Y-axis Limits input displays the limit currently in force for the selected measure — the measure's data extent (positive values only on a log scale) by default, or the user's override — formatted to three significant figures of the axis range. Neither box is ever blank. SROT-AXIS-002 Displaying a limit does not pin it. A limit the user has not edited remains automatic — it is re-derived from the data on every render, so changing the measure, the filters, or the y-axis scale updates the value shown — while an edited limit persists as an override until it is reset. The distinction is held in state (an override slot separate from the recorded domain), not inferred from an empty input. SROT-AXIS-003 The Reset Limits control clears both y-axis limits overrides and repopulates both inputs with the derived limits, so there is always a way back to automatic now that an empty box no longer means it. | SROT-AXIS-001, SROT-AXIS-002, SROT-AXIS-003 | #85 |
 |
Unit evidence (Vitest — tests/unit/results-over-time/)
14 requirement rows · 63 tests
| Requirement | Source matrix rows | Issue | Tests & evidence |
|---|---|---|---|
SROT-CFG-004/005/006/007/009 SROT-CFG-004 name of variable that captures unique identifier of participant SROT-CFG-005 name of variable that captures visit name SROT-CFG-007 name of variable that captures measure name SROT-CFG-009 name of variable that captures measure result SROT-CFG-006 name of variable that captures visit order | SROT-CFG-004, SROT-CFG-005, SROT-CFG-007, SROT-CFG-009 | #27 |
|
SROT-CFG-008/012/013/014/015 SROT-CFG-008 name of variable that captures measure unit SROT-CFG-012 an array of filter variables and associated metadata SROT-CFG-013 an array of grouping variables and associated metadata SROT-CFG-014 grouping variable; defaults to first item in SROT-CFG-015 controls initial display of outliers outside the 5th and 95th percentiles | SROT-CFG-008, SROT-CFG-012, SROT-CFG-013, SROT-CFG-014 | #27 |
|
SROT-CFG-017/018/019, SROT-DATA-003 SROT-CFG-017 a regular expression that identifies unscheduled visits SROT-CFG-019 an array of strings that identify unscheduled visits; overrides unscheduled_visit_pattern SROT-DATA-003 controls display of visits without data for the current measure SROT-CFG-018 default: `"/unscheduled\\ | SROT-CFG-017, SROT-CFG-019, SROT-DATA-003 | #27 |
|
SROT-DATA-001/002 SROT-DATA-001 The Safety Results Over Time accepts JSON data of the format returned by SROT-DATA-002 one record per participant per visit per medical sign | SROT-DATA-001, SROT-DATA-002 | #27 |
|
SROT-CFG-005/006 SROT-CFG-005 name of variable that captures visit name SROT-CFG-006 name of variable that captures visit order | SROT-CFG-005, SROT-CFG-006 | #27 |
|
SROT-REG-010/012 SROT-REG-010 Confirm that checking the Outliers checkbox causes results outside the 5th and 9th percentiles (i.e. results outside the horizontal lines of box plots) to be displayed in the chart. SROT-REG-012 Confirm that unchecking the Outliers checkbox hides the outliers from the chart. | SROT-REG-010, SROT-REG-012 | #27 |
|
SROT-REG-002/010 (grouping-change regression) SROT-REG-002 Confirm that the filters are working as expected (Measure, Group): selecting a variable changes the plot values. Customize the chart to add the Group filter: {"groups":["SEX","RACE"]} SROT-REG-010 Confirm that checking the Outliers checkbox causes results outside the 5th and 9th percentiles (i.e. results outside the horizontal lines of box plots) to be displayed in the chart. | SROT-REG-002, SROT-REG-010 | #27 |
|
SROT-REG-021 SROT-REG-021 Confirm that the unit value for a given measure is appended to the measure in the Measure dropdown and in the y-axis label. | SROT-REG-021 | #27 |
|
SROT-REG-015/016/017/020 SROT-REG-015 Min and Max have the lowest precision; 5th %, Q1, Median, Q3, 95th %, and Mean have precision to one more decimal place than the lowest precision; and StDev has precision to two more decimal places than the lowest precision. SROT-REG-016 Confirm that typing in a number into either the lower limit or upper limit control updates the y-axis domain accordingly. SROT-REG-017 Confirm that the lower limit cannot be equal to or greater than the upper limit and the upper limit cannot be equal to or less than the lower limit. Entering this condition should cause the limits to flip automatically and always have the larger limit as the Upper Limit. SROT-REG-020 Confirm that the Reset Limits button resets the y-axis to the minimum and maximum values in the data. | SROT-REG-015, SROT-REG-016, SROT-REG-017, SROT-REG-020 | #27 |
|
SROT-REG-003/011/014/015 SROT-REG-003 Confirm that when a grouping is selected, the order of box/violin plots for each x-axis value match the group order in the legend. SROT-REG-011 Confirm that Outlier points are clearly visible in the chart, even with Violin plots selected and that hovering on an outlier causes it to expand. SROT-REG-014 Confirm that hovering over a plot displays a tooltip with information about the data (N, Min, Median, etc.). Verify that SROT-REG-015 Min and Max have the lowest precision; 5th %, Q1, Median, Q3, 95th %, and Mean have precision to one more decimal place than the lowest precision; and StDev has precision to two more decimal places than the lowest precision. | SROT-REG-003, SROT-REG-011, SROT-REG-014, SROT-REG-015 | #27 |
|
SROT-AXIS-001/002/003/004 SROT-AXIS-001 On load and after every render, each Y-axis Limits input displays the limit currently in force for the selected measure — the measure's data extent (positive values only on a log scale) by default, or the user's override — formatted to three significant figures of the axis range. Neither box is ever blank. SROT-AXIS-002 Displaying a limit does not pin it. A limit the user has not edited remains automatic — it is re-derived from the data on every render, so changing the measure, the filters, or the y-axis scale updates the value shown — while an edited limit persists as an override until it is reset. The distinction is held in state (an override slot separate from the recorded domain), not inferred from an empty input. SROT-AXIS-003 The Reset Limits control clears both y-axis limits overrides and repopulates both inputs with the derived limits, so there is always a way back to automatic now that an empty box no longer means it. SROT-AXIS-004 Pre-filling must not let an invalid domain reach the chart: a limit typed across the other limit as currently displayed is swapped rather than inverted, an empty or non-numeric entry returns that limit to automatic, and a log-scale domain stays positive. | SROT-AXIS-001, SROT-AXIS-002, SROT-AXIS-003, SROT-AXIS-004 | #85 |
|
SROT-MEAS-001/002 (measures whitelist) SROT-MEAS-001 The SROT-MEAS-002 A configured measure absent from the data is dropped from the Measure control with a console warning naming it; when none of the configured measures is present the control falls back to every measure in the data rather than rendering empty. | SROT-MEAS-001, SROT-MEAS-002 | #136 |
|
SROT-FILT-001..004 (shared filter contract) SROT-FILT-001 A filter spec accepts SROT-FILT-002 SROT-FILT-003 SROT-FILT-004 | SROT-FILT-001, SROT-FILT-002, SROT-FILT-003, SROT-FILT-004 | #166 |
|
SROT-CTRL-001 (whole-chart reset) SROT-CTRL-001 A reset control at the foot of the control panel restores every settings-derived control to its configured default, re-derives the data-driven measure default, clears the y-axis limit overrides, and re-renders. Re-deriving the measure is the load-bearing half: | — | #136 |
|
Visual evidence
Every screenshot below is a committed baseline: the same PNG is the visual-regression baseline the browser suite asserts against and the evidence artifact shown here. Click any capture for the full-resolution image.
SROT AXIS 001 y limits prefilled SROT DATA 002 invalid data note SROT FUNC 001 control panel SROT FUNC 003 participant count SROT FUNC 004 y limits SROT FUNC 006 visits without data SROT FUNC 007 unscheduled visits SROT FUNC 008 box plots SROT REG 002 grouped box plots SROT REG 010 outliers SROT REG 018 log scale
Source-matrix routing status (58 rows)
Covered: 44 of 58 rows (the browser and unit tables above). The remaining 14 rows are descoped, honestly, for the reasons below.
- Violin plots —
SROT-FUNC-009,SROT-REG-008(2 rows): descoped. Violin (kernel-density) marks are off by default in the original renderer and add little over the box-and-whisker distribution summary; Chart.js has no violin primitive, so they would be a large custom-SVG effort for a non-default feature. Box-and-whisker + outliers deliver the population distribution. - Legacy Webcharts / CAT / API rows —
SROT-CFG-001,SROT-CFG-002,SROT-API-001,SROT-REG-022,SROT-REG-025(5 rows): descoped. These describe the legacy Webcharts configuration object, thesafetyResultsOverTime()Webcharts-chart factory, and CAT-specific settings workflows. The module ships the shared nextgen lifecycle API instead (SROT-API, module scheme) with explicit settings, matching the histogram precedent; the reviewed matrix flags these rowsneeds-jeremy-review. - Normal-range mappings —
SROT-CFG-010,SROT-CFG-011(2 rows): descoped.normal_col_low/normal_col_highexist in the original settings but the results-over-time view does not draw a normal range (unlike the histogram), so these mappings are not part of this renderer's contract. missingValues—SROT-CFG-016(1 row): descoped. Missing/non-numeric results are removed by numeric cleaning with a reported count (SROT-DATA-002); the explicit missing-value token list is not reproduced.- Enrolled/randomized denominator —
SROT-REG-013(1 row): adapted. The participant note reports "shown of total (%)" for the current measure; the enrolled/randomized population denominator is not present in the trimmed example data contract, so it is not shown. - Log-axis tick overlap —
SROT-REG-019(1 row): delegated. Log-scale tick selection and label spacing are handled by Chart.js's logarithmic scale; the module does not add a custom de-duplication pass, so this is not separately asserted. - Group-variable validation —
SROT-REG-026,SROT-REG-027(2 rows): descoped. Filters whose column is absent from the data are dropped with a warning, but group options are taken from settings as-is (missing-column dropping and duplicate-label de-duplication for the Group-by control are not implemented). A follow-up could extend the filter validation to groups.
View-selector rollout (VIEW-3, #76)
One primary display — the per-visit box-and-whisker plot with an outlier overlay. "Scale" is an axis-type toggle and the Display checkboxes are non-exclusive overlay toggles on one chart, not a chooser between displays. Ruled single-view in the shared view-selector rollout (#76) — no view control is added; see view-selector-inventory.md.
Reproducing this report
The evidence set is regenerated from a full test run and committed with the code it qualifies; CI fails when they drift. To verify or rebuild it:
npm ci
npm run evidence:check   # compare a fresh run against the committed evidence
npm run evidence         # regenerate docs/evidence/results-over-time/evidence.json
Screenshot baselines are canonical to the Linux CI runner; the repository's Update evidence baselines workflow is the authoritative way to refresh them. See CONTRIBUTING.md for the traceability convention.