Safety Shift Plot: test evidence Safety Shift Plot is exploratoryQualifiedValidated for regulated use. Nothing in safety.viz is, yet.ExploratoryThis chartTested and documented. Confirm every result.ExperimentalTested and documented, but what it shows or how it behaves may still change.PrototypeAn early look, on the docs site only. Not in the demo app.What each rung means
Requirement-traced qualification evidence for the safety.viz shift-plot module.
Requirement matrix ↗ — the reviewed source specification these tests trace to.
- Scope
- 36 coverage rows50 distinct requirement IDs
- Tests executed
- 1231 automated checks192 browser · 1039 unit
- Result
- pass all passing10 evidence screenshots
- Generated
- 2026-10-10 18:05 UTC
- Environment
linux 6.17.0-1022-azure · node v22.23.3 · playwright 1.61.1 · chromium 149.0.7827.55- Test run
- Actions run #38072575214
Scope & approach
Traceability for the shift-plot module (#14) — the second full renderer, built on the framework proven by the histogram (#2) — per the convention in CONTRIBUTING.md. Requirement IDs are the SSP-* rows of the 45-row matrix at requirements/safety-shift-plot.md — 39 harvested and reviewed from the RhoInc wiki, plus six added locally in #136 (SSP-CHART-001/002 backfilled, SSP-SCALE-001..004 new). One module-scheme ID remains outside the matrix: the module-API SSP-API-001 note. Development follows red-green TDD: matrix row → failing test → minimal implementation.
Each table row traces one requirement to the automated test(s) that evidence it: the Requirement column shows the reviewed requirement text and its ID, the source-matrix rows link back to the specification, the issue column links the implementing work, and the result column shows the recorded outcome of every matching test from the committed evidence.json with its captured screenshots. Browser evidence is captured at fixed conditions (1280×800, device scale 1) on the canonical Linux CI environment.
Browser evidence (Playwright — tests/e2e/shift-plot.spec.js)
19 requirement rows · 18 tests
| Requirement | Source matrix rows | Issue | Tests & evidence |
|---|---|---|---|
SSP-CTRL-001/SSP-REQ-002/SSP-CTRL-002/SSP-CTRL-003 SSP-CTRL-001 This drop-down menu is used to filter the lab variable that is displayed in the chart. The default measure is set to the first variable in the data set, but the default value can be adjusted to any measure upon the project team's request. Users can select any pre-defined measure in this filter. Selecting a measure will display the data points associated with that measure and will display the visits that the measure is collected at underneath the chart. SSP-REQ-002 This drop-down menu is used to filter the visit data that will be displayed in the chart. The default measure is set to 0, but the default value can be adjusted to any visit(s) upon the project team's request. Users can select one of more pre-defined visit(s) in this filter to be used as the baseline visit(s) in the chart. These values will be displayed on the x-axis. SSP-CTRL-002 This drop-down menu is used to filter the visit data that will be displayed in the chart. The default measure is set to all visits other than visit 0, but the default value can be adjusted to any visit(s) upon the project team's request. Users can select one of more pre-defined visit(s) in this filter to be used as comparison visit(s) in the chart. These values will be displayed on the y-axis. SSP-CTRL-003 The chart can be configured to have any number of data filters. Each specified filter has a drop-down menu that is used to filter the visit data that is displayed in the chart. | SSP-CTRL-001, SSP-REQ-002, SSP-CTRL-002 | #14 |
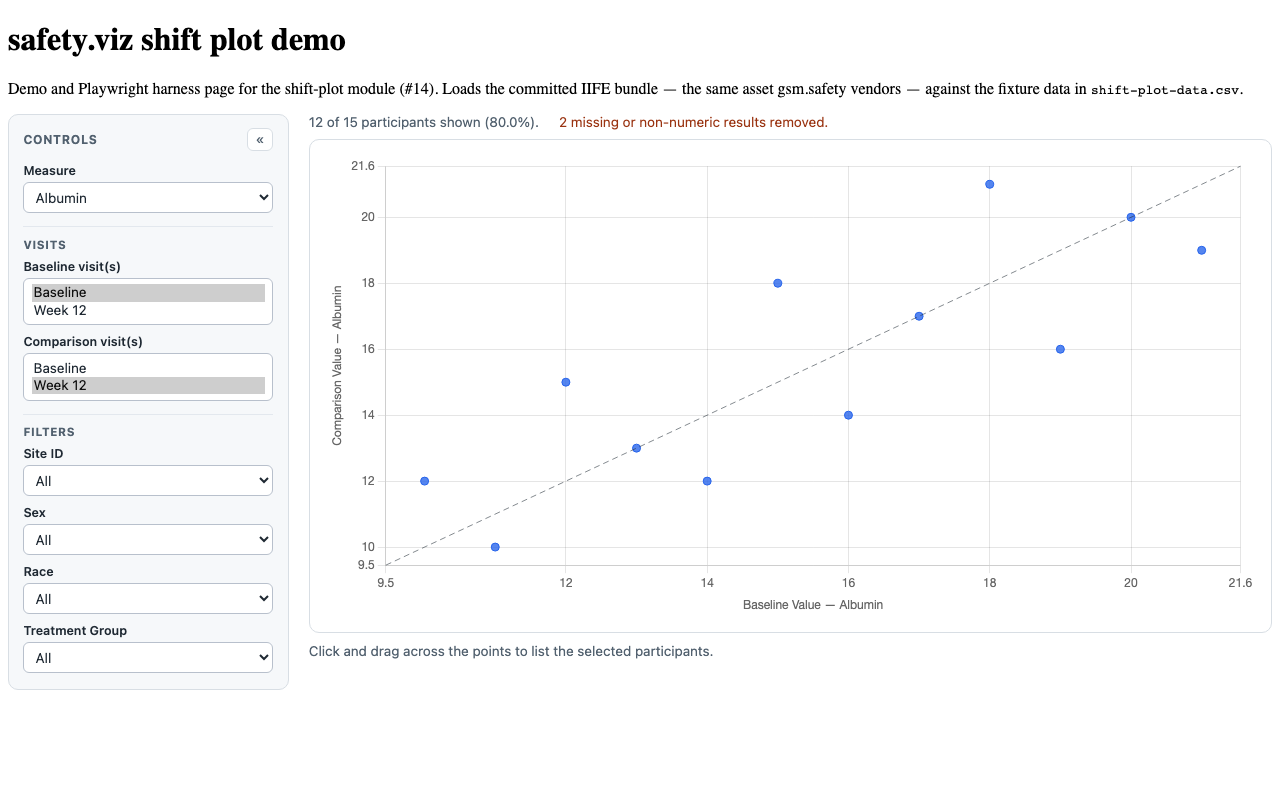 |
SSP-CHART-002 SSP-CHART-002 Both axes carry one shared domain, so the dashed identity reference line marks y = x at 45° and a participant's shift is read as distance from that line. | SSP-CHART-002 | #14 |
|
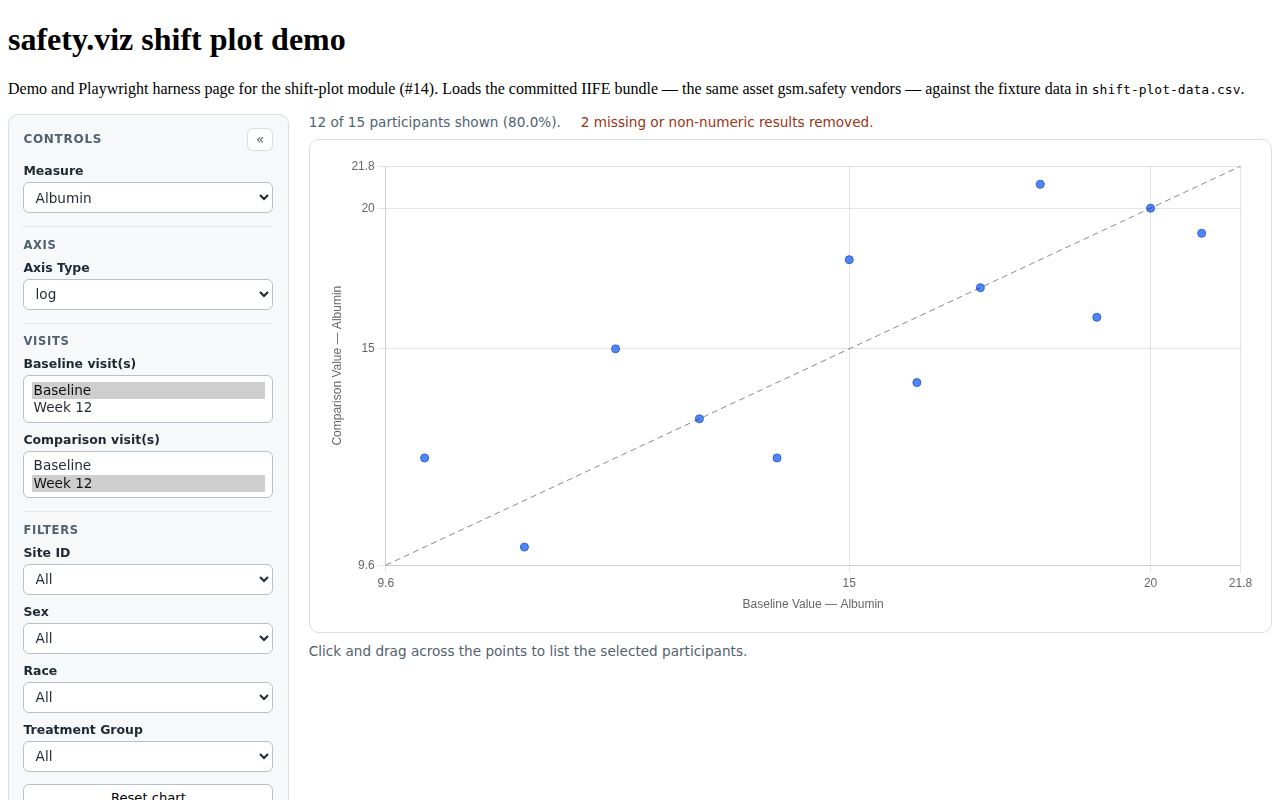
SSP-SCALE-001/SSP-SCALE-004 SSP-SCALE-001 An Axis Type control switches both scatter axes between a linear and a logarithmic scale together; because the identity line requires one domain shared by both axes, the choice applies to the pair and never to one axis alone. The initial choice comes from the axis_type setting and defaults to linear. SSP-SCALE-004 The dashed identity reference line still marks y = x under a logarithmic transform, and the participant counts reflect the pairs actually plotted. | SSP-SCALE-001, SSP-SCALE-004 | #136 |
 |
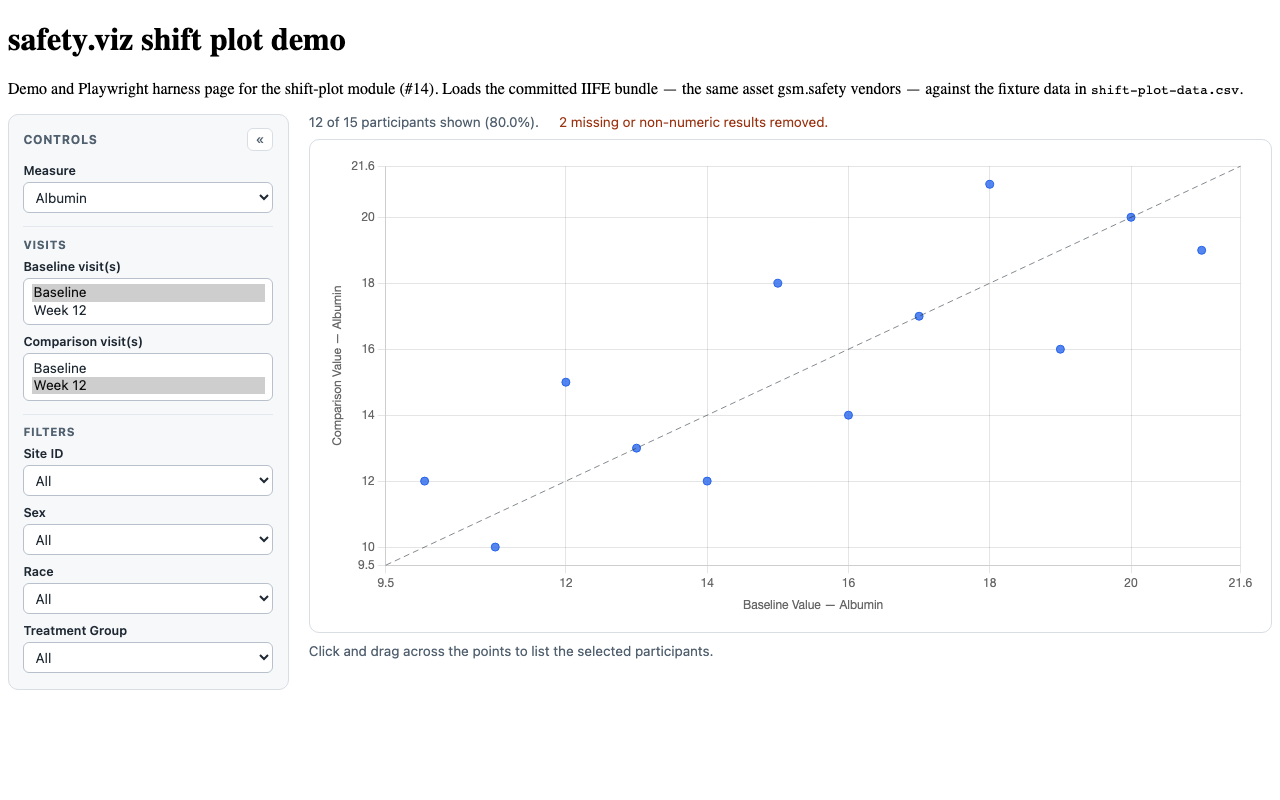
SSP-COUNT-001/SSP-REG-005 SSP-COUNT-001 Displayed under the header, this statement provides the total number of participants in the data set in integers as well as the percentage of participants shown to one decimal place. In the default view, all participant data is included in the chart, or 100%, unless the project team requests otherwise. When filters are used, the data shown in the histogram is manipulated and the number of participant records shown at the top of the page may increase or decrease, depending on the variable selected. SSP-REG-005 Confirm that the # of enrolled/randomized participants is visible at the top of the page | SSP-COUNT-001, SSP-REG-005 | #14 |
 |
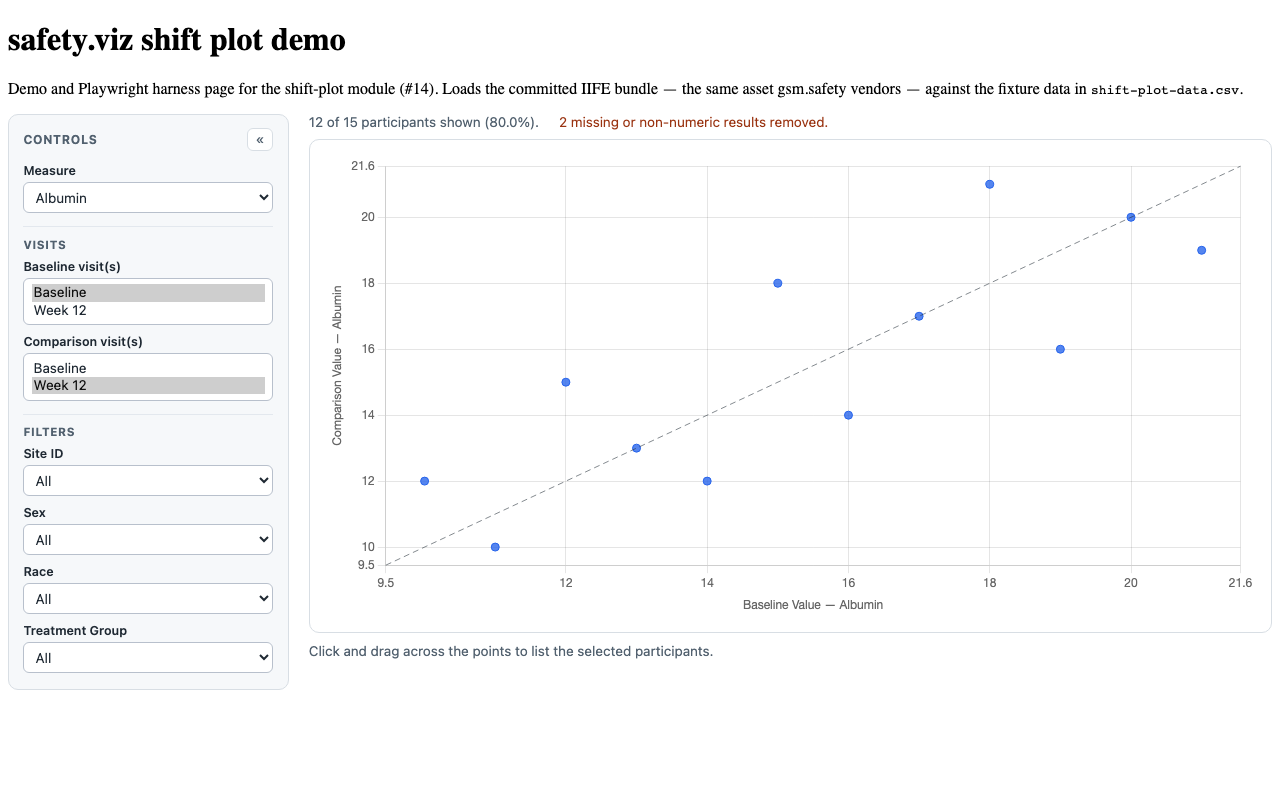
SSP-REG-020 SSP-REG-020 Confirm that invalid results are removed from the data rather than measures with any invalid results. Invalid results include missing and non-numeric values. Then confirm that the number of removed results is noted in the console (You can confirm by downloading the data from CAT, updating the STRESN column so a few values are bad. When you reupload the edited data you will see that the number changes appropriately in the console). | SSP-REG-020 | #14 |
 |
SSP-REG-001 SSP-REG-001 Confirm that measure filter is working as expected | SSP-REG-001 | #14 |
|
SSP-REG-002/SSP-REG-003 SSP-REG-002 Confirm that baseline visit filter are working as expected SSP-REG-003 Confirm that comparison visit filter are working as expected | SSP-REG-002, SSP-REG-003 | #14 |
|
SSP-CTRL-003 SSP-CTRL-003 The chart can be configured to have any number of data filters. Each specified filter has a drop-down menu that is used to filter the visit data that is displayed in the chart. | SSP-CTRL-003 | #14 |
|
SSP-FILT-001 SSP-FILT-001 A filter spec accepts | SSP-FILT-001 | #166 |
|
SSP-REG-006 SSP-REG-006 Confirm that hovering over a data point displays subject ID, baseline value, comparison value, change value, and percent of change | SSP-REG-006 | #14 |
|
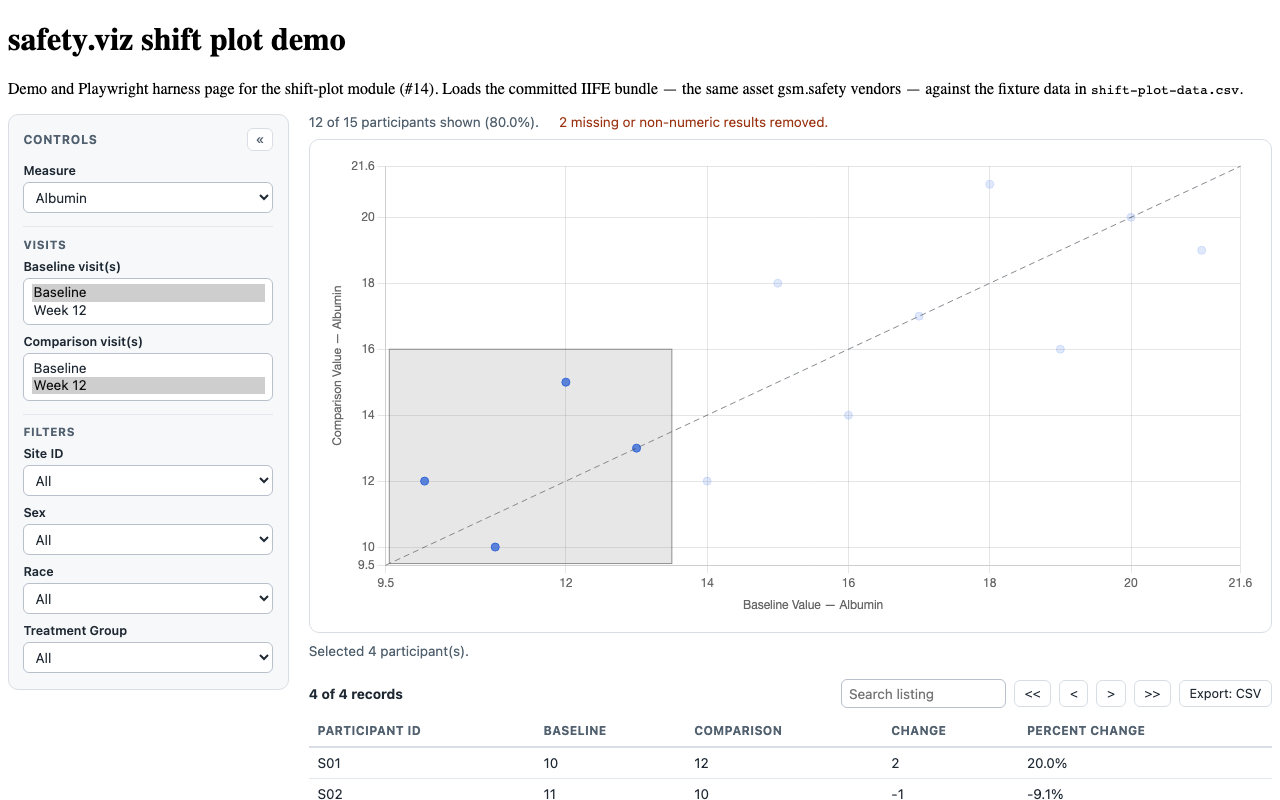
SSP-REQ-003/SSP-REQ-006/SSP-REQ-007/SSP-REG-004/SSP-REG-012 SSP-REQ-003 Clicking and dragging the mouse across the data points will open a table to the right of the chart that contains a detailed listing of participant records. This linked table contains the participant's subject ID, their baseline value for the selected measure, the comparison value for the selected measure, the difference between the baseline and comparison value using an integer and a percentage. When the table appears, the data points selected will appear in a gray box inside of the chart, lightening all of the data points not selected in the box. When a user clicks outside of the gray box, the gray box disappears along with the detailed table. SSP-REQ-006 Create a gray box around the selected data points SSP-REQ-007 Lighten all of the data points not contained in the table SSP-REG-004 Confirm that detailed record can be viewed by clicking and dragging the mouse across a section of values SSP-REG-012 Confirm that the detail listing isn't initially available but then does display when the chart is brushed | SSP-REQ-003, SSP-REQ-006, SSP-REQ-007, SSP-REG-004, SSP-REG-012 | #14 |
 |
SSP-REG-011 SSP-REG-011 Confirm that unselecting data points resets the detailed record at the bottom of the page | SSP-REG-011 | #14 |
|
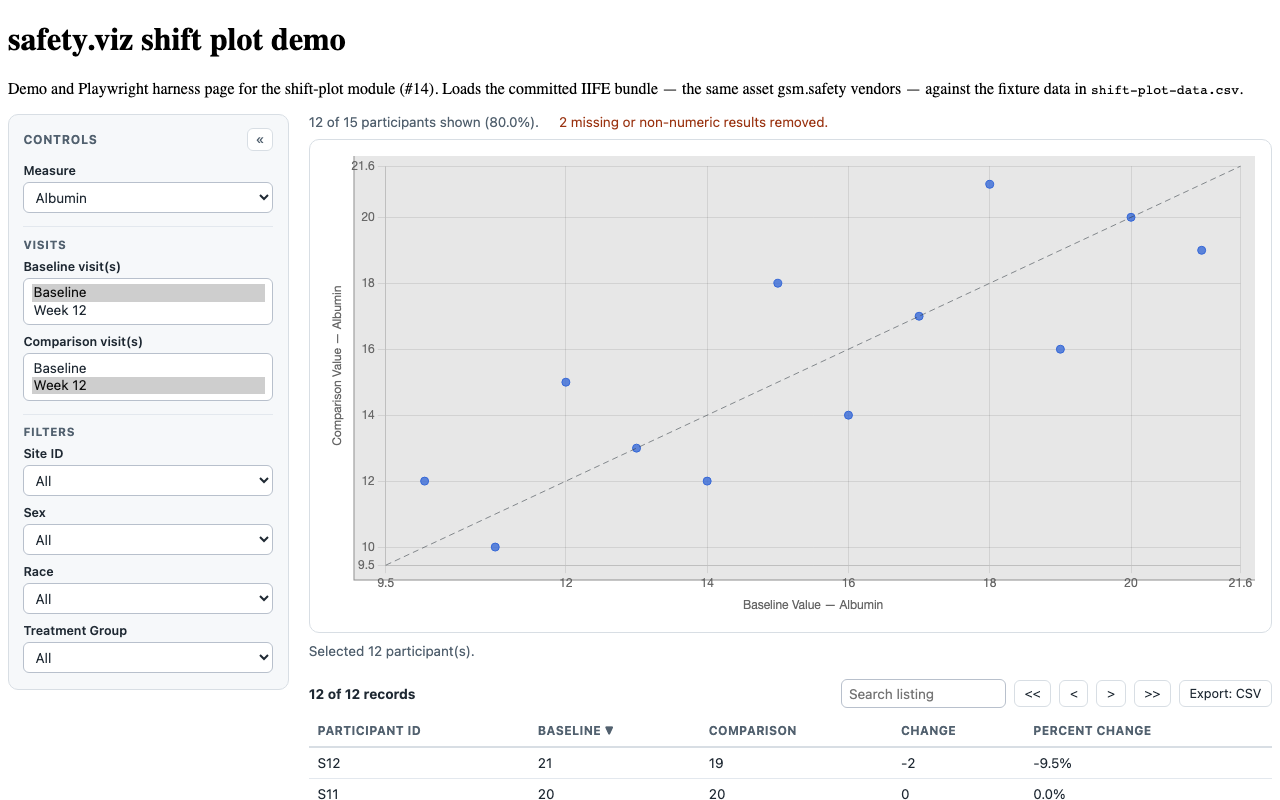
SSP-REG-008/SSP-REG-009/SSP-REG-010 SSP-REG-008 Confirm that Search works to filter the data displayed in the listing SSP-REG-009 Confirm that Sort works in the listing by clicking on column headers SSP-REG-010 Confirm that you can export the displayed data to a csv via via the Export: CSV button | SSP-REG-008, SSP-REG-009, SSP-REG-010 | #14 |
 |
SSP-API-003/PPRF-SSP-004 SSP-API-003 The custom | SSP-API-003 + PPRF-SSP-004 (participant-profile matrix) | #14 |
|
SSP-API-001 (module scheme) SSP-API-001 A factory to create a custom webChart chart object. | — (see legacy-API note) | #14 |
|
SSP-REG-016/SSP-REG-018 SSP-REG-016 Confirm that the chart appears between controls and listing. SSP-REG-018 Confirm that the controls appear to left of chart. | SSP-REG-016, SSP-REG-018 | #14 |
|
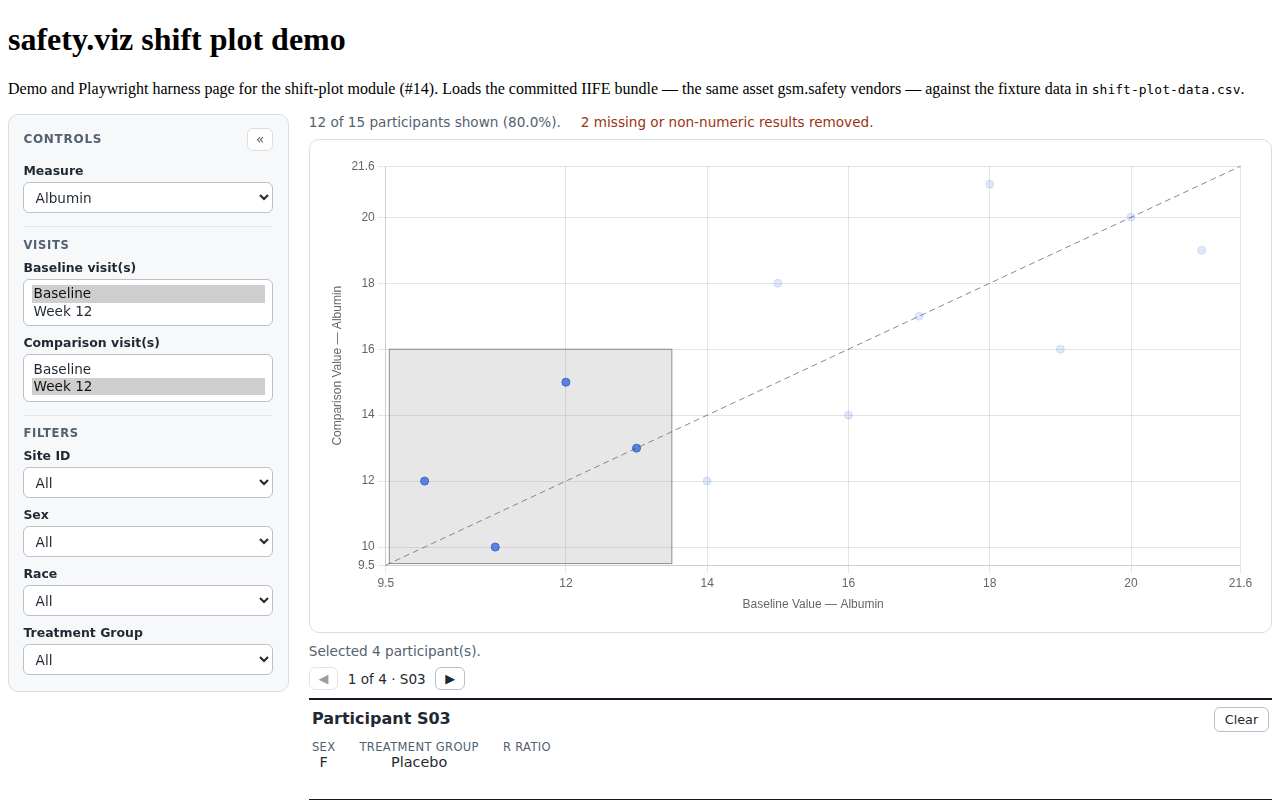
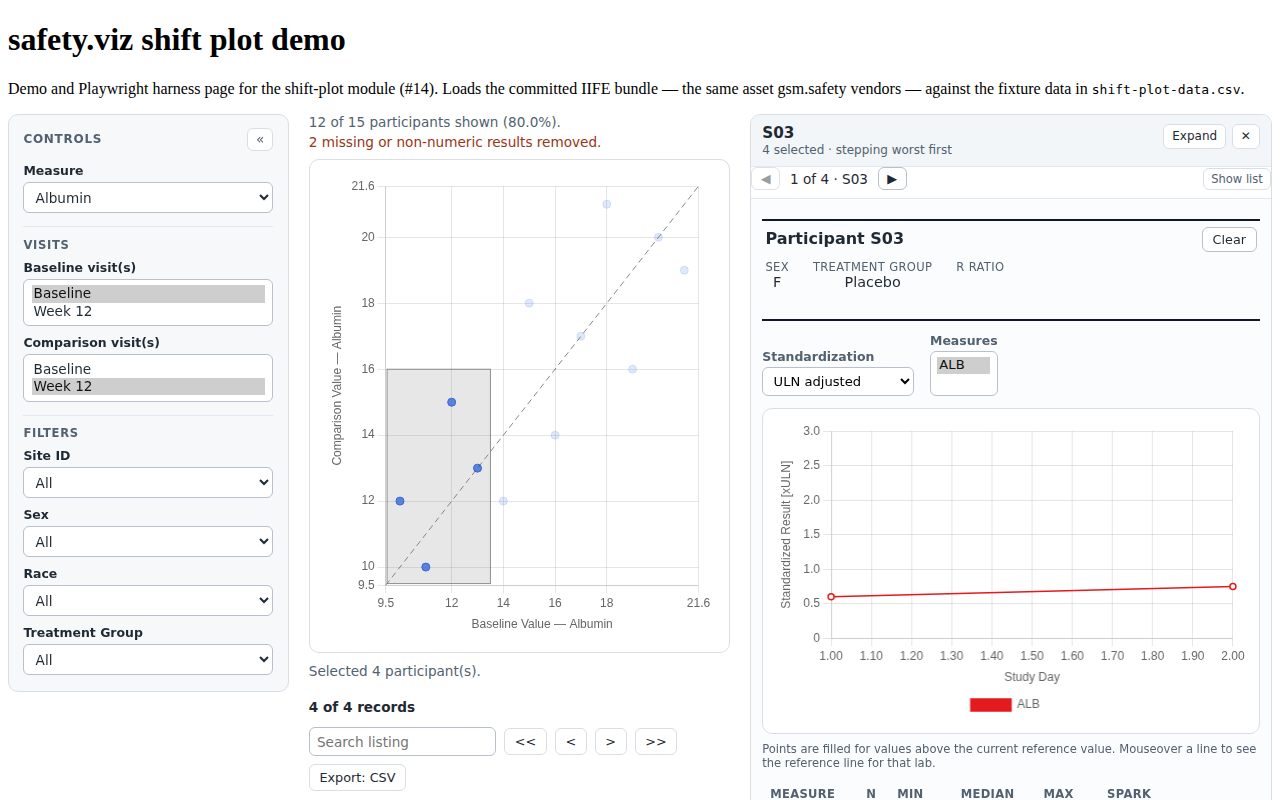
PPRF-SSP-001 | PPRF-SSP-001 (participant-profile matrix) | #99 |
  |
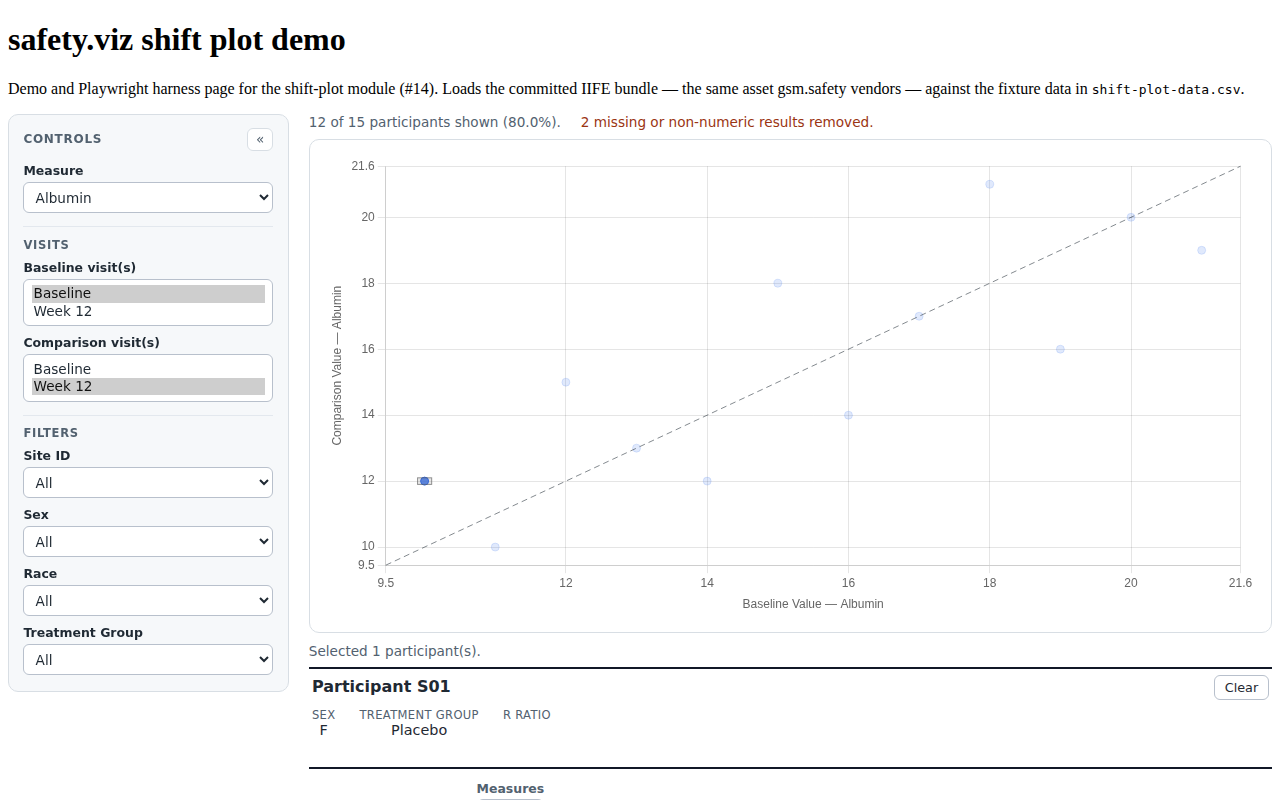
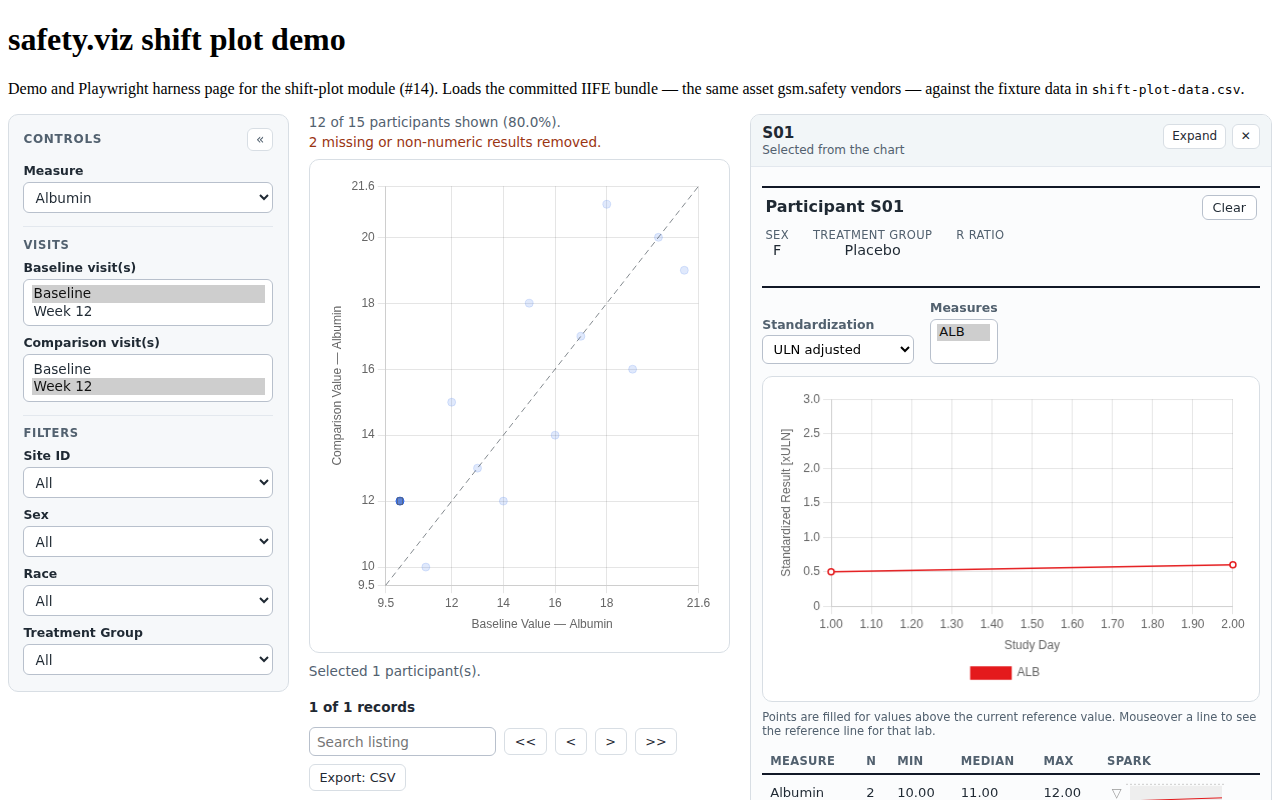
PPRF-SSP-002 | PPRF-SSP-002 (participant-profile matrix) | #99 |
  |
PPRF-SSP-003 | PPRF-SSP-003 (participant-profile matrix) | #99 |
|
Unit evidence (Vitest — tests/unit/shift-plot/)
17 requirement rows · 78 tests
| Requirement | Source matrix rows | Issue | Tests & evidence |
|---|---|---|---|
SSP-CFG-004/005/006 SSP-CFG-004 an object that defines the baseline value SSP-CFG-005 an object that defines the comparison (or post-baseline) value SSP-CFG-006 an array of filter variables and associated metadata | SSP-CFG-004, SSP-CFG-005, SSP-CFG-006 | #14 |
|
SSP-REQ-005 SSP-REQ-005 Display the raw data records, including the subject identifier, baseline value, comparison value, change, and percent change | SSP-REQ-005 | #14 |
|
SSP-REG-020 SSP-REG-020 Confirm that invalid results are removed from the data rather than measures with any invalid results. Invalid results include missing and non-numeric values. Then confirm that the number of removed results is noted in the console (You can confirm by downloading the data from CAT, updating the STRESN column so a few values are bad. When you reupload the edited data you will see that the number changes appropriately in the console). | SSP-REG-020 | #14 |
|
SSP-DATA-001 SSP-DATA-001 Safety Shift Plot is initialized with JSON data files that match the format created by d3.csv(). The chart expects an ADaM-esque data structure by default, but can be customized to work with any dataset that contains one row per participant per time point per measure and includes the required columns specified below. | SSP-DATA-001 | #14 |
|
SSP-REG-013/SSP-REG-014 SSP-REG-013 Confirm that the User can specify visit_order_col that names a variable that orders the visits. SSP-REG-014 Confirm that Visit ordering can be set two ways: {"visit_col":"VISIT","visit_order_col":"VISITNUM"} to order visits sequentially and {"visit_col":"VISIT","visit_order_col":"VISIT"} to order visits alphanumerically. | SSP-REG-013, SSP-REG-014 | #14 |
|
SSP-CHART-001/SSP-REQ-005/SSP-REG-019 SSP-CHART-001 The chart plots one point per participant: their baseline-visit value on the x-axis against their comparison-visit value on the y-axis for the selected measure. SSP-REQ-005 Display the raw data records, including the subject identifier, baseline value, comparison value, change, and percent change SSP-REG-019 Confirm that when a measure contains fewer than five unique values it isn't removed from the data (edit the dataset ADBDS so that it contains at least two results for the same measure from the same USUBJID. The shift plot is plotting the baseline value on the x-axis and the comparison value on the y-axis which requires at least two results). | SSP-CHART-001, SSP-REQ-005, SSP-REG-019 | #14 |
|
SSP-CFG-005 SSP-CFG-005 an object that defines the comparison (or post-baseline) value | SSP-CFG-005 | #14 |
|
SSP-CTRL-001/SSP-CTRL-003 SSP-CTRL-001 This drop-down menu is used to filter the lab variable that is displayed in the chart. The default measure is set to the first variable in the data set, but the default value can be adjusted to any measure upon the project team's request. Users can select any pre-defined measure in this filter. Selecting a measure will display the data points associated with that measure and will display the visits that the measure is collected at underneath the chart. SSP-CTRL-003 The chart can be configured to have any number of data filters. Each specified filter has a drop-down menu that is used to filter the visit data that is displayed in the chart. | SSP-CTRL-001, SSP-CTRL-003 | #14 |
|
SSP-CHART-002 SSP-CHART-002 Both axes carry one shared domain, so the dashed identity reference line marks y = x at 45° and a participant's shift is read as distance from that line. | SSP-CHART-002 | #14 |
|
SSP-SCALE-001 SSP-SCALE-001 An Axis Type control switches both scatter axes between a linear and a logarithmic scale together; because the identity line requires one domain shared by both axes, the choice applies to the pair and never to one axis alone. The initial choice comes from the axis_type setting and defaults to linear. | SSP-SCALE-001 | #136 |
|
SSP-SCALE-002 SSP-SCALE-002 On a logarithmic scale the shared domain is derived from the strictly positive values only and padded multiplicatively rather than additively, so the lower bound is always greater than zero and no point sits on the frame. | SSP-SCALE-002 | #136 |
|
SSP-SCALE-003 SSP-SCALE-003 A participant pair whose baseline or comparison value is zero or negative cannot be placed on a logarithmic axis; the pair is removed rather than clamped or imputed, the shown-of-total participant count reflects the removal, and the number of pairs removed is reported in the note above the chart alongside the invalid-result count. | SSP-SCALE-003 | #136 |
|
SSP-DATA-001/SSP-DATA-003 SSP-DATA-001 Safety Shift Plot is initialized with JSON data files that match the format created by d3.csv(). The chart expects an ADaM-esque data structure by default, but can be customized to work with any dataset that contains one row per participant per time point per measure and includes the required columns specified below. SSP-DATA-003 No customization is needed to initialize a chart when the | SSP-DATA-001, SSP-DATA-003 | #14 |
|
PPRF-SSP-001..004 | PPRF-SSP-001..004 (participant-profile matrix) | #99 |
|
SSP-FILT-001..004 (shared filter contract) SSP-FILT-001 A filter spec accepts SSP-FILT-002 SSP-FILT-003 SSP-FILT-004 | SSP-FILT-001, SSP-FILT-002, SSP-FILT-003, SSP-FILT-004 | #166 |
|
SSP-MEAS-001/002 (measures whitelist) SSP-MEAS-001 The SSP-MEAS-002 A configured measure absent from the data is dropped from the Measure control with a console warning naming it; when none of the configured measures is present the control falls back to every measure in the data rather than rendering empty. | SSP-MEAS-001, SSP-MEAS-002 | #136 |
|
SSP-CTRL-004 (whole-chart reset) SSP-CTRL-004 A "Reset chart" control at the foot of the control panel restores every settings-derived control to its configured default (measure, axis type, baseline/comparison visits and their statistics, filters), re-derives the data-driven defaults the settings do not carry — the opening measure and the baseline/comparison visit resolution of SSP-CFG-004/005, all three of which the settings leave null — clears the brush selection, the linked listing and the railed profile, and re-renders. | SSP-CTRL-004 | #136 |
|
Visual evidence
Every screenshot below is a committed baseline: the same PNG is the visual-regression baseline the browser suite asserts against and the evidence artifact shown here. Click any capture for the full-resolution image.
PPRF SSP 001 docked stepper PPRF SSP 001 railed stepper PPRF SSP 002 docked full profile PPRF SSP 002 railed full profile SSP COUNT 001 participant count SSP CTRL 001 baseline scatter SSP REG 008 linked listing SSP REG 020 invalid data note SSP REQ 003 brushed selection SSP SCALE 001 log axes
Source-matrix routing status (45 rows)
Of the 45 SSP-* rows, 38 are covered by the browser/unit evidence above and 7 are descoped with rationale below (honest routing per the histogram precedent). The count rose from 39 in #136: four new SSP-SCALE-* rows for the axis-type toggle, plus SSP-CHART-001 and SSP-CHART-002 backfilled — the module's central behavior had been named only in source comments and test titles, never in the matrix.
- Descoped — legacy Webcharts/CAT (5 rows): - SSP-API-001 ("a factory to create a custom Webcharts chart object") describes the legacy Webcharts API, which the designs intentionally do not preserve. The module ships the pilot's lifecycle API instead —
SSP-API-001in the module scheme (see the browser table). - SSP-CFG-001 and SSP-CFG-002 are legacy Webcharts settings passthrough/detail; the nextgen module exposes an explicit settings object (ShiftPlotSettings, covered bySSP-CFG-004/005/006) rather than accepting Webcharts configuration objects. - SSP-DATA-004 is a CAT/viz-library "customized chart with queries" example page; the nextgen demo uses the standalone real-data page instead. - SSP-REG-020's CAT download/edit/re-upload workflow is descoped; the underlying behavior it verifies (invalid results removed row-by-row, with a reported count in a console warning and a visible note) is covered. - Descoped — secondary decoration (1 row): - SSP-REG-007 (marginal box-and-whisker markers with N / percentiles / mean / SD tooltips) is a secondary axis decoration from the original Webcharts renderer; the core shift comparison (scatter, identity line, and the per-point tooltip of
SSP-REG-006) is fully implemented. A follow-up can add marginal box plots if a study needs them. - Adapted — layout (1 row): - SSP-REG-017 ("the listings appear to the right of the chart") is superseded by the shared renderer shell (#17), which standardizes the listing below the chart across every renderer (matching the histogram). Controls-left / chart-above-listing (
SSP-REG-016,SSP-REG-018) hold and are enforced bytests/e2e/site.spec.js. SSP-REG-015 ("fits on one page") — flagged vague in the AI review — is addressed by the fixed 460px chart area and the responsive shell rather than a pixel assertion.
Axis type: linear / log (#136, SSP-SCALE)
The oldest request in the legacy sweep — RhoInc/safety-shift-plot#3 (brittsikora, April 2016): "Auto-scaling was throwing people off, so add ability to set limits. Or toggle between log axis and linear." This module answers the log/linear half. The axis-limits half is deliberately a separate follow-up: it means adopting the shared src/axis-limits.js (already consumed by histogram, outlier-explorer, results-over-time and hep-explorer) and re-opening a UX question this module has not answered — one pair of boxes governs BOTH axes here, so the section would be "Axis Limits", not the per-axis form every existing consumer ships.
Two facts shape the behavior:
- The scale type is per-chart, not per-axis. shift-plot has exactly one domain, shared by x and y; that shared domain is what makes the dashed identity line mean y = x. Two axes on different scale types could not share it (SSP-SCALE-001).
- A logarithmic axis has no room for 0 or a negative number. Two consequences, both made explicit rather than left to chance: - The domain is padded multiplicatively on the log scale, over the strictly positive values only, so the lower bound can never reach zero (SSP-SCALE-002). The linear 5% pad is not merely imprecise here — it goes negative on any wide-range measure (Alkaline Phosphatase spans 27..624 in the demo data, padding to -2.85), and a non-positive bound makes
getPixelForValuereturn NaN, blanking the chart and vanishing the identity line. - A participant pair with a non-positive baseline or comparison value is removed and reported — never clamped, never imputed, never silently dropped (SSP-SCALE-003). Clamping would move a participant's clinical result; a silent drop would misstate how many participants the chart speaks for. The note above the chart carries the count beside the invalid-result count, and because the shown-of-total figure ischartPairs.length, the participant count stays honest on its own. The removal is coupled: one shared domain governs both axes, so a participant with a valid baseline and a zero comparison disappears entirely — which is why the count is stated rather than implied.
identityLinePlugin needs no change: it draws corner-to-corner in pixel space through scales.x/y.getPixelForValue, and with both axes on the same domain and the same scale type that segment is still exactly the locus y = x.
The non-positive-removal path is covered by unit evidence (scale-toggle.test.js) rather than Playwright: the e2e fixture's values are all positive (Albumin 10–21, Pulse 65–80) and two existing assertions are pinned to its exact shape ("12 of 15 participants shown (80.0%)" and "2 missing or non-numeric results removed."), so adding a non-positive row to the fixture would move unrelated assertions. The browser test covers the toggle itself and the shared-domain guarantee.
Railed participant profile (#99, PPRF-SSP)
The shared participant-profile module mounts in the rail beside the chart (config-on, profile: true) and is fed by the renderer's brush selection via the participantsSelected dispatch — the rail SUPPLEMENTS the linked listing (records vs story), replacing nothing. shift-plot is the rollout's stepper renderer: a brush routinely catches several participants, so the rail collapses to the worst-first cohort stepper ("1 of N"), stepper navigation border-emphasizes the stepped point on the chart without re-dispatching, and a single-point brush shows the full profile directly. The adoption moved the SSP-API-003 dispatch target from the host element to the shell root (PPRF-SSP-004) — backward-compatible because the event bubbles. Adoption rows are PPRF-SSP-001..004 in the participant-profile matrix; unit evidence lives in tests/unit/shift-plot/profile-adoption.test.js.
View-selector rollout (VIEW-3, #76)
One primary display — the baseline-vs-comparison scatter. The linked listing is a brush-selection drill-down shown in addition to the chart, not a mutually-exclusive view switch. Ruled single-view in the shared view-selector rollout (#76) — no view control is added; see view-selector-inventory.md.
Reproducing this report
The evidence set is regenerated from a full test run and committed with the code it qualifies; CI fails when they drift. To verify or rebuild it:
npm ci
npm run evidence:check   # compare a fresh run against the committed evidence
npm run evidence         # regenerate docs/evidence/shift-plot/evidence.json
Screenshot baselines are canonical to the Linux CI runner; the repository's Update evidence baselines workflow is the authoritative way to refresh them. See CONTRIBUTING.md for the traceability convention.