R/Pharma Diary #3 — Re-Introducing safetyGraphics
As part of the keynote, I want to see if AI can update and modernize {safetyGraphics}. {safetyGraphics} was the first big open-source project I worked on, so I also want to talk a bit more generally about open source in clinical trials. I’ll mention a bunch of projects, but mostly I want to give credit to a bunch of great people that I’ve worked with over the years1. Usually acknowledgements go at the end of a talk, but let’s just get started on that now.2
A Brief Prehistory
I played with computers a ton as a kid, learned to program a bit in high school and then for real in college. I remember that at one point in undergrad I took a Computer Engineering class where we wrote a compiler from scratch — like from 0s and 1s. I also programmed a message board in Perl and did a bunch of other computer science-y stuff, but didn’t love the theory or algorithms or the grind of debugging. I liked building things, but also wanted to do something that helped people in some way. So, after teaching middle school for a year3, I went back to school for biostatistics.4
I wrote a bunch of SAS code in grad school, including an 80-page-long master’s paper that was probably 60 pages of SAS Graph output.5 It was … not my favorite project. Then at my first job, @acalatroni6 introduced me to R, and it was soooooooo much better. This was in the early 2000s, so pre-{tidyverse} and {ggplot}. I remember a lot of super-complicated {lattice} code.
A few years into that job, I started seeing interactive graphics like the one above in the New York Times and thought, “Why can’t I do this for work?” And my boss7 said, go for it,8 and let me take 2 weeks to learn JavaScript! I used D3 (called Protovis back then) to make the clunkiest interactive graphic ever.9 And THAT was fun!
I did that for a bunch of years. Made interesting stuff for clinical trials in R and JavaScript. I started out working on NIH-funded Asthma and Allergy work, where I helped to write a bunch of papers. Finally, I moved from my study statistician role into a pure data science title10, where I was just focused on creating useful tools for clinical trials. I got to hire and work with a bunch of amazing people — all of whom still do great open source work! The industry started doing more work in R, so we did too. We wrote lots of fancy {ggplot} code, wrapped our D3 renderers in {htmlwidgets}, hosted them in {shiny} apps, and piped it all around with {tidyverse}.11 We still wrote JavaScript code, but mostly we shared things using R, since that was what people were using in clinical trials.
ASA-DIA Working Group
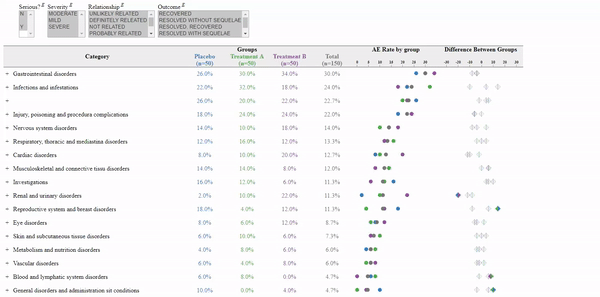
My team was called the Graphics Group, and we shipped a lot of tools — much of which are still publicly available and useful! We released open-source tools on GitHub, wrote papers with study teams, and presented a few early JavaScript prototypes, including an Interactive Adverse Event Explorer.12
Then I got invited to join a new-ish working group13 for safety monitoring14 and eventually ended up co-leading that working group.15 What made the working group special was how closely the clinicians and data scientists actually worked together. The doctors knew how to monitor trials, and we knew how to build the tools to help them do it.
One thing we all agreed on was that the status quo was painful. I’d worked on several clinical study reports and the wall of numbers was 100% impenetrable (I always use this Harry Potter GIF to describe the experience). Interactive graphics make it so much easier to get to the data that really matter. Some analysis platforms existed, but were generally expensive and/or difficult to use. The clinicians didn’t need or want a full business intelligence suite allowing them open-ended access to every aspect of clinical data. They needed a guided clinical monitoring workflow supported by simple tools in their web browser, so that’s what we tried to build.
{safetyGraphics}
So what is {safetyGraphics}, exactly? All those scattered prototypes — the Adverse Event Explorer, the eDISH hepatic explorer, and a bunch of others — eventually came together into a single open-source R package: a Shiny app that lets a clinical team explore a trial’s safety data interactively in the browser, instead of paging through hundreds of static tables. The best way to understand {safetyGraphics} is to play with the tool. The full demo app is here.
People across dozens of companies met regularly for 5 years. We wrote papers, presented at a bunch of conferences and at the FDA. We met with the world’s leading experts on clinical trial safety and did our best to create easy-to-use free tools based on their expertise that allowed anyone to leverage that knowledge.
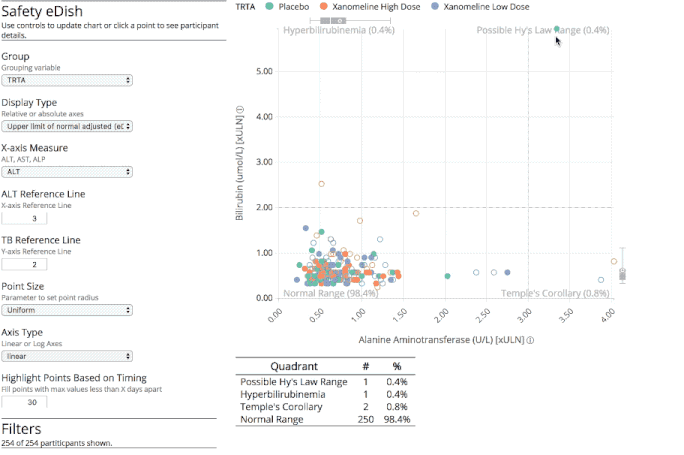
I think the best work we did is this eDISH hepatic explorer — eDISH is the standard plot for flagging potential drug-induced liver injury — and the associated clinical workflow. There’s tons more information about the project at the website.
A Few Quiet Years
I stopped active work on {safetyGraphics} when I moved to Gilead in 2021 and started working on RBQM. My main goal with {safetyGraphics} was to demonstrate the value of both open-source tools and interactive graphics in clinical trials. We wanted to show that a handful of webpages is more useful and usable than a 200-page PDF. I think we did that. Now there’s a whole crop of impressive projects leveraging open-source tools in clinical trials (e.g. {teal} and submissions pilots).
What we didn’t do was change the industry standard for how people monitor safety, and that is just a bit of a bummer. Maybe we moved the needle a bit, but those 200-page walls of text still exist in Clinical Study Reports, and {safetyGraphics} isn’t fully GxP-compliant. pharmaverse is making progress towards modernizing submissions, but clinical trial monitoring both for RBQM and safety is still a grind.
Which brings me back to where I started. Doing {safetyGraphics} justice always felt like it needed a team and a budget I no longer have — but with AI agents, I’m honestly not sure that’s true anymore. Figuring out whether it is, is what this whole keynote experiment is about. The OpenRBQM team is already dragging clinical monitoring toward something more modern, and I think that work could give {safetyGraphics} a second life too.16 Up next: {safetyGraphics} ❤️ {gsm}.
-
I’m going to put all the overly sappy stuff in footnotes, so just skip them if you want. ↩
-
I’d better do the most important one first: Without Alexa, my incredible wife, I’d probably still be on a floor matress playing Warcraft 2 somewhere. Thank you for always encouraging and supporting my work and listening to me ramble on about R and AI and open source for a good long while before your eyes glaze over. I love you! 🥇👩 ↩
-
If you’re ever annoyed about your desk job, go teach 6th grade for a year. Good perspective. For me, teaching was maybe too much helping people and not enough programming … But I do thank all the kids for being funny and coming up with a million different jokes about my last name. ↩
-
Thanks to my parents for being amazing role models. They were both teachers in the Peace Corps. My mom was an epidemiologist working on child welfare. My dad was a programmer working for the state of NC. Helping people and programming all the way around. They’re also the best parents. ↩
-
SAS isn’t my jam, but the SAS class I took at UNC was amazing and taught me tons about statistical programming. Kathy Roggenkamp was one of the best teachers I ever had. ↩
-
Agustin is one of the best statisticians I know, and also an amazing friend and mentor. ↩
-
The amazing Herman Mitchell. I wish everyone got to have a boss/mentor that smart, funny and kind. ↩
-
Herman also let me work from Chile for 5 years before Zoom got good. Thanks for everything, Herman! ↩
-
I think it was to analyze allergen exposure thresholds for asthma exacerbations! ↩
-
Thanks to Russ Helms and everyone at Rho for encouraging innovation and supporting us for so long! ↩
-
Many thanks to the whole Posit team and R community for making open source in Pharma a real thing! Ramnath, Joe, and Phil in particular have been great collaborators at various points over the years. ↩
-
Inspired by Frank Harrell’s
{Hmisc}package. Frank was also a generous early collaborator on SafetyGraphics. ↩ -
The safetyGraphics team was a workstream of the Safety Working Group — a joint effort of the American Statistical Association Biopharm Working Group and Drug Information Association. ↩
-
Thanks Melvin. I still don’t know how you manage to find and remember every presentation related to clinical trial safety ever given. ↩
-
I learned a lot from the other members of the leadership team: James Buchanan, Susan Mayo, and Xiao Ni. ↩
-
AI collaboration note — I outlined the idea for this post and provided the source material. An AI model helped draft and organize it from my notes; I reviewed and edited the result before publication. ↩
Comments
Sign in with a GitHub account to join the discussion. Threads are powered by giscus and live as GitHub Discussions.