R/Pharma Diary #5 — Introducing safety.viz
My last post laid out the plan for {safetyGraphics} v2 and ended on the obvious question: can we actually do this? Here’s the first big answer: safety.viz is live.1
Intro to safety.viz
safety.viz is a charting library for monitoring clinical trial safety.
safety.viz is an updated JavaScript framework that modernizes2 the {safetyGraphics} renderers. Seven of the ten original {safetyGraphics} renderers are now shipped! The site includes robust demos of all the charts — go play with them here.
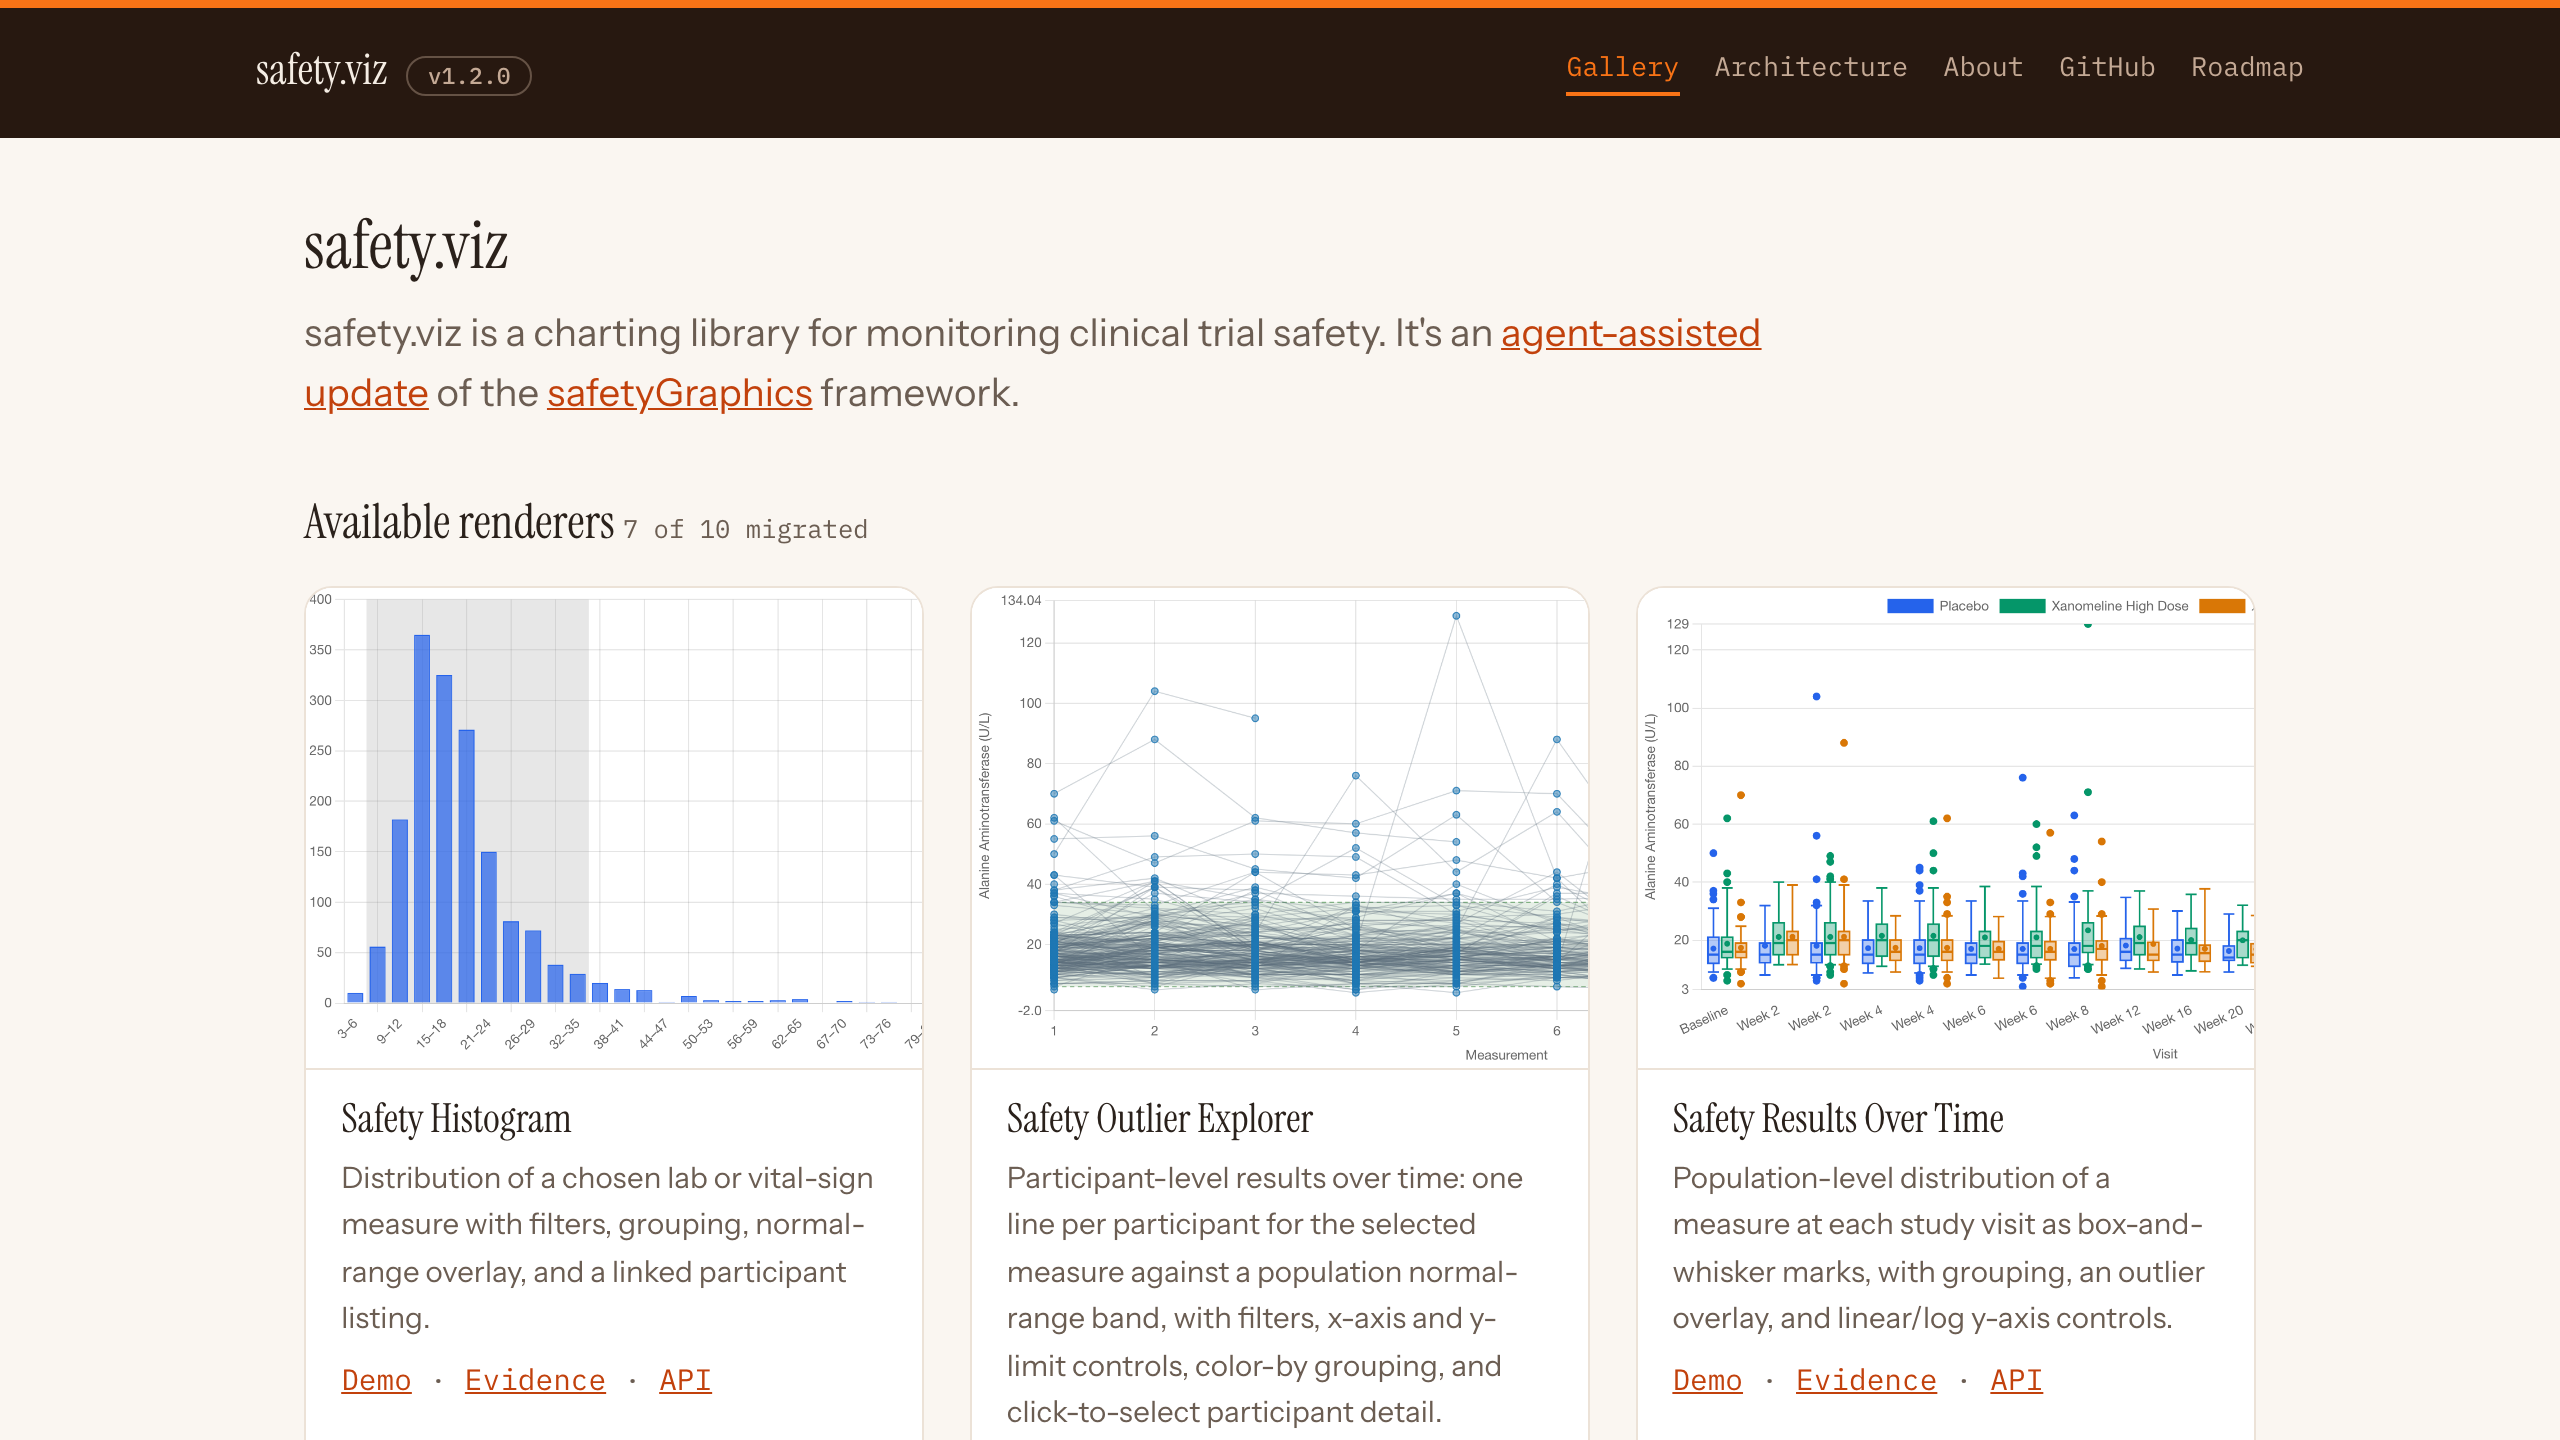
As of now, 7 of the core {safetyGraphics} charts are live:
| Chart | What it shows |
|---|---|
| Safety Histogram | Distribution of any lab or vital-sign measure, with normal-range overlay, treatment-group small multiples, and a linked participant listing |
| Safety Outlier Explorer | Every participant’s results over time as one line each, against the population — click a line to isolate a participant |
| Safety Results Over Time | Population distribution of a measure at each visit as box-and-whisker marks, with grouping and outlier flags |
| Safety Shift Plot | Baseline vs. comparison-visit values on a scatter — who moved, and which direction |
| Safety Delta-Delta | Paired change-from-baseline for two measures on one scatter (e.g. ALT change vs. AST change) |
| Adverse Event Timelines | Each participant’s AEs as timelines colored by severity, serious events marked, with click-through detail |
| Hep Explorer (eDISH) | Peak ALT vs. peak bilirubin on Hy’s-Law quadrants for drug-induced liver injury — click a participant for a coordinated drill-down: labs over time, visit path, and linked listing |
Point any of its seven interactive charts at your study data and review it in the browser: filter, group, zoom, and click through from a pattern on the screen to the participant records behind it. These are currently JavaScript only (usage instructions are here), but the {gsm.safety} R package should be done soon. Will share a follow-up post when it’s live.
Quality Framework
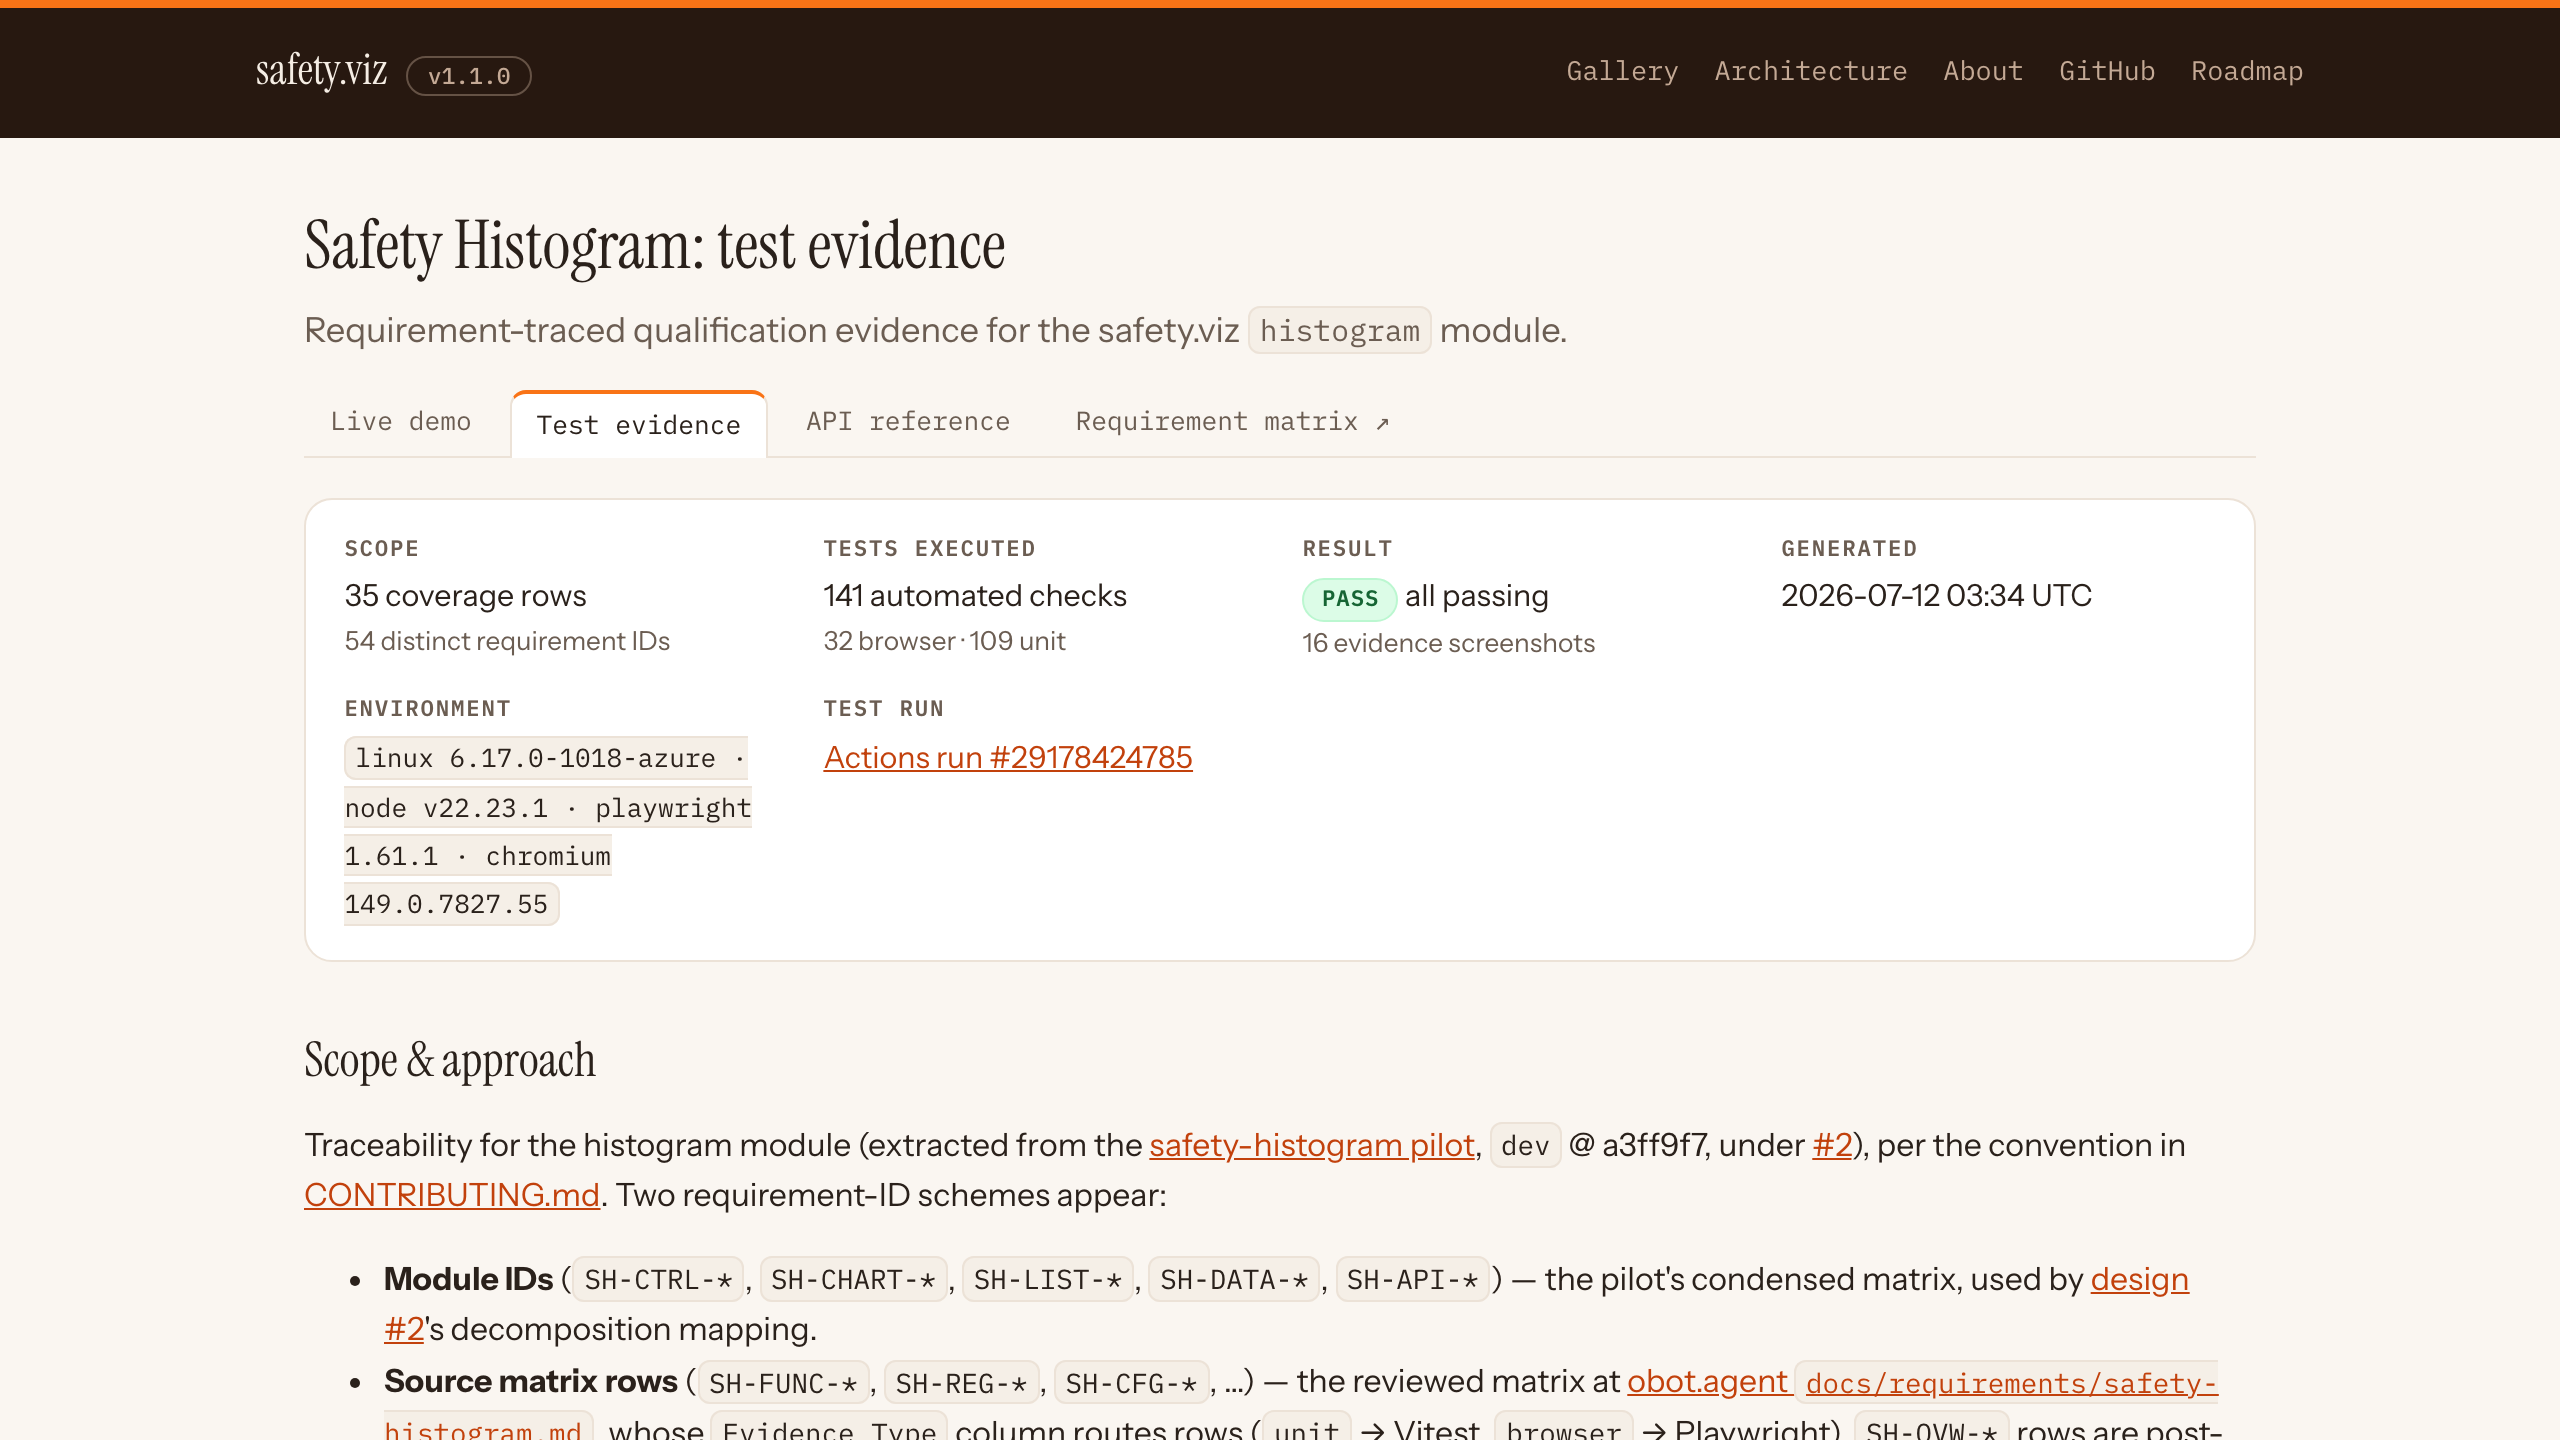
The most frequently asked question about {safetyGraphics} has always been: “Is it validated? Can I use it on actual studies?” The original answer was, “Not really. It’s exploratory”. safety.viz comes with a robust audit trail and extensive test evidence that is laying the foundation for GxP usage. Every chart traces to a reviewed requirement matrix from the original renderer’s documentation, with 249 unit tests and 94 browser tests keyed to requirement IDs and published as audit-style evidence reports.
Development Process
The next few posts will share lots more details about how I built this, but here’s a preview:
- v0.1.0 (Jul 11, 8 am) — The first prototype was the heavy lift — I spent multiple sessions across a few weeks updating
safety-histogram. I spent time reviewing the original charts, including the helpful requirement documents we had saved in the wikis. Made lots of decisions about packages and test frameworks and then spent several sessions updating the website so that the example pages looked nice and clean and there was solid, transparent test evidence. - v1.0.0 (Jul 11, 10:30 pm) — The structure from v0.1 unlocked agentic development in a meaningful way — v1.0.0 added 5 renderers in one session. The release came out later that same day.
- v1.1.0 (Jul 11, 11:50 pm) — The next release took about an hour. It updated all of the examples to use data from
{pharmaverseadam}, added a paneled all-measures view to the histogram, and updated the README. - v1.2.0 (Jul 12, 10 pm) — One day later, one of the most complex
{safetyGraphics}renderers,hep-explorer, went live insafety.viz! AND it ported the incredibly robust clinical guide from PDF to HTML as part of the chart documentation.
The obvious question after a weekend like that is how3? The next post describes how I moved from the OpenClaw Obot experiment of diary #2 to Obot v3 — a Claude Code scaffold built around a public roadmap and an agent playbook.
-
AI collaboration note — this post was drafted by Claude Code (using Fable 5) from the
safety.vizrelease notes and the project roadmap records; @jwildfire did a major re-write, and Claude did a final cleanup pass before publication. ↩ -
What does “modernize” mean here? The original renderers were built on 2015-era Webcharts and D3 v3. safety.viz rebuilds each one on Chart.js in modern JavaScript, with JSON-Schema data contracts, requirement-keyed automated tests, and published evidence reports. ↩
-
I promise the answer isn’t “work all weekend”. I watched 2 World Cup games and played with the kids, too! ↩
Comments
Sign in with a GitHub account to join the discussion. Threads are powered by giscus and live as GitHub Discussions.