R/Pharma 2026 · Keynote
What can we actually do with AI agents right now?
Jeremy Wildfire · 21 October 2026 · jwildfire.github.io/keynote
Hi, I'm Jeremy Open-source tools for clinical trials How AI fits into this world
I build open-source tools for clinical trials, and I’ve spent the last few years trying to figure out how AI fits into that world. That’s what this talk is about.
From the keynote, annotated (R/Pharma Diary #10).
First, a key collaborator
Introducing Orange
2008–2022
He was a very good cat.
A quick disclaimer
Jeremy works for the Biostat Innovation Group at Gilead, but this is all just his opinions.
Orange: our Chilean street cat Worked with me for years Disclaimer: Gilead, but my opinions
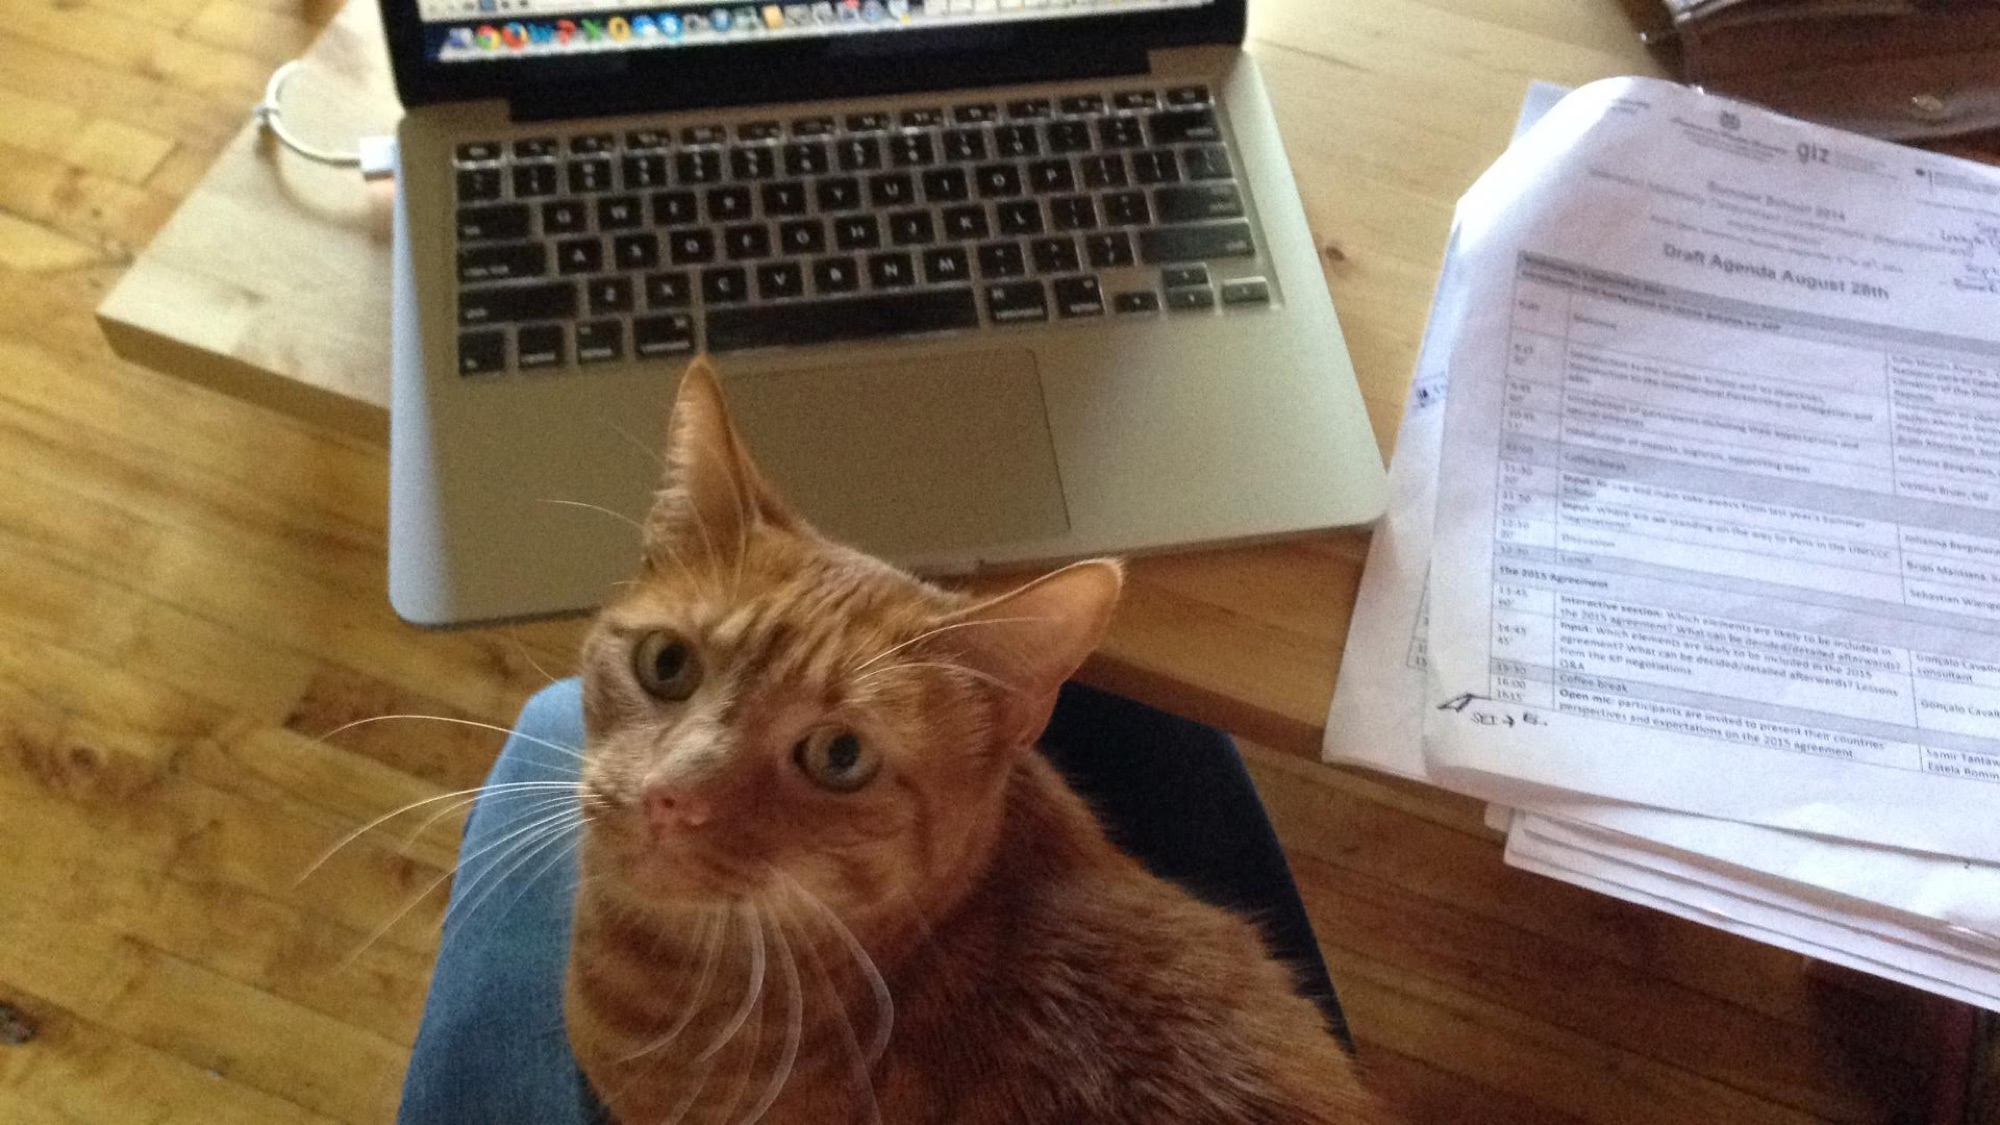
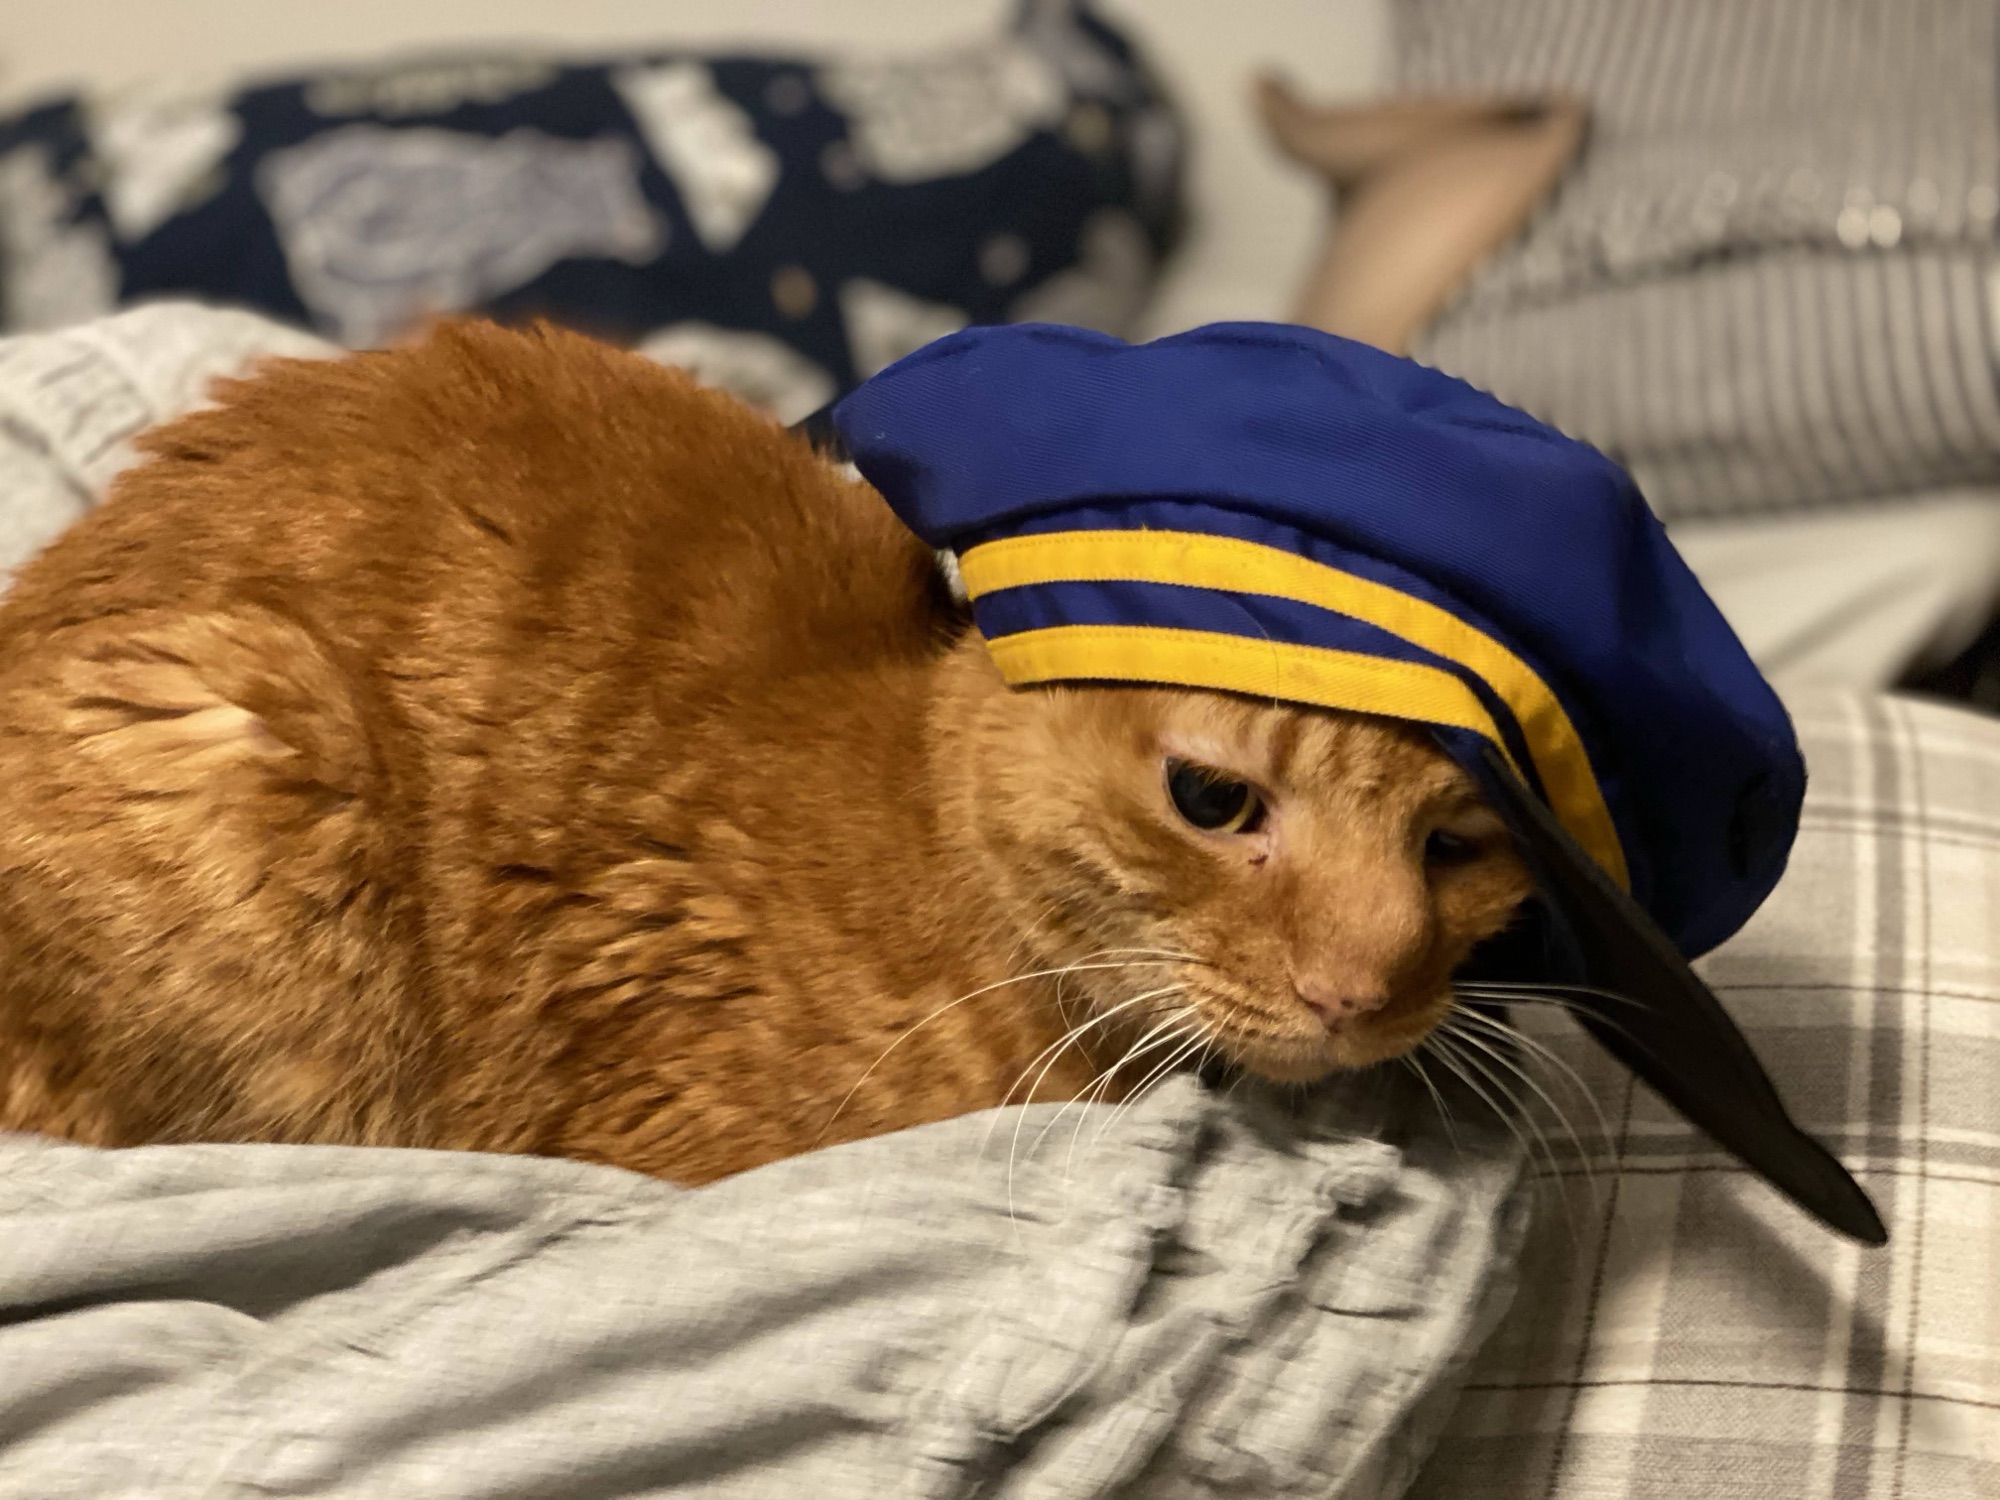
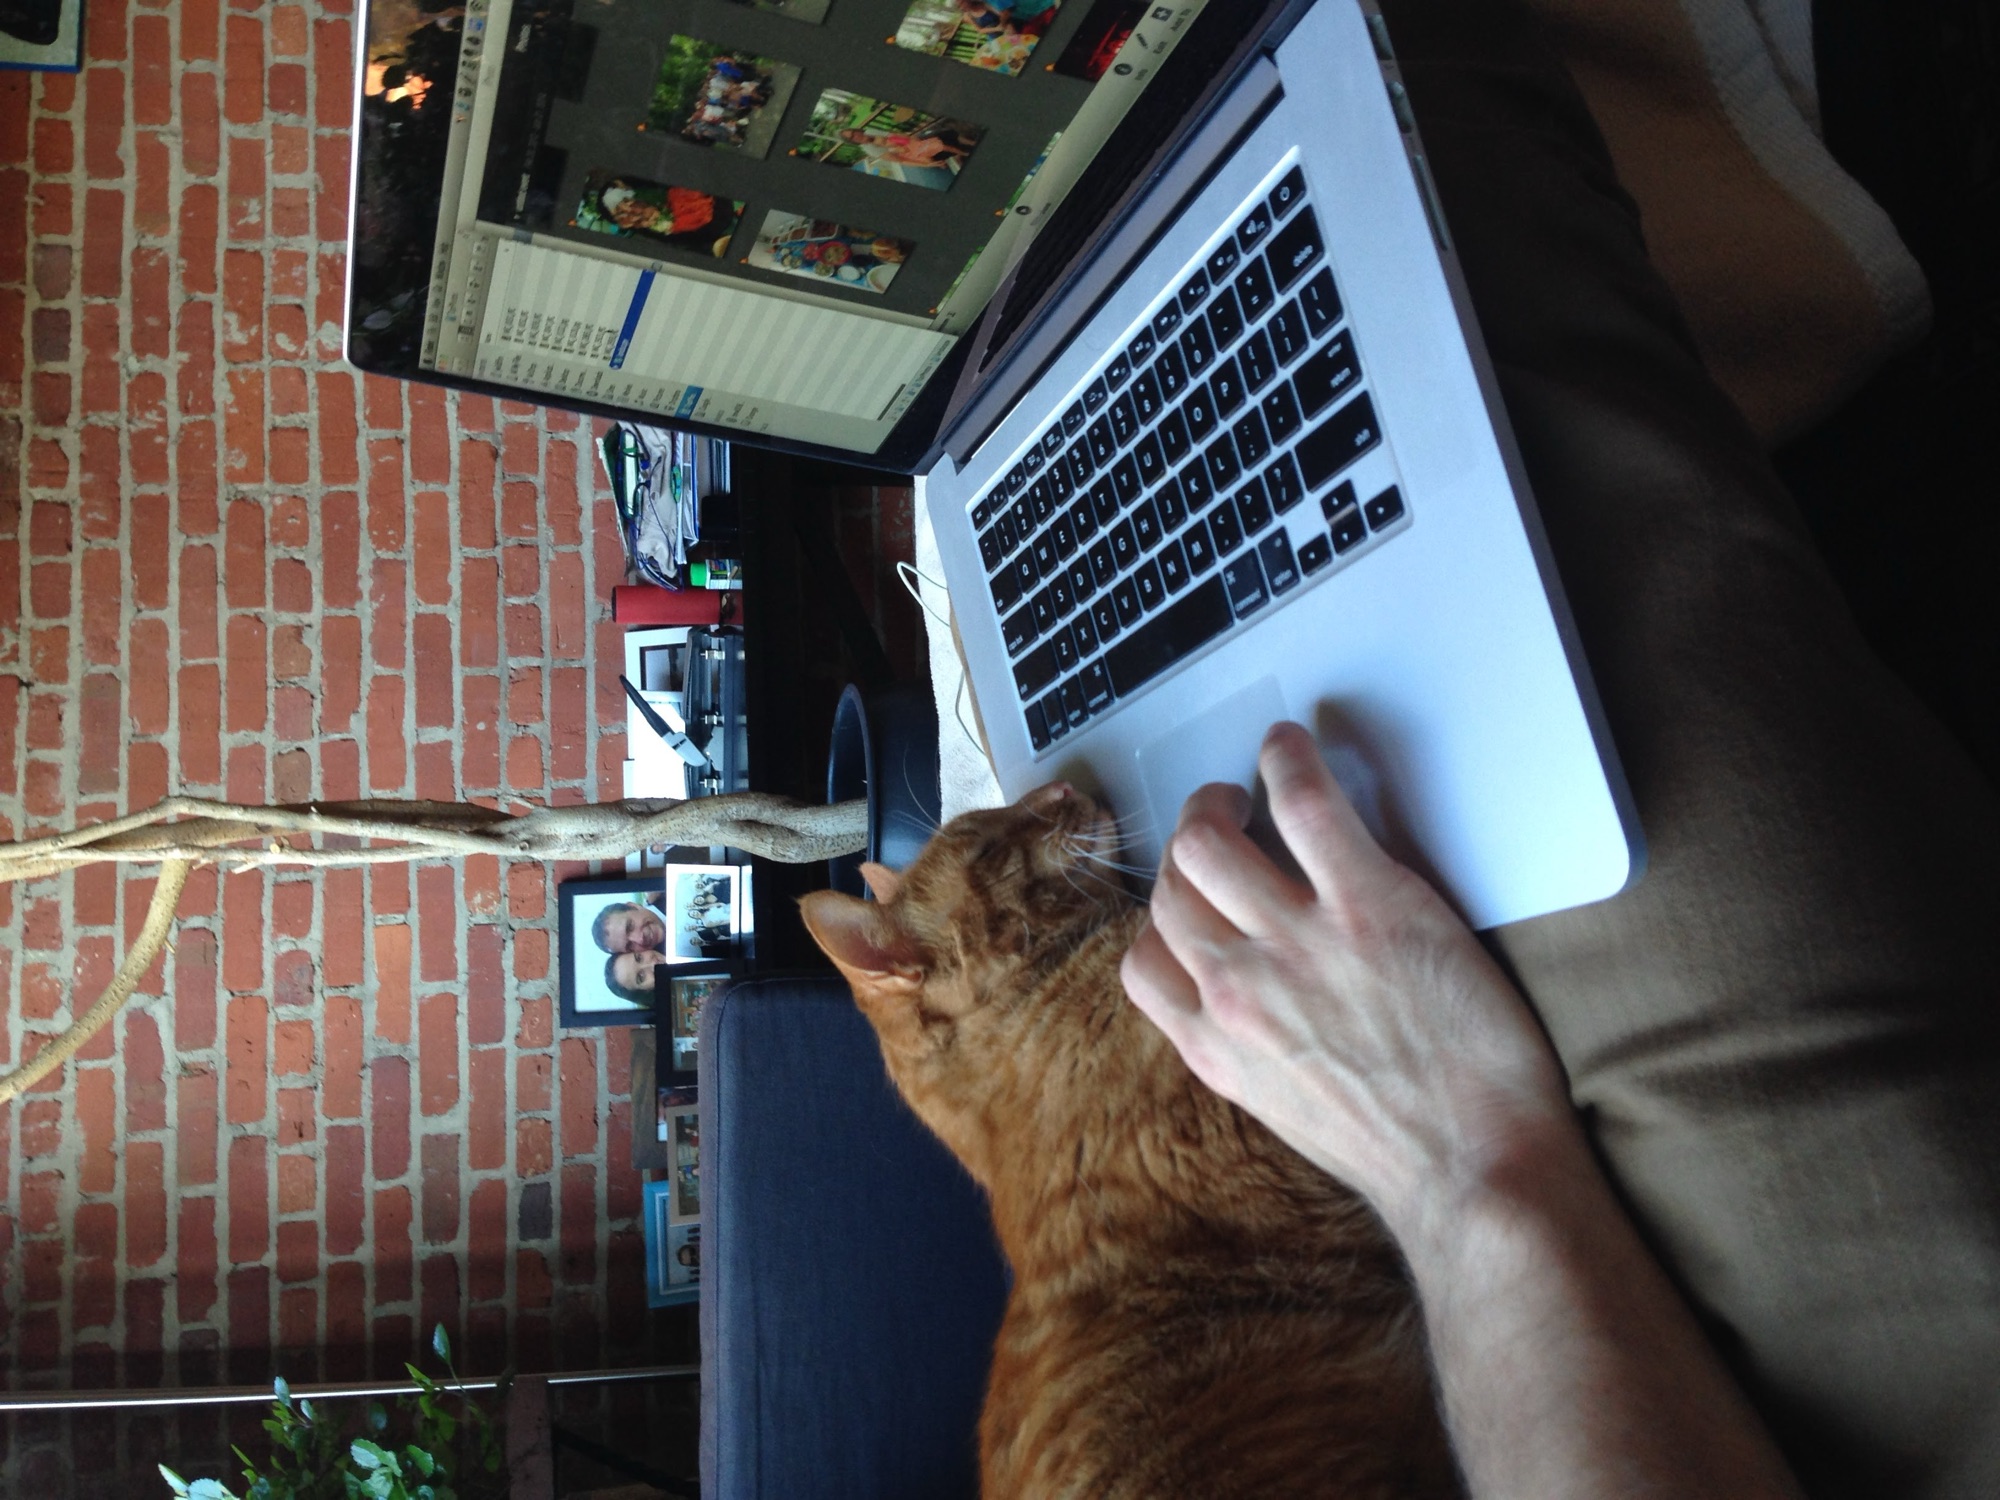
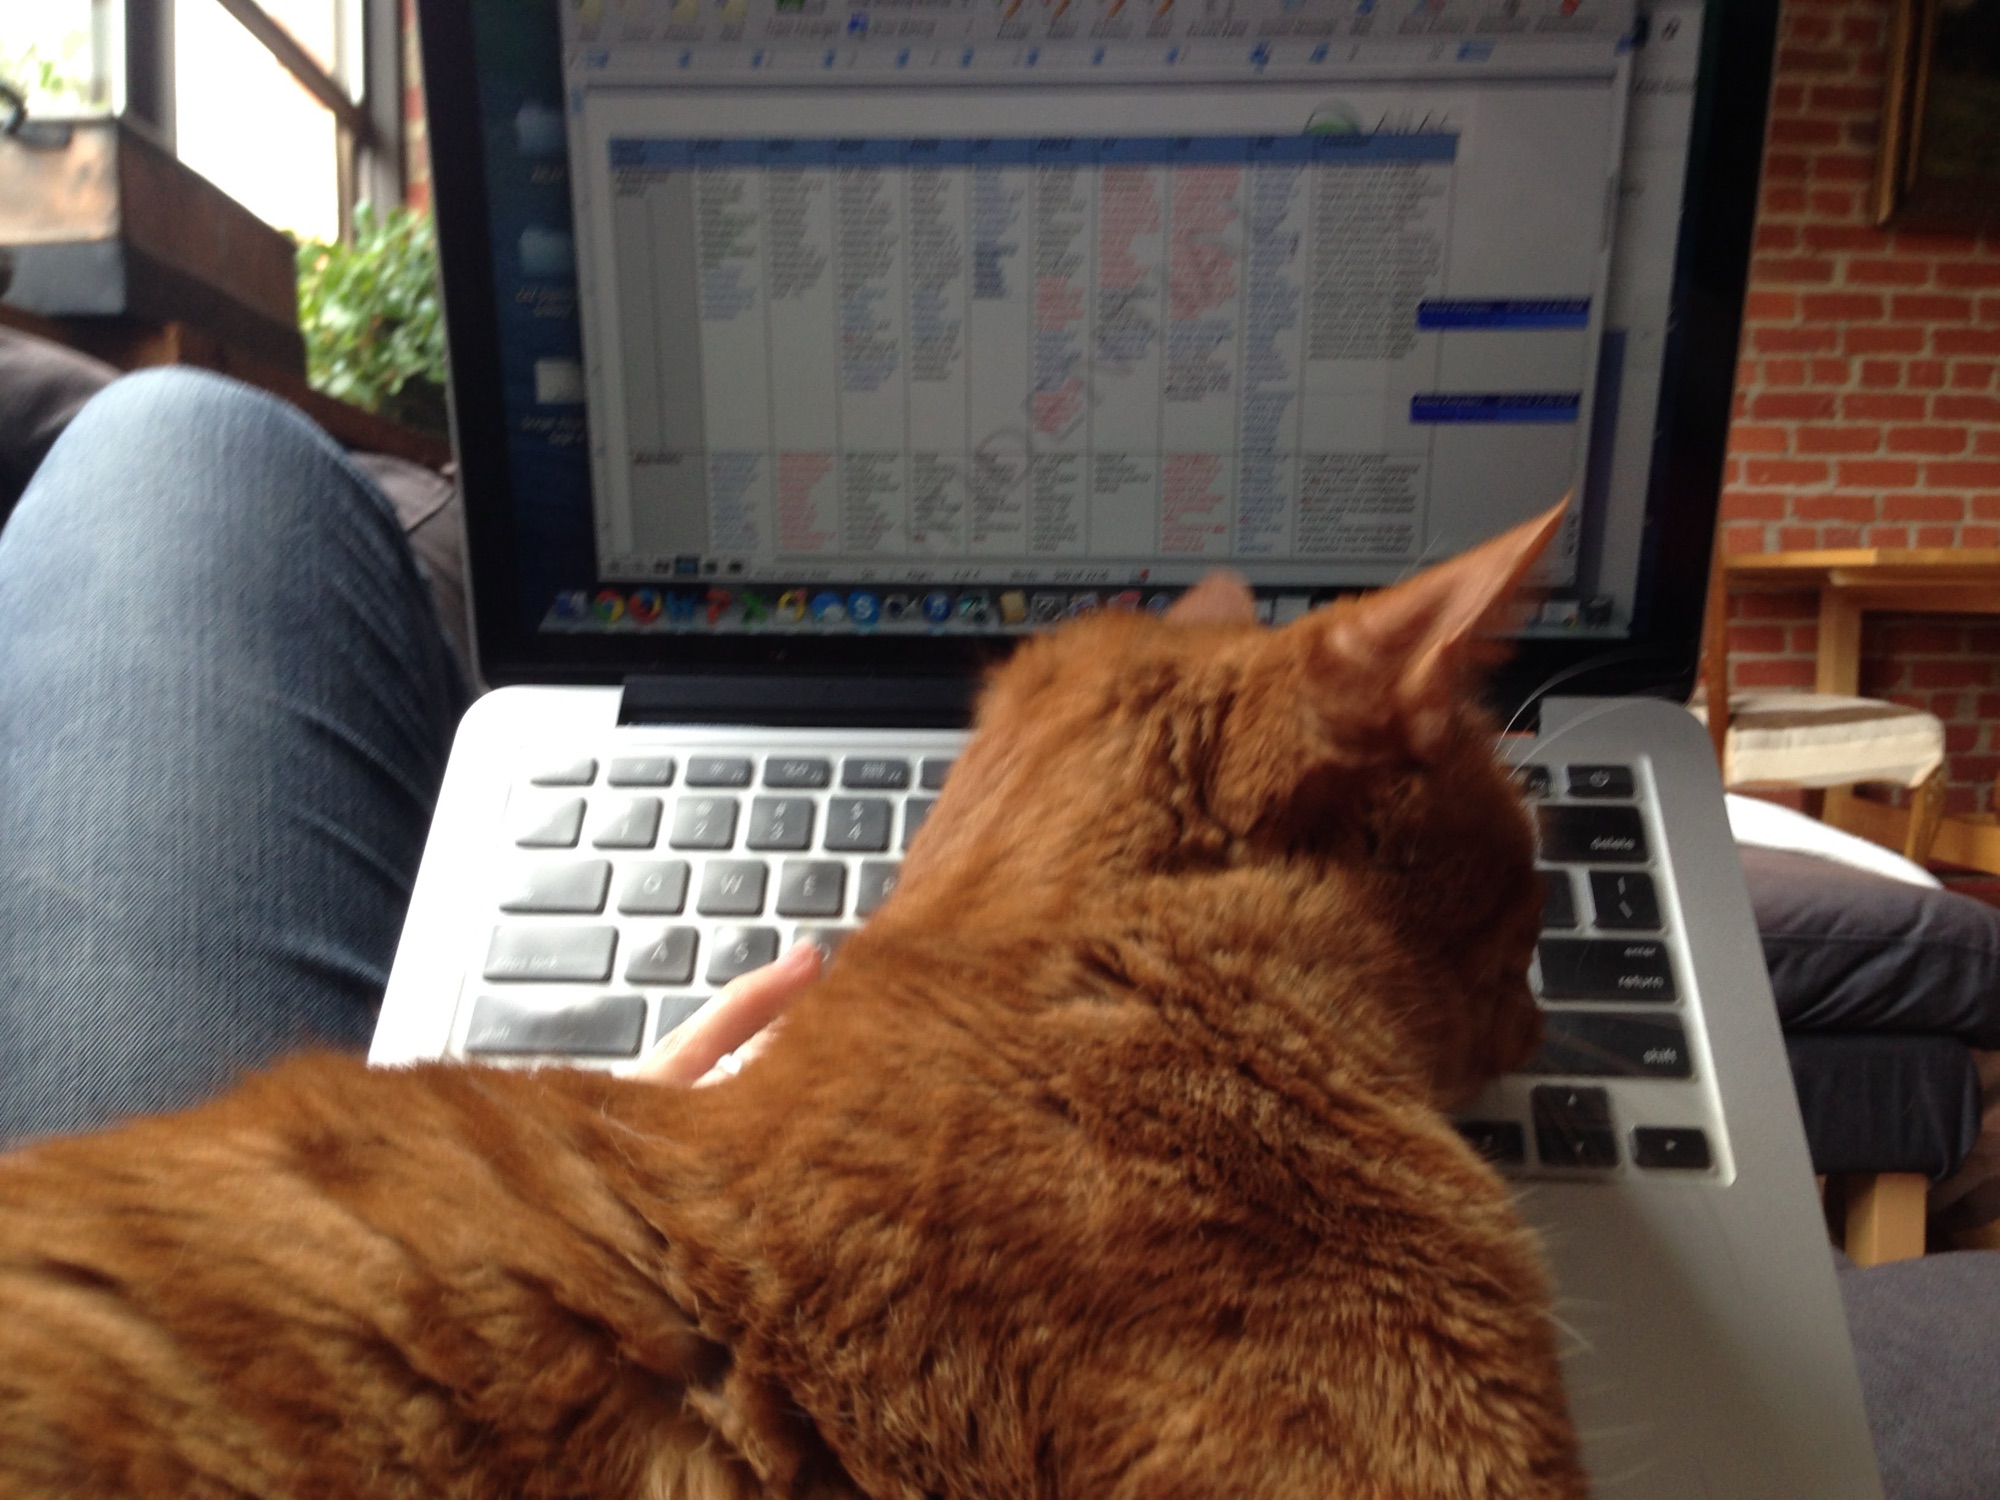
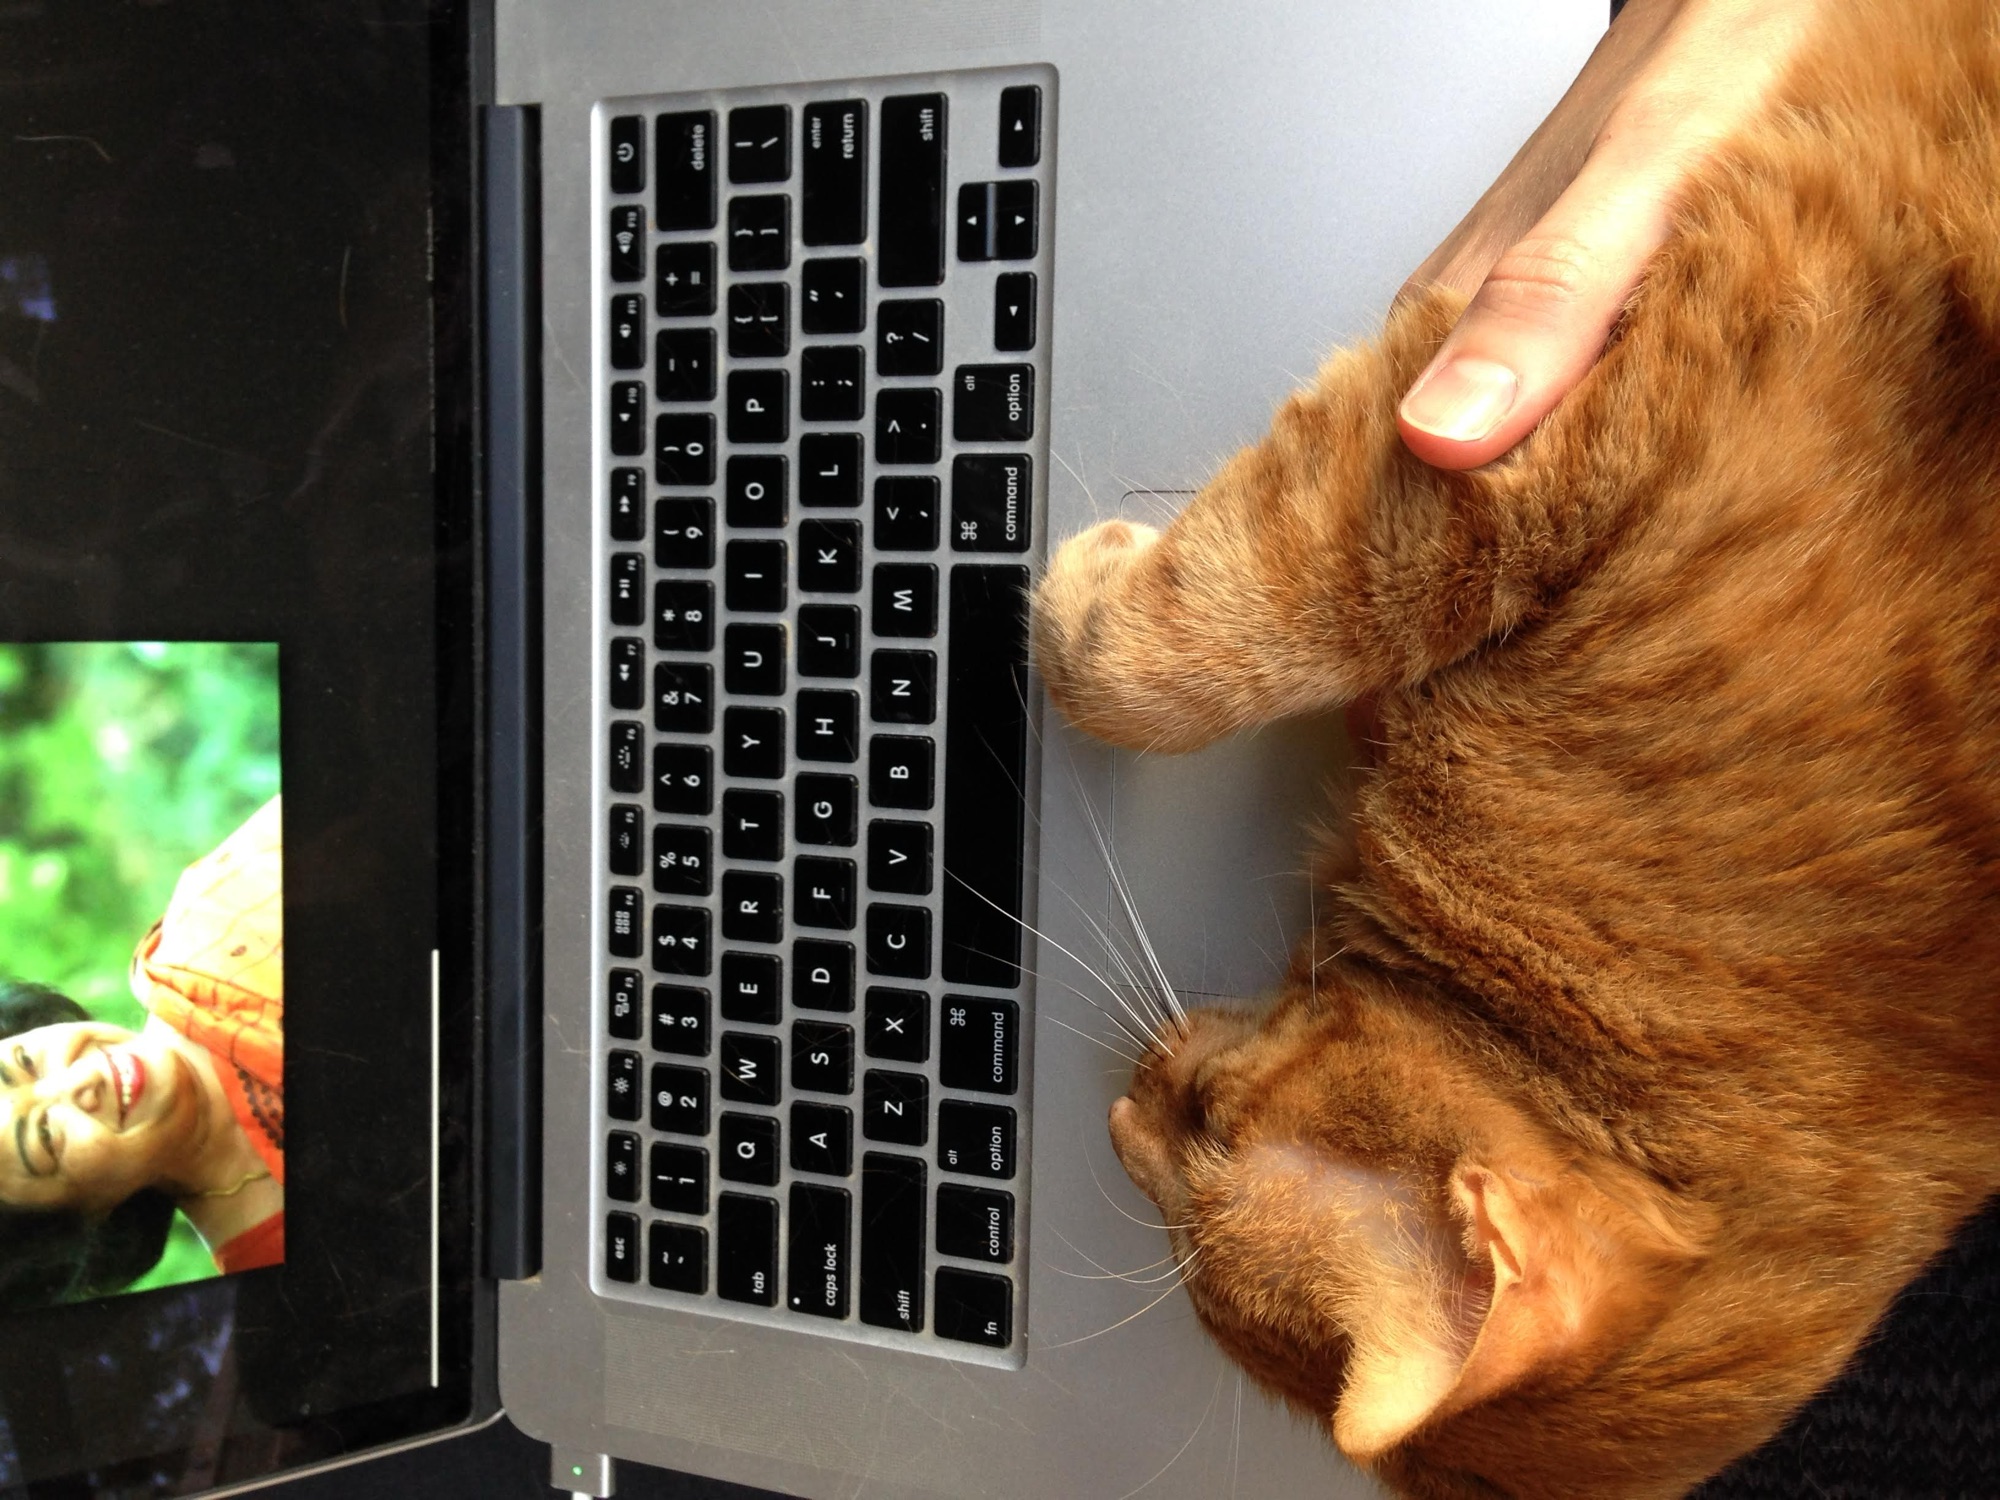
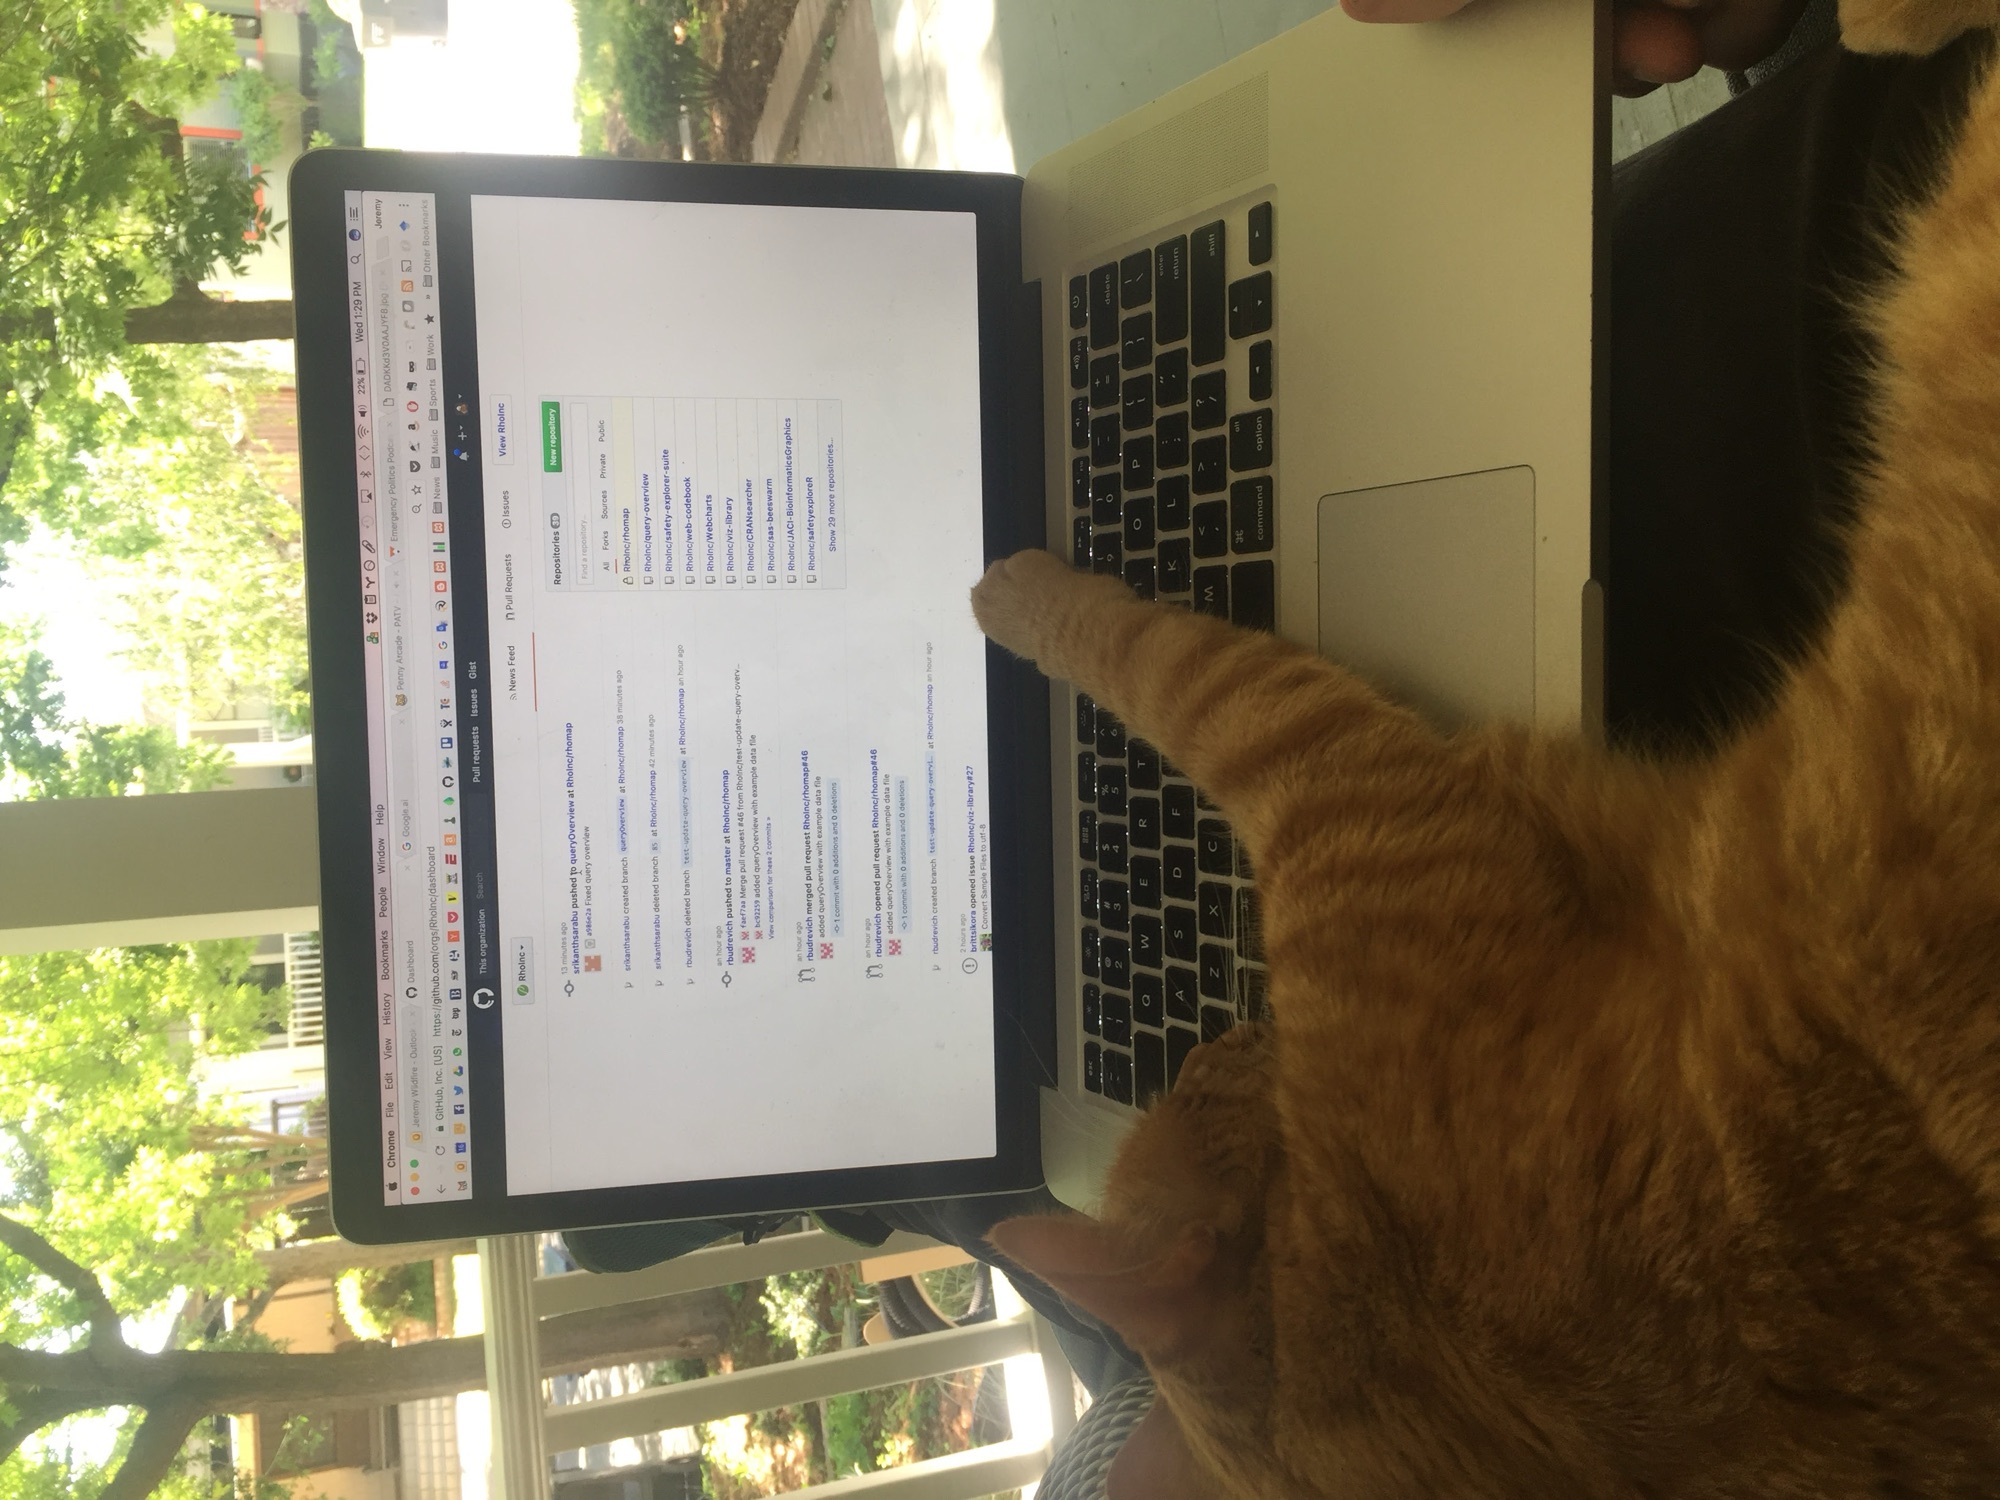
First, a key collaborator. Orange was our Chilean street cat. We found him as a kitten on Avenida Pedro de Valdivia when we lived in Santiago, and he worked with me for a lot of my career, so he was there for everything in this talk. He’ll show up again, in a few different hats.
A quick disclaimer: I work for the Biostat Innovation Group at Gilead, and I’ll talk a little about what we do at work, but this is all just my opinion.
The question
What can we actually do with AI agents right now?
SafetyGraphics 2016–2021
OpenRBQM 2021–2025
Opus 4.5
GPT-5.1
Nov 2025
Experiments on the AI Frontier summer 2026
AI in the Clinical Trial Pipeline Q4 2025
spare time
day job
What we learned now
What can we actually do with AI agents right now? [press] SafetyGraphics, OpenRBQM: 2016 to 2025 [press] The fork: Opus 4.5 and GPT-5.1, Nov 2025; day job to the pipeline, spare time to the frontier [press] Then what we learned [press] The hexes fly to the strip
As these AI tools have come into all of our lives, the question I wrestle with most is: what can we actually do with AI agents right now? That’s what I’m trying to answer today.
Here’s the map. We’ve already met Orange. Next come SafetyGraphics and OpenRBQM, two big projects I’ve worked on for the last decade or so. Then, around November 2025, when Opus 4.5 and GPT-5.1 came out, the road forks: how we use AI in the clinical trial pipeline on my team (the day job), and my experiments at the AI frontier this summer (spare time). The two lanes meet again at what we learned, and what comes next.
How I tried to answer it
By working in public
Every post, and the linksjwildfire.github.io/keynote
I answered it in public Every post is at the QR code
When I found out I was giving this talk, back in the spring, I tried to think about how I’d answer that question. Like any good R developer and open-source advocate, I decided to do the work in public. I wrote a series of posts , and everything leading up to this talk is there.
Orange, at work
Open Source SafetyGraphics
Such a helpful coworker
Two projects, then how AI changed everything
2012
Why can't I do this for work?
Interactive graphics in the New York Times
2012: biostatistician, SAS and some R NYT interactive graphics Why can't I do this for work?
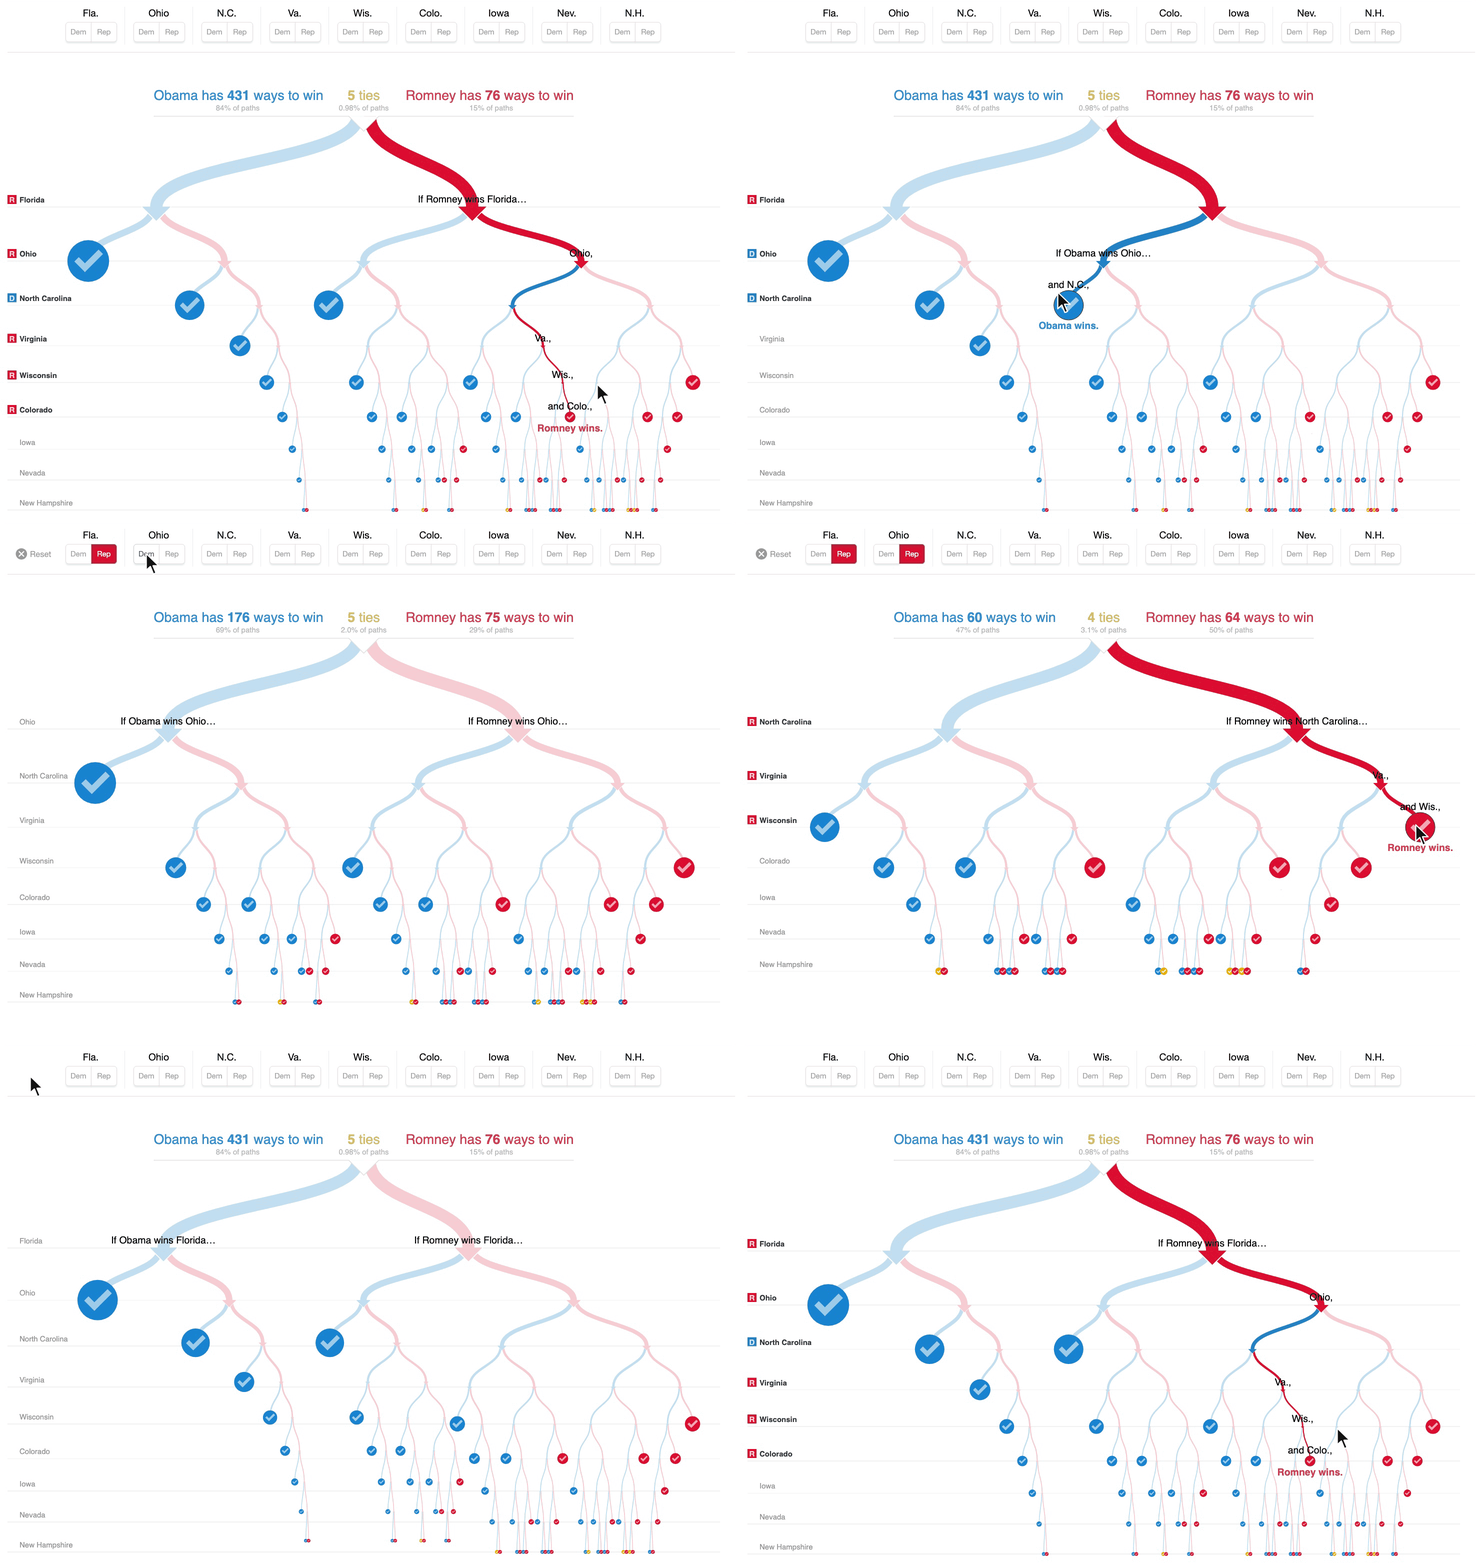
Back in 2012 I was a biostatistician working on NIH-funded asthma and allergy studies. I knew SAS and some R, and I started seeing interactive graphics in places like the New York Times. This one shows Obama’s paths to victory in his re-election, so it was a while ago. Looking at these, I thought: why can’t I do this for work?
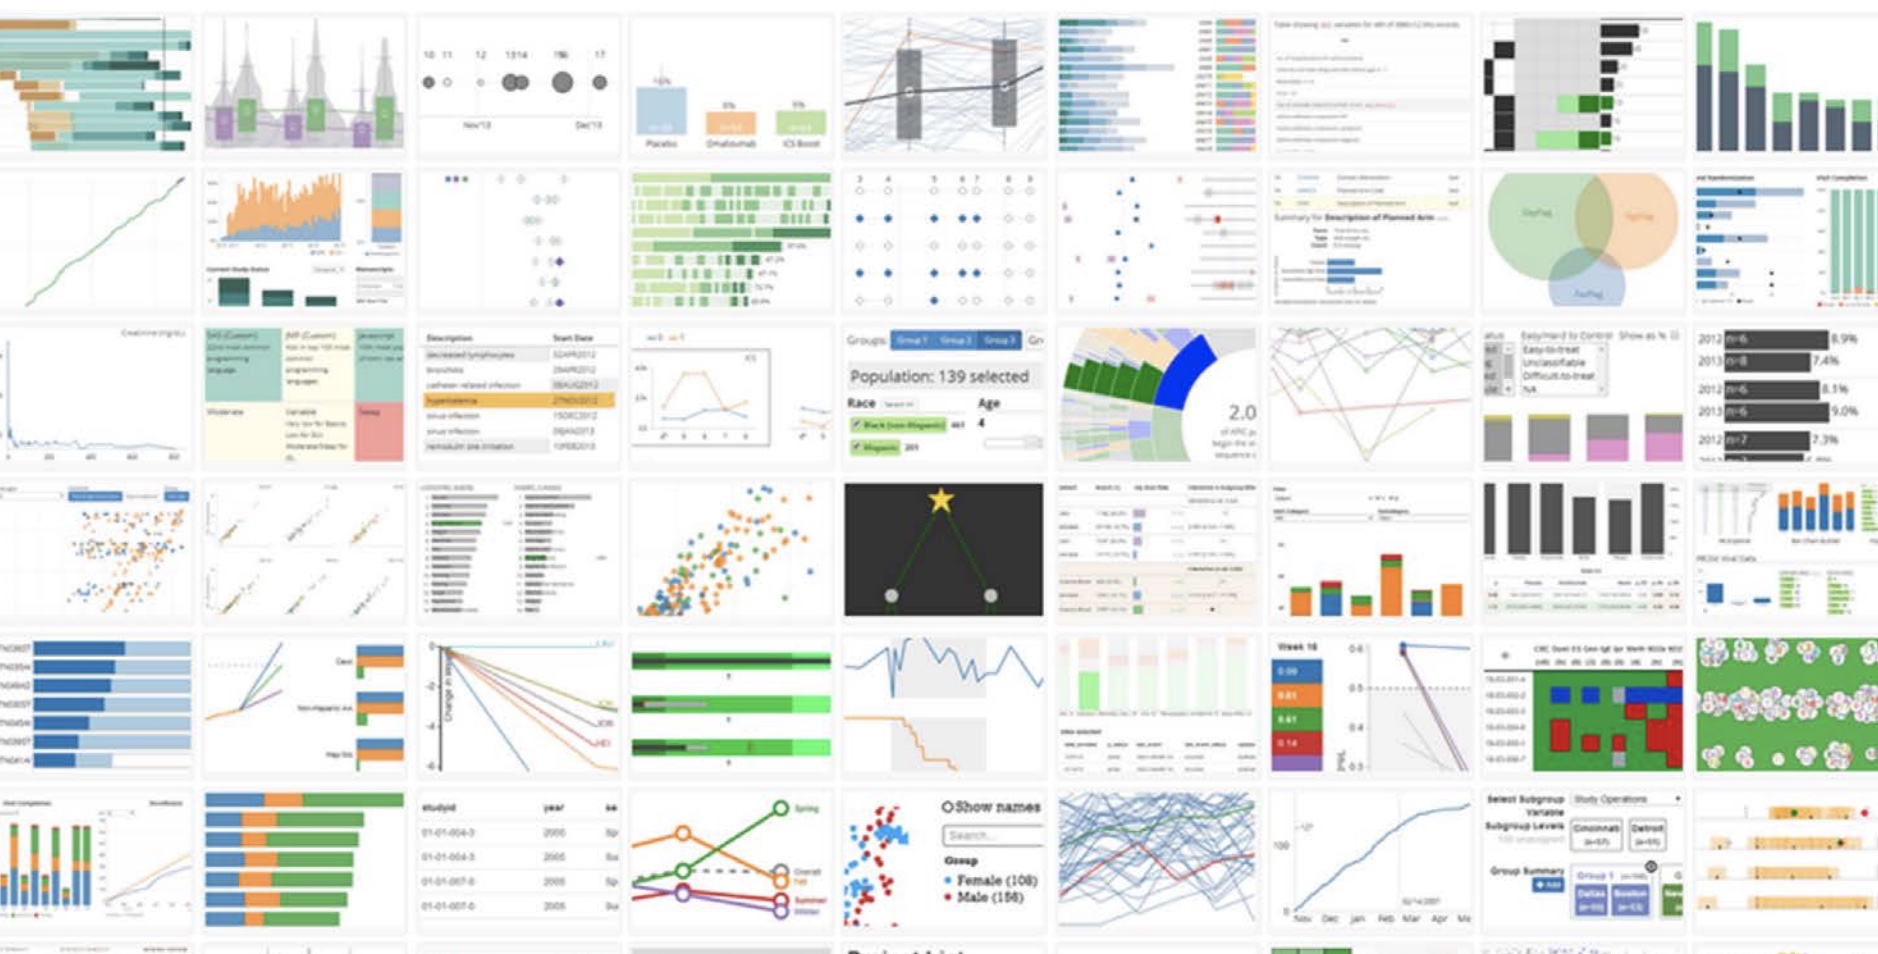
It turns out we can. I taught myself JavaScript (D3 version 2, I think), and we ran a bunch of experiments. We were already making fancy R graphics, mostly in lattice back then, and we started building more and more with JavaScript, and deploying it with R through htmlwidgets and Shiny.
We can! Taught myself JavaScript (D3) R graphics plus interactive JS
Page 1 of 18
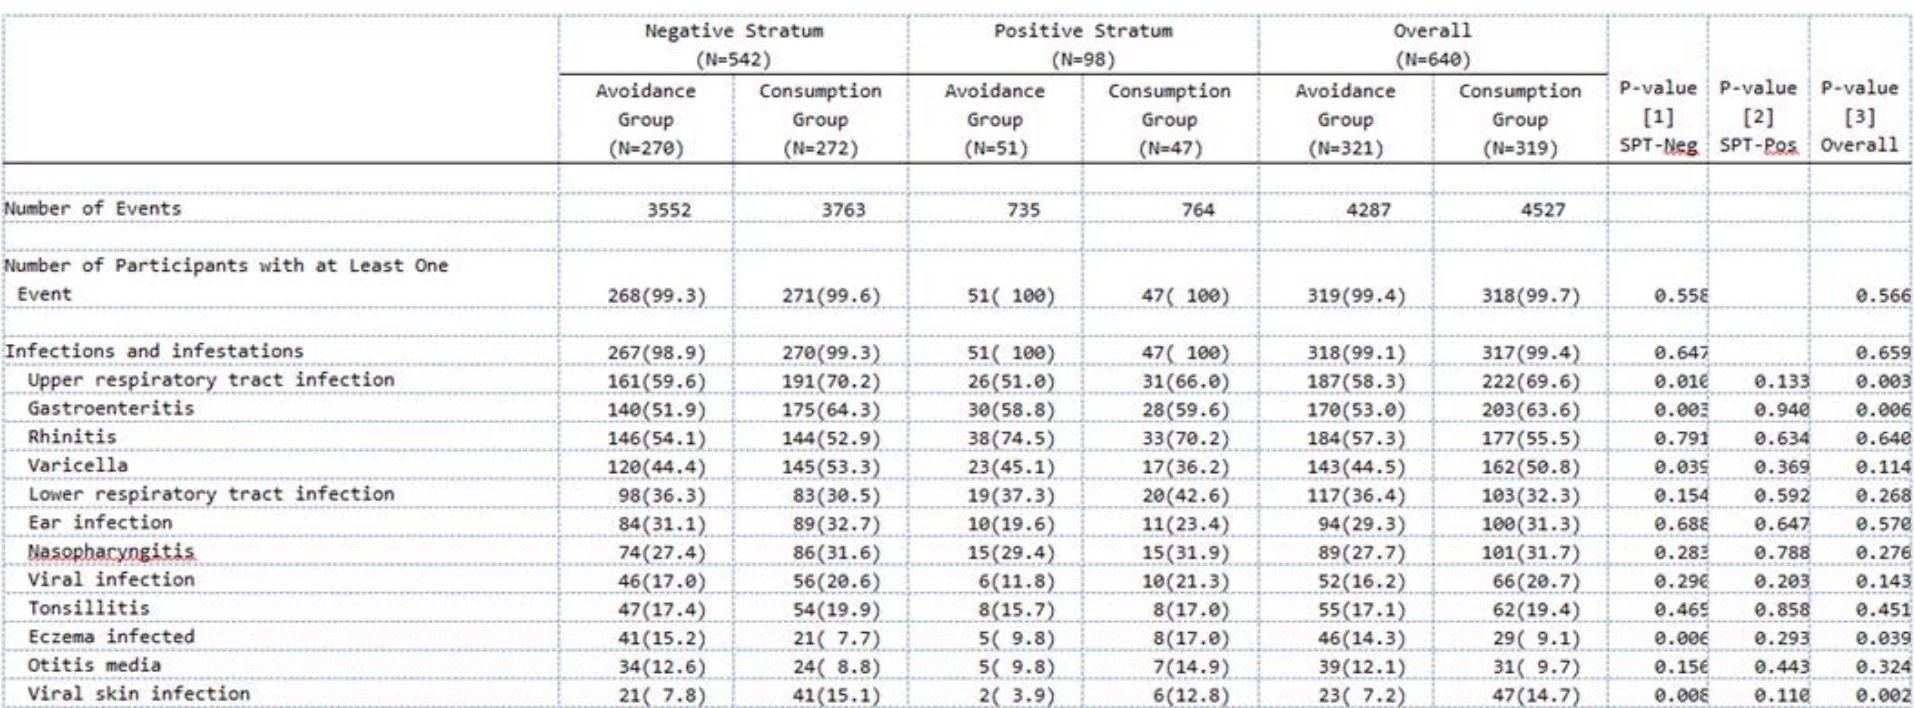
A standard adverse events table
The AE table: 18 pages, unreadable
After some experimenting, we found places in the clinical trial pipeline where this was really useful. As a study statistician it always drove me nuts to make dense, five-point-font, 18-page adverse event tables. They come with every study, and they’re horrific to read.
The Rho Graphics Group
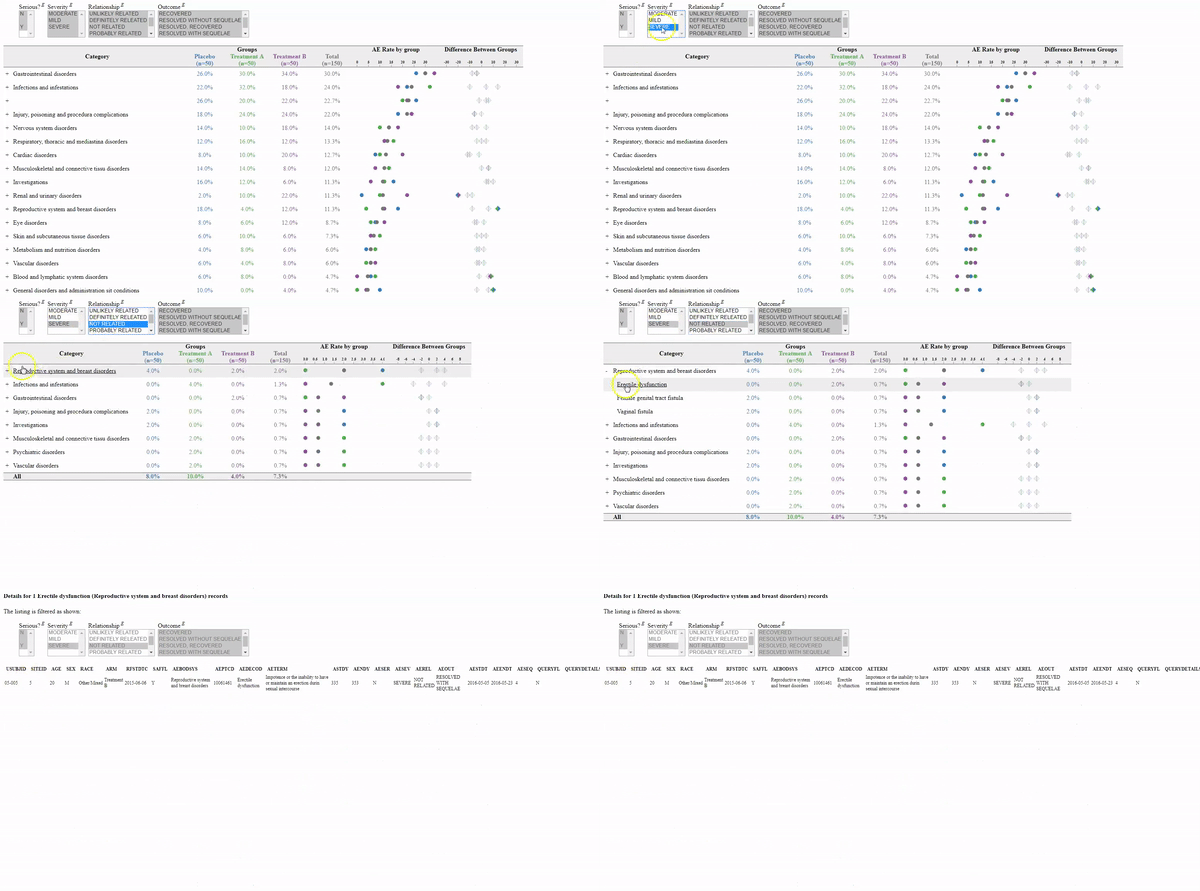
A handful of webpages beats a massive table
The Adverse Event Explorer · open source, in the browser
A handful of webpages beats a massive table
So we turned them into a handful of web pages, which is a much better way to review a study’s data in lots of ways. Everybody liked it more. We liked making them more, and the users liked using them more.
ASA–DIA Safety Working Group
Open Source Safety. Interactive Reports. Shiny Modules.
At R/Pharma in 2020: SafetyGraphics v2.0, the talk
SafetyGraphics: a consortium Name the collaborators
That was the first interactive graphic in the SafetyGraphics project: an R package with a Shiny app full of interactive charts for monitoring safety, built by a consortium of clinical and technical collaborators and co-sponsored by DIA and the ASA Biopharmaceutical Section. There’s more in the 2018 paper , my R/Pharma 2020 talk on SafetyGraphics v2.0 , and diary #3 .
Thanks to everyone who built it with us; they’re all named in diary #3 .
The best thing we built
The hepatic explorer, and a clinical workflow to go with it
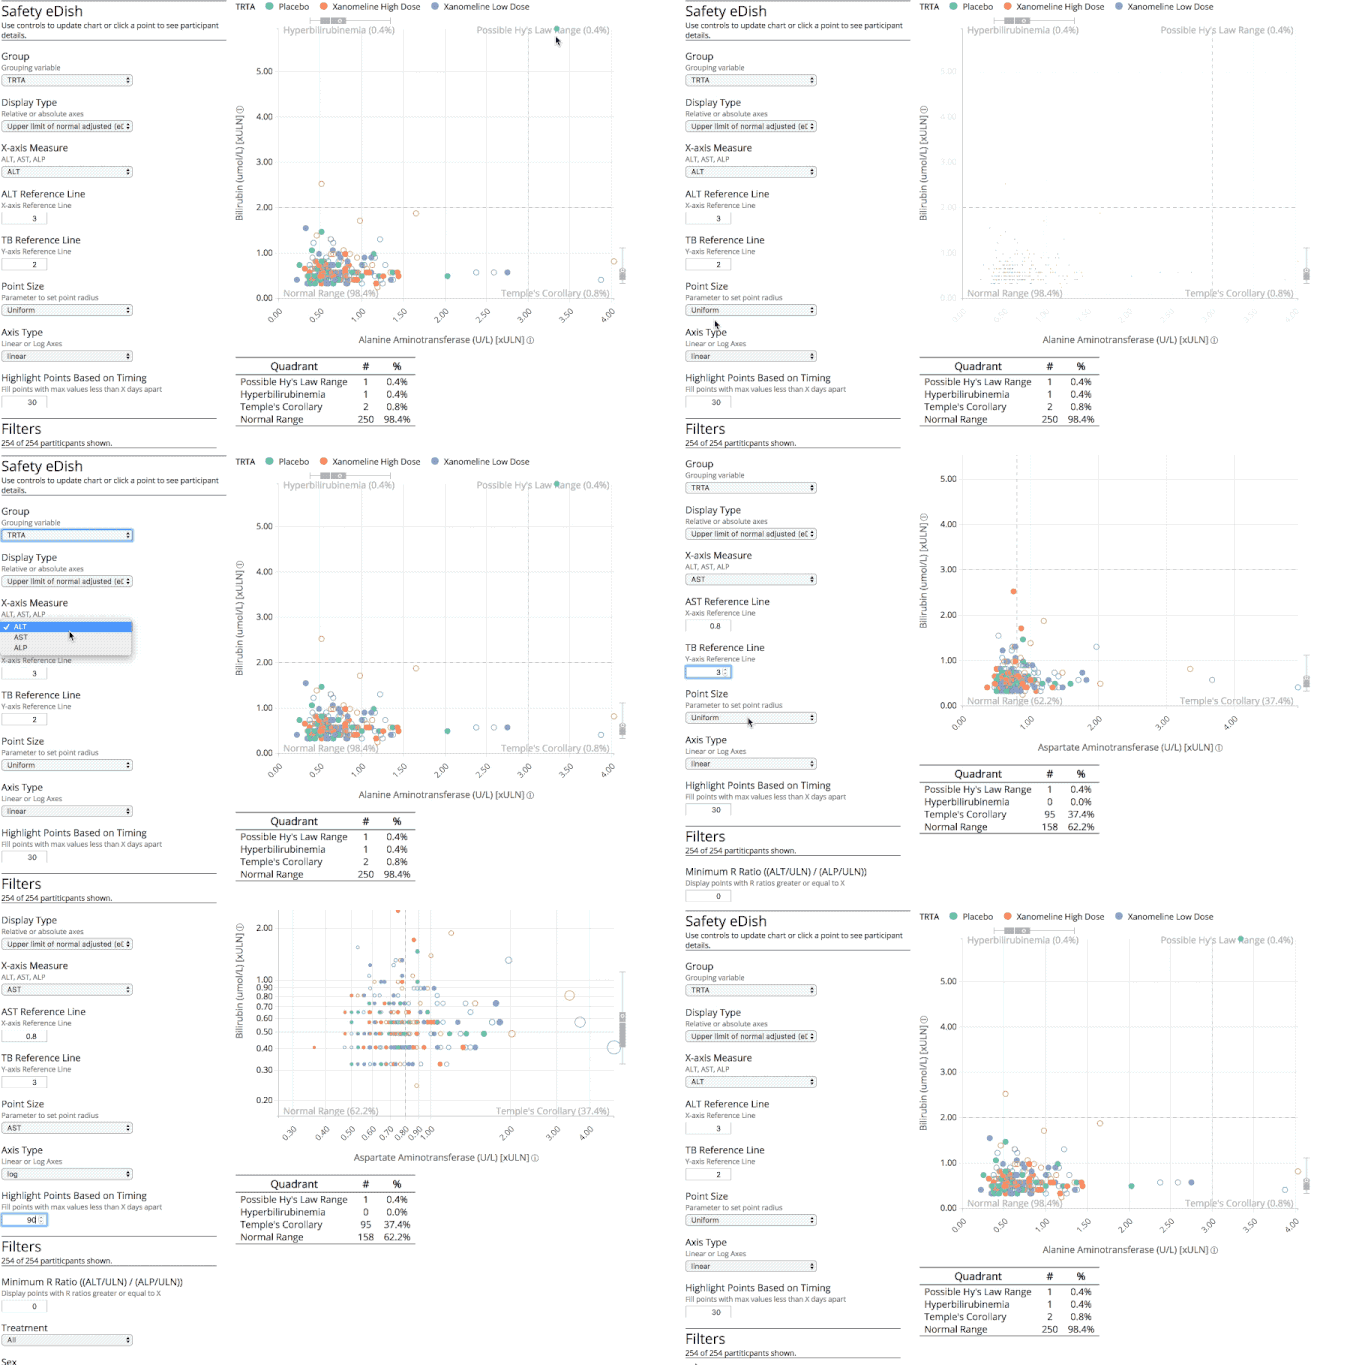
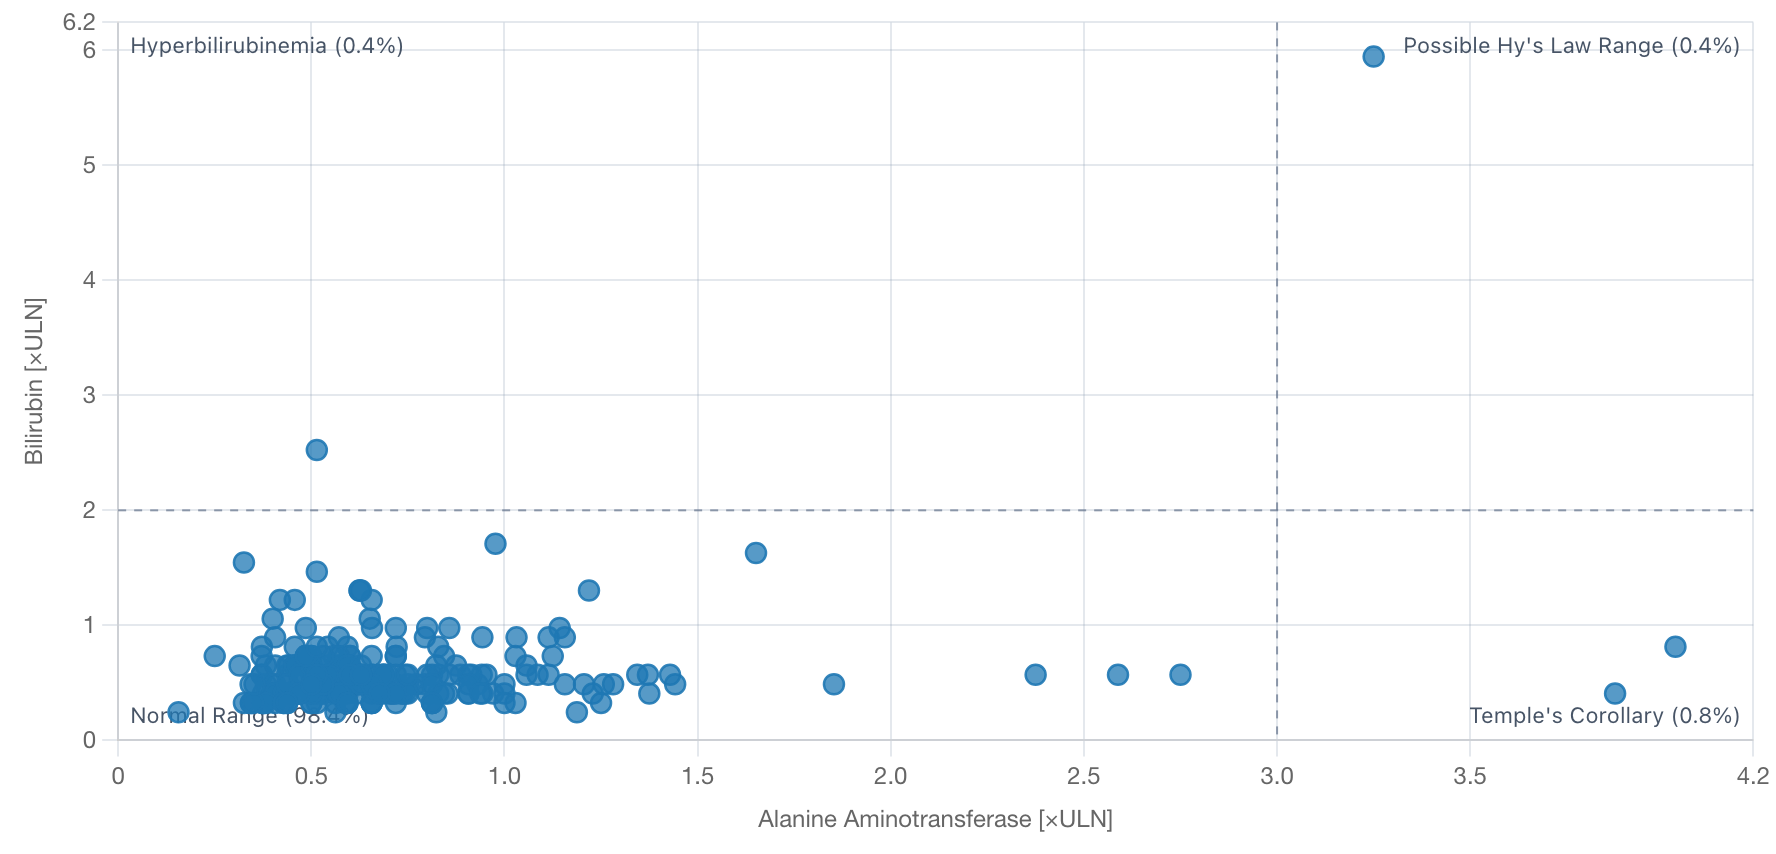
The explorer · eDISH, the standard plot for drug-induced liver injury
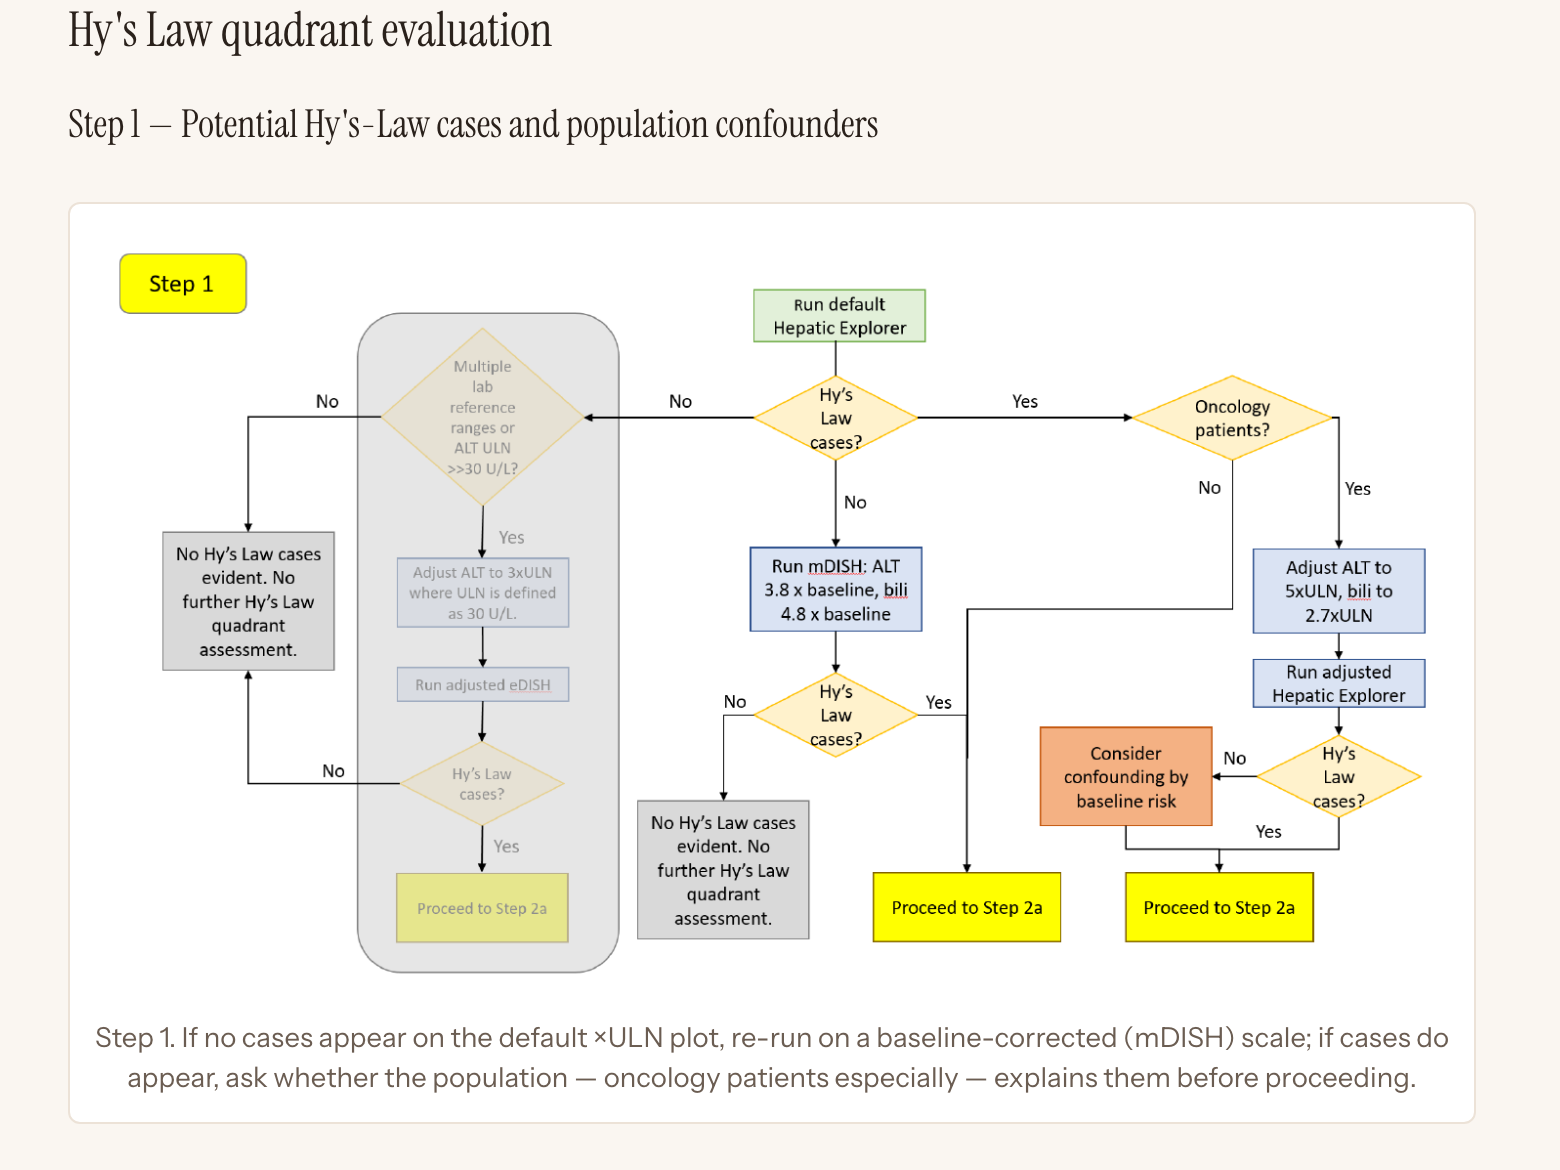
The workflow · step 1 of 9, as it reads in safety.viz today
Best thing we built: the hepatic explorer Half clinicians, half technical Jim Buchanan's clinical workflow
I think the best thing we built was the hepatic explorer, and the clinical workflow that goes with it. The team was about half technical folks like me and half clinicians. Jim Buchanan, our clinical lead, wrote a detailed workflow for analyzing liver toxicity with eDISH, and we built the chart to support it. The workflow tells you how to use the tool, and the tool is updated as the workflow evolves.
Building custom workflows like this, all open source and freely available, and then using them on the trials I was supporting, was eye-opening.
Introducing Inspector Orange
The first question, in every talk
What evidence do you have?
Written requirements and a manual test script for every chart.
JW
Not really. It’s exploratory.
JW
Inspector Orange: what evidence? Requirements, test scripts, automated tests Validated? Not really. Exploratory.
We gave a lot of talks, and the first question at every one was about quality. So here’s Inspector Orange, who’ll pop up throughout the talk.
What evidence did we have? Quite a lot: written requirements, manual test scripts, and automated tests, including Shiny tests, run on every pull request. But was it validated? Not really. It was exploratory.
Orange, reviewing
OpenRBQM
Open-source Risk Based Quality Management.
2021: Gilead and RBQM OpenRBQM, a PHUSE working group
OpenRBQM PHUSE Working Group
Open Source Monitoring. Interactive Reports. Flexible Data Pipelines.
Safety work = submissions RBQM = study conduct and monitoring
In 2021 I joined Gilead and moved from safety monitoring to a team focused on RBQM, risk-based quality management. We built more open-source software, which we’re still building and maintaining today, under OpenRBQM , a PHUSE working group .
The safety work had a monitoring component, but it was largely about submissions, which is why the validation question kept coming up. RBQM is about study conduct and monitoring. We took a lot of the framework from SafetyGraphics and put a more robust process around it.
How the software gets made
A standard development lifecycle
Design
Gather requirements
Write the work item
Draft the technical plan
Build
Write the tests
Review the tests
Implement
Draft the change summary
Check code quality
Approve
Publish
Automated gates
Quality documentation
Draft the documentation updates
Finalize and release
Publish
Lifecycle: design, build, publish Quarterly releases Until a year ago: all by hand
We also landed on a standard development lifecycle: design, build and publish, with quarterly releases. Until about a year ago, people owned all of this. We had some CI/CD, shown in grey, but we wrote the requirements, filed the issues, programmed the tests and wrote the code, all by hand.
OpenRBQM · openrbqm.github.io
An ecosystem of packages
An ecosystem of packages IMPALA contributions Our own test data factory
OpenRBQM is an ecosystem of packages that adds up to a robust monitoring framework: an engine (gsm.core ), metrics (gsm.kri ), a Shiny app for deep dives, and workr , which I really love: YAML-driven pipelines that are easy to customize for each study. The IMPALA group contributed packages that plug into the framework, and we built our own test data factory, gsm.datasim . We’re using it at Gilead on a lot of studies now.
Continuous Qualification is Embedded in the Lifecycle
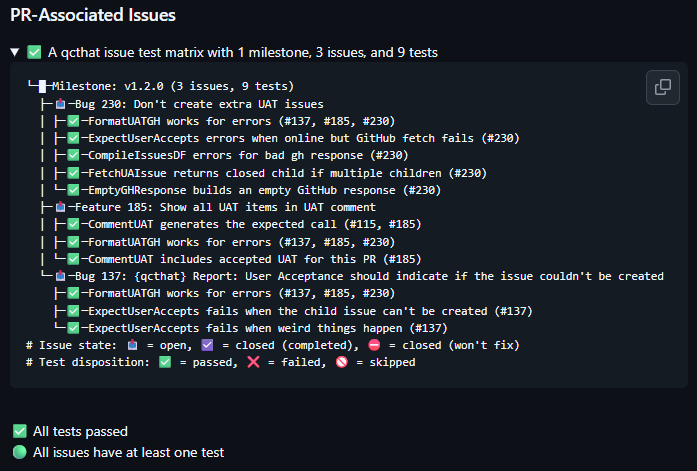
qcthat: a traceability matrix Issue number in the test name Evidence on every PR and release See John and Natalia's talk
We also spent a lot of time on quality, since that question was top of mind after SafetyGraphics. We built a package called qcthat , which Jon Harmon and Natalia Andriychuk from my team talked about at R/Pharma this week; I recommend checking it out.
The core idea is that your testthat tests are linked to GitHub issues. Each test names its issue number, just like you would in a pull request. Your issues become your requirements, your test results become your evidence, and your traceability matrix becomes an artifact that ties into GitHub workflows, for humans or for agents, in a really natural way. It all runs in CI/CD, and the evidence attaches automatically to pull requests and releases.
Quality · qcthat
Quality scales across full package ecosystem
76
qualified releases across 9 packages
Every release, its qualification, and the date of each, in one registry
Package Version Released Qualified gsm.app v2.5.3 2025-08-20 2025-08-22 gsm.app v2.6.1 2025-09-24 2025-10-01 gsm.core v1.0.0 2025-03-14 2025-04-21 gsm.core v1.1.0 2025-04-11 2025-04-21 gsm.kri v1.0.0 2025-03-14 2025-03-14 gsm.kri v1.1.0 2025-04-14 2025-04-21 gsm.mapping v1.0.0 2025-03-14 2025-03-14 gsm.mapping v1.0.1 2025-04-11 2025-04-21 gsm.reporting v1.0.0 2025-03-14 2025-03-14 gsm.reporting v1.0.1 2025-04-15 2025-04-21
Sample rows from qualified-releases.csv
Now that's evidence.
In use on 20+ trials
It scales across the ecosystem Review the evidence, sign off: qualified Now that's evidence
And this scales really quickly. Once you’re in the habit of putting issue numbers in your tests, every release ships with robust evidence, publicly, with the packages. You’ll still have to do the work at your own company, but for us, we review that evidence and sign off, and soon after each release we have what we consider a qualified tool.
Orange, in the pipeline
AI in the Clinical Trial Pipeline
Carefully adding agents to our package development process.
Q4 2025: coding agents crossed a threshold
That brings us to about a year ago, when the AI models got really good. We’d been watching them and using code assistants since ChatGPT took off, but last November we crossed a threshold: coding agents could write code well enough that you weren’t going back to correct them all the time. That’s when they earned my trust.
AI in the pipeline
What can we actually do with AI agentsat work
We use AI heavily, but it's not autonomous. Humans own the process and all deliverables.
— developer diary #1, 10 June 2026
What are agents good at now?
Writing code!
as of Q4 2025
👍
January: experiment · Q2: adopt · Q3: build out Heavy AI, not autonomous A responsible human for every task How much can you safely hand over?
In January I told my team it was time to start experimenting. By Q2, after three months of experiments, we’d adopted coding agents in our day-to-day work and started setting our workflows and best practices. In Q3 we’ve been building that out.
We use AI heavily, but we’re not using autonomous agents. Humans own the process and every deliverable; there’s a directly responsible person for every task an agent does. I wrote more about this in diary #1 . The question we’re wrestling with now is: how much can you safely hand over to agents?
Levels of AI usage
How much do you hand over?
5
The dark software factory Nobody reads the code at all 4
The engineering team You write the specs and plans; agents do the work 3
The developer It writes most of the code; you review all of it ← the day job 2
The junior developer You pair with it and still read every line ← the day job 1
The coding intern It writes the boilerplate; you check everything 0
Spicy autocomplete It finishes your line
Levels: Dan Shapiro, The Five Levels · via Simon Willison's write-up · January 2026
The ladder: autocomplete to dark factory Just the ends, not every rung We sit at 2 to 3
I think this is the core question in our industry, and really in every part of software development right now. This is a hierarchy I really like, Dan Shapiro’s five levels (I found it through Simon Willison’s write-up ).
It starts with spicy autocomplete: you write the code and hit tab to finish a line. It goes up through the intern and the junior developer, where you still read every line; the developer, where you trust it but review all the code; the engineering team, where you write the specs and plans and don’t read much code; and the dark software factory, where nobody reads the code at all. I don’t recommend that for the kind of work we do, but it is happening out in the world.
We’ve landed between the junior developer and the developer, depending on the task: closer to 2 for the code itself, closer to 3 for design and filing issues.
Levels of AI usage
5 The dark software factory 4 The engineering team 3 The developer 2 The junior developer 1 The coding intern 0 Spicy autocomplete
What AI in the pipeline looks like
Same lifecycle; Directly Responsible Humans
Design
Gather requirements
Write the work item
Draft the technical plan
Review the plan, then prompt
Build
Write the tests
Review the tests
Write code
Draft the change summary
Check code quality
Approve
Publish
Automated gates
Quality documentation
Draft the documentation updates
Finalize and release
Publish
What are agents good at now?
The standard SDLC
as of Q2 2026
👍
What evidence do you have?
The same tests,
Same SOPs, same roles Humans own every line, test and issue Q2: good coders became good developers
This is how our lifecycle looks now. The coloured steps have been handed to agents, in part or in whole. We have the same SOPs and the same roles and responsibilities. Agents are another tool, and we are responsible for all the code. For our qualified frameworks, a human has read every line of code, every qcthat test and every issue, and owns how it all fits together.
As of Q2 or so, agents went from good coders to good developers: gathering requirements, filing issues, version control, drafting PRs, reviewing code. The evidence is the same as before (more tests, in fact, reviewed by humans and agents), and a named person still owns it. We’re just not sitting at the keyboard typing for loops anymore.
Where we put the effort
Faster code; planning and operations have to catch up
Upstreamour scaffold
Planning
Requirements
Designs
Phase gates
The standard development lifecyclevendor coding agents, plus our shared context and conventions
Design
Work item
Technical plan
Publish
Quality gates
Documentation
Release
Downstreamour scaffold
Operations
Study set-up
Snapshot schedules
Monitoring plan checks
Build roadmap
Make R packages
Run packages on studies
Faster code: planning and ops lag behind Planning: artifacts; bad at priorities Ops: a repo per study, a hub for 20–30 studies
As agents got good at the standard lifecycle, the parts upstream and downstream needed more attention. Code got faster, and planning and operations started to lag behind.
Agents help a lot with both. For planning, they’re really good at creating artifacts: an implementation plan, an interactive demo, three designs to choose from, release notes. Our roadmap is massive, with hundreds of issues in the queue we haven’t had time to get to, and agents help us evaluate them and capture requirements. They’re good at drafting, but bad at setting priorities; we still tell them what matters next.
For operations, every study has its own repo, and a hub repo runs the snapshot schedule through GitHub Actions for 20 to 30 studies. We moved from spreadsheets to GitHub, and agents helped us set that up, keep it running and fix it.
Levels of AI usage
5 The dark software factory 4 The engineering team 3 The developer 2 The junior developer 1 The coding intern 0 Spicy autocomplete
Where that leaves us
We're having great success at level 2.5!
Efficiency gains
Same process! — people own every requirement, review and release
But what's next …
Nine months in: efficiency gains Same process, human oversight But what's next?
That’s where we are at work. We’re nine months into adopting these tools, and we’re seeing efficiency gains. We haven’t rewritten our SOPs; we brought AI into the loop with robust human oversight, and I’m happy with where we are.
But what’s next?
Orange, on GitHub
Experiments on the AI Frontier
A summer of public experiments
Further up the ladder What can we actually do right now?
As I’ve worked on making this better in the day job, I’ve been watching videos and listening to podcasts from people much further up that ladder. The AI frontier feels very different from what I do at work. So when I was asked to give this talk, I wanted to find out: what can we actually do with AI agents right now?
Enter Hacker Orange
What can we actually do withfrontier
Only one way to find out.
Oh jeez. I'll check in later.
Hacker Orange: only one way to find out Old open-source work, not studies Inspector sits this one out
Here’s Hacker Orange. There’s only one way to find out: go try it. I decided to play around on some of my old open-source work. We’re intentionally very careful with the work we do on actual studies, but I think the models’ capabilities are way past that now.
Inspector Orange isn’t really involved in this next section. This is me experimenting, to see what I can build. We’ll check in with him at the end.
The goal
Modernize SafetyGraphics, using the OpenRBQM framework
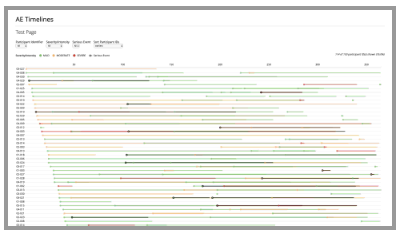
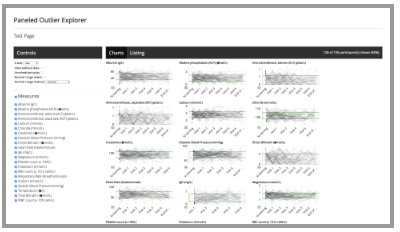
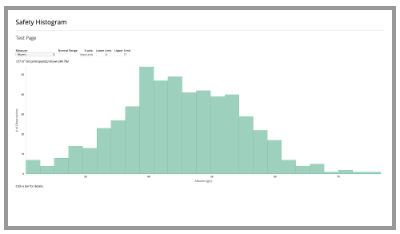
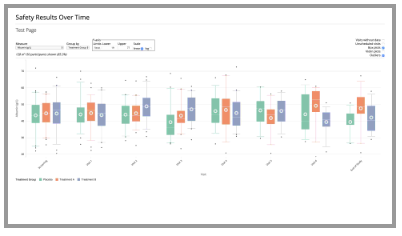
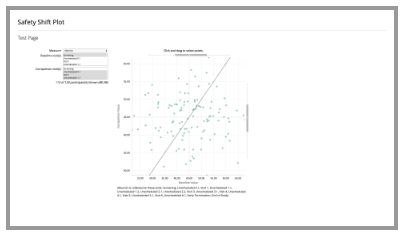
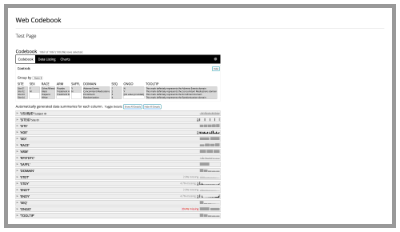
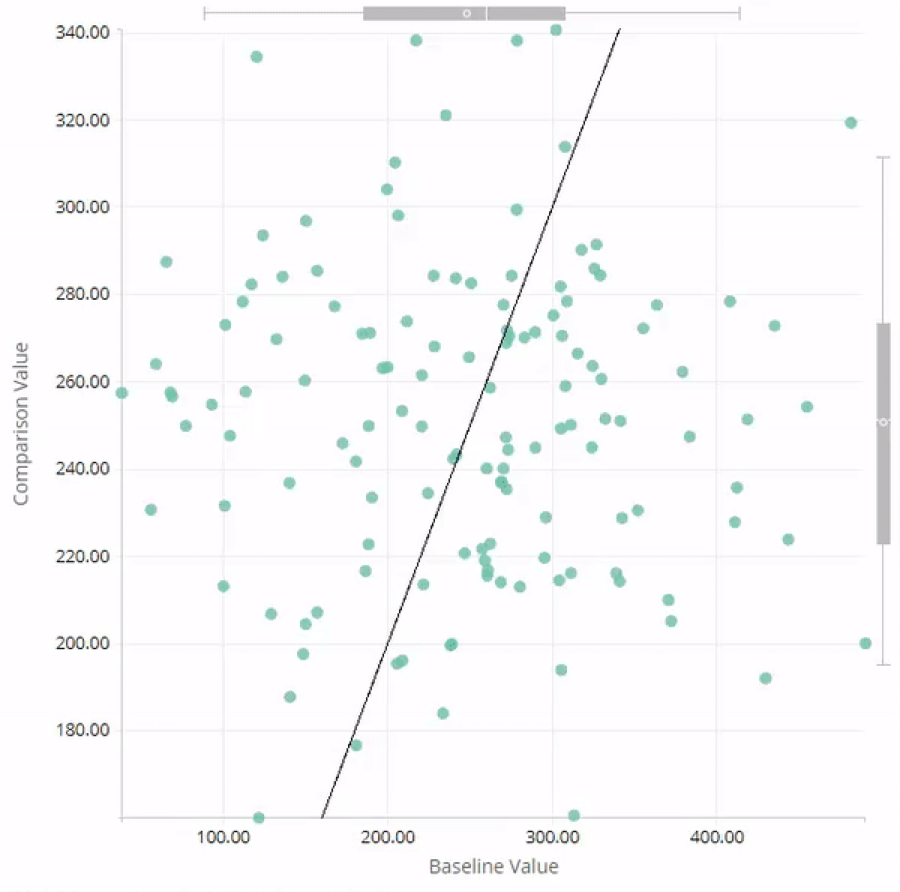
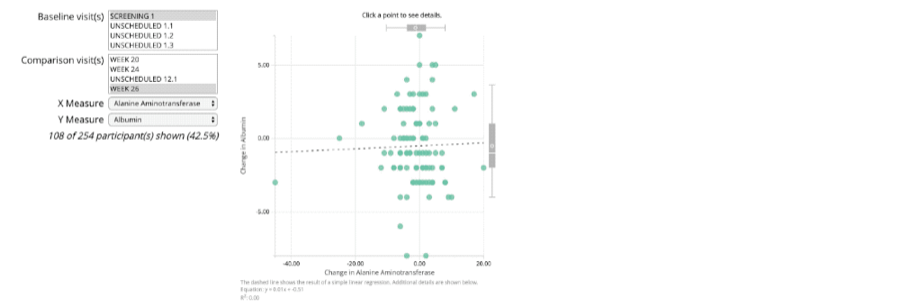
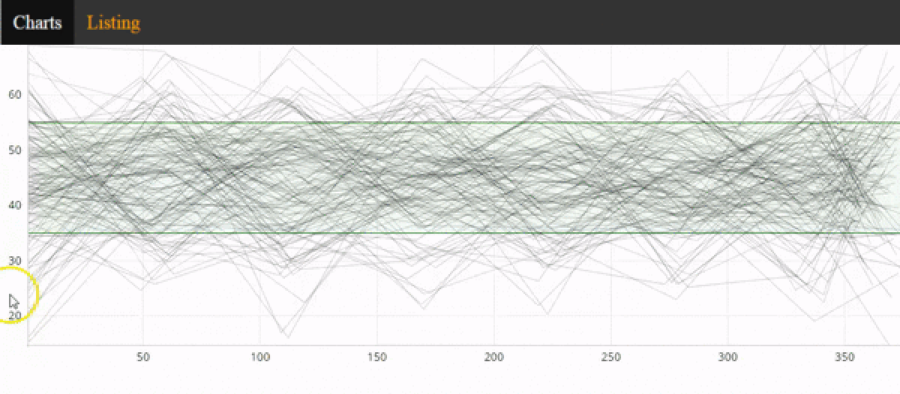
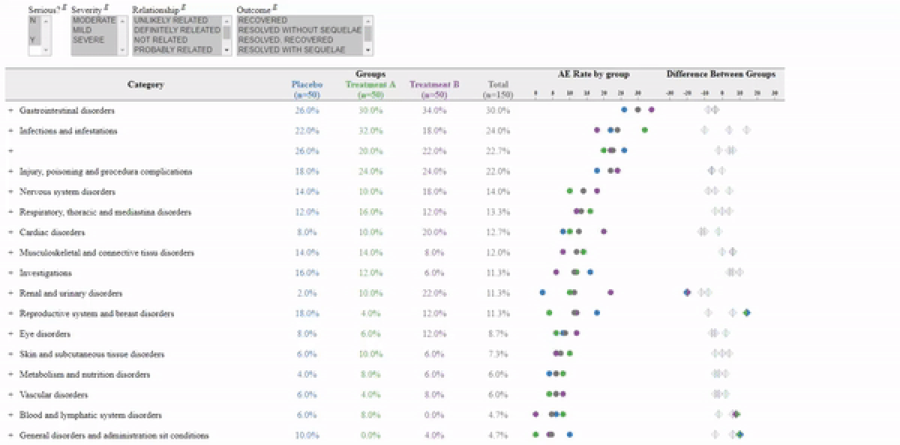
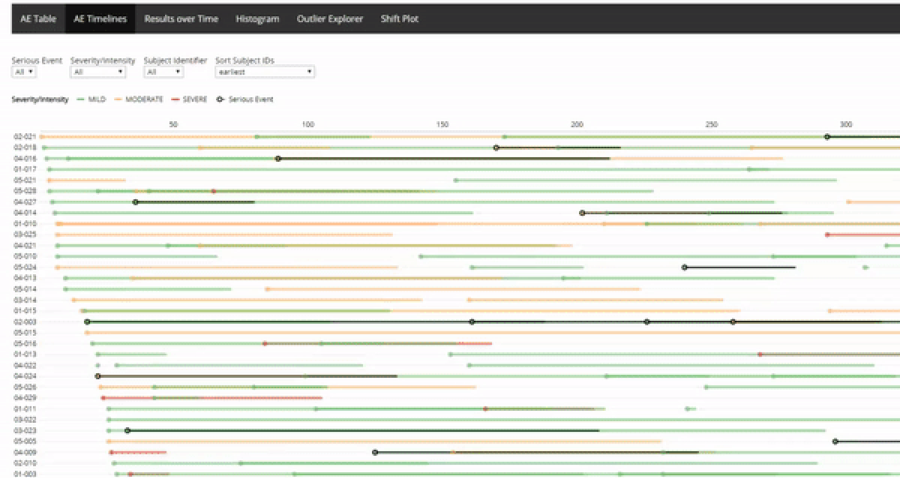
2020 Safety Histogram 2021 Outlier Explorer 2019 Results Over Time 2019 Shift Plot 2019 Delta-Delta 2019 Paneled Outlier Explorer 2020 AE Explorer 2019 AE Timelines 2021 Web Codebook 2022 Hepatic Explorer
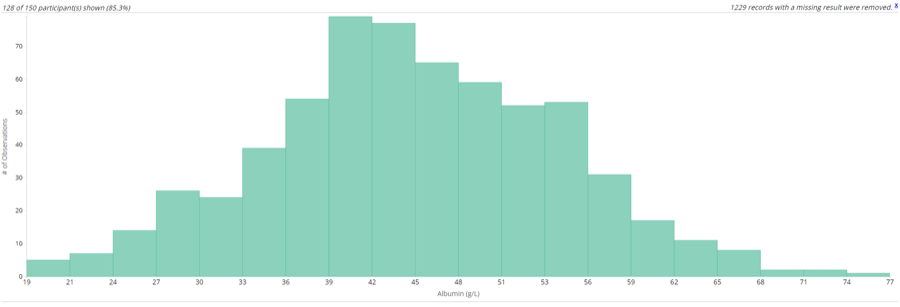
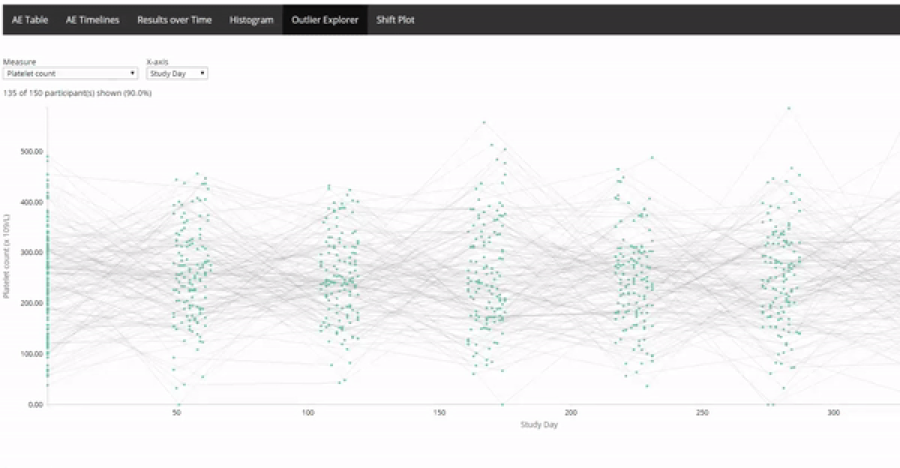
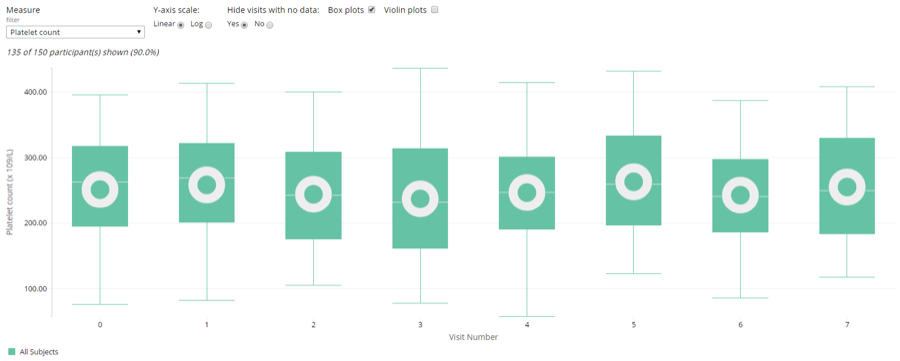
10 original charts · last commit, top right · 25,400 lines of JavaScript · all on D3 v3
Goal: modernize SafetyGraphics on OpenRBQM Ten old D3 charts
I had this robust OpenRBQM framework, with pipelines, qcthat and real evidence. And I had these old safety renderers: ten charts, 25,400 lines of JavaScript, all on D3 version 3, last touched years ago. I’d wanted to modernize them for years, but put it off because I thought it would take a team about a year. Could AI agents help me bring SafetyGraphics into the modern age?
Open source for the win: all of it was publicly available, so I could spend my own time updating it.
Levels of AI usage
5 The dark software factory 4 The engineering team 3 The developer 2 The junior developer 1 The coding intern 0 Spicy autocomplete
obot v1 · early May
A personal assistant
What is it? A personal assistant running locally on my own laptop
Where it started The first commit is signed Orange.
Levels of AI usage
5 The dark software factory 4 The engineering team 3 The developer 2 The junior developer 1 The coding intern 0 Spicy autocomplete
obot v2 · May to June
OpenClaw
What is it? OpenClaw running on a laptop with custom config files and a few Agent.md
What changed It got its own machine, its own account and a job.
ugh. so many config files.
What worked
Real work, by text
👍
A real job: OpenClaw on a wiped laptop Texting it on Telegram: mind-bending A month of config, not building
When I found out about this talk, I gave obot a real job. I wiped an old laptop and installed OpenClaw , an agent that runs around the clock and that you can talk to from anywhere. I’d text it on Telegram, and it would go do the work on GitHub. That part was mind-bending.
The rest was config files. I spent most of a month setting it up instead of building.
obot v2 · what I built
SafetyGraphics, inside an OpenRBQM workflow
meta:
  Type: Report
  ID: safety_histogram
  Name: Safety Histogram Report
  domains:
    labs: Mapped_LB
  widgetName: safetyHistogram
  widgetSettings:
    id_col: subjid
    measure_col: measure
    value_col: value
    group_by: sex
  # … the data spec …
steps:
  # …
  - output: Report
    name: gsm.safety::RenderSafetyChartsWidget
The workflow · gsm.safety v0.1.0
What it rendered · 15 May
Old charts inside OpenRBQM: a first step Couldn't get much done without me Probably faster by hand
It did get one thing working: the old SafetyGraphics charts, running inside our new OpenRBQM framework. A good first step. But it couldn’t get much done without me, and I wasn’t climbing the ladder at all. I was in the weeds getting the thing configured, and I’d probably have been faster by hand.
Levels of AI usage
5 The dark software factory 4 The engineering team 3 The developer 2 The junior developer 1 The coding intern 0 Spicy autocomplete
obot v3 · July
Claude Code, on Fable 5
What is it? Claude Code on Fable 5, with a public roadmap, a set of skills and a bot account
What changed Fable 5 came out, and I moved everything into Claude Code.
July: Fable 5 and Claude Code $200 a month Max plan
Then in July, Fable 5 came out, with all the drama about whether it was available. Enough fiddling with the laptop: I got rid of the OpenClaw config, installed Claude Code, got the $200 a month Max plan, and started prompting to see what it could do.
obot v3 · what I built · 11–12 July
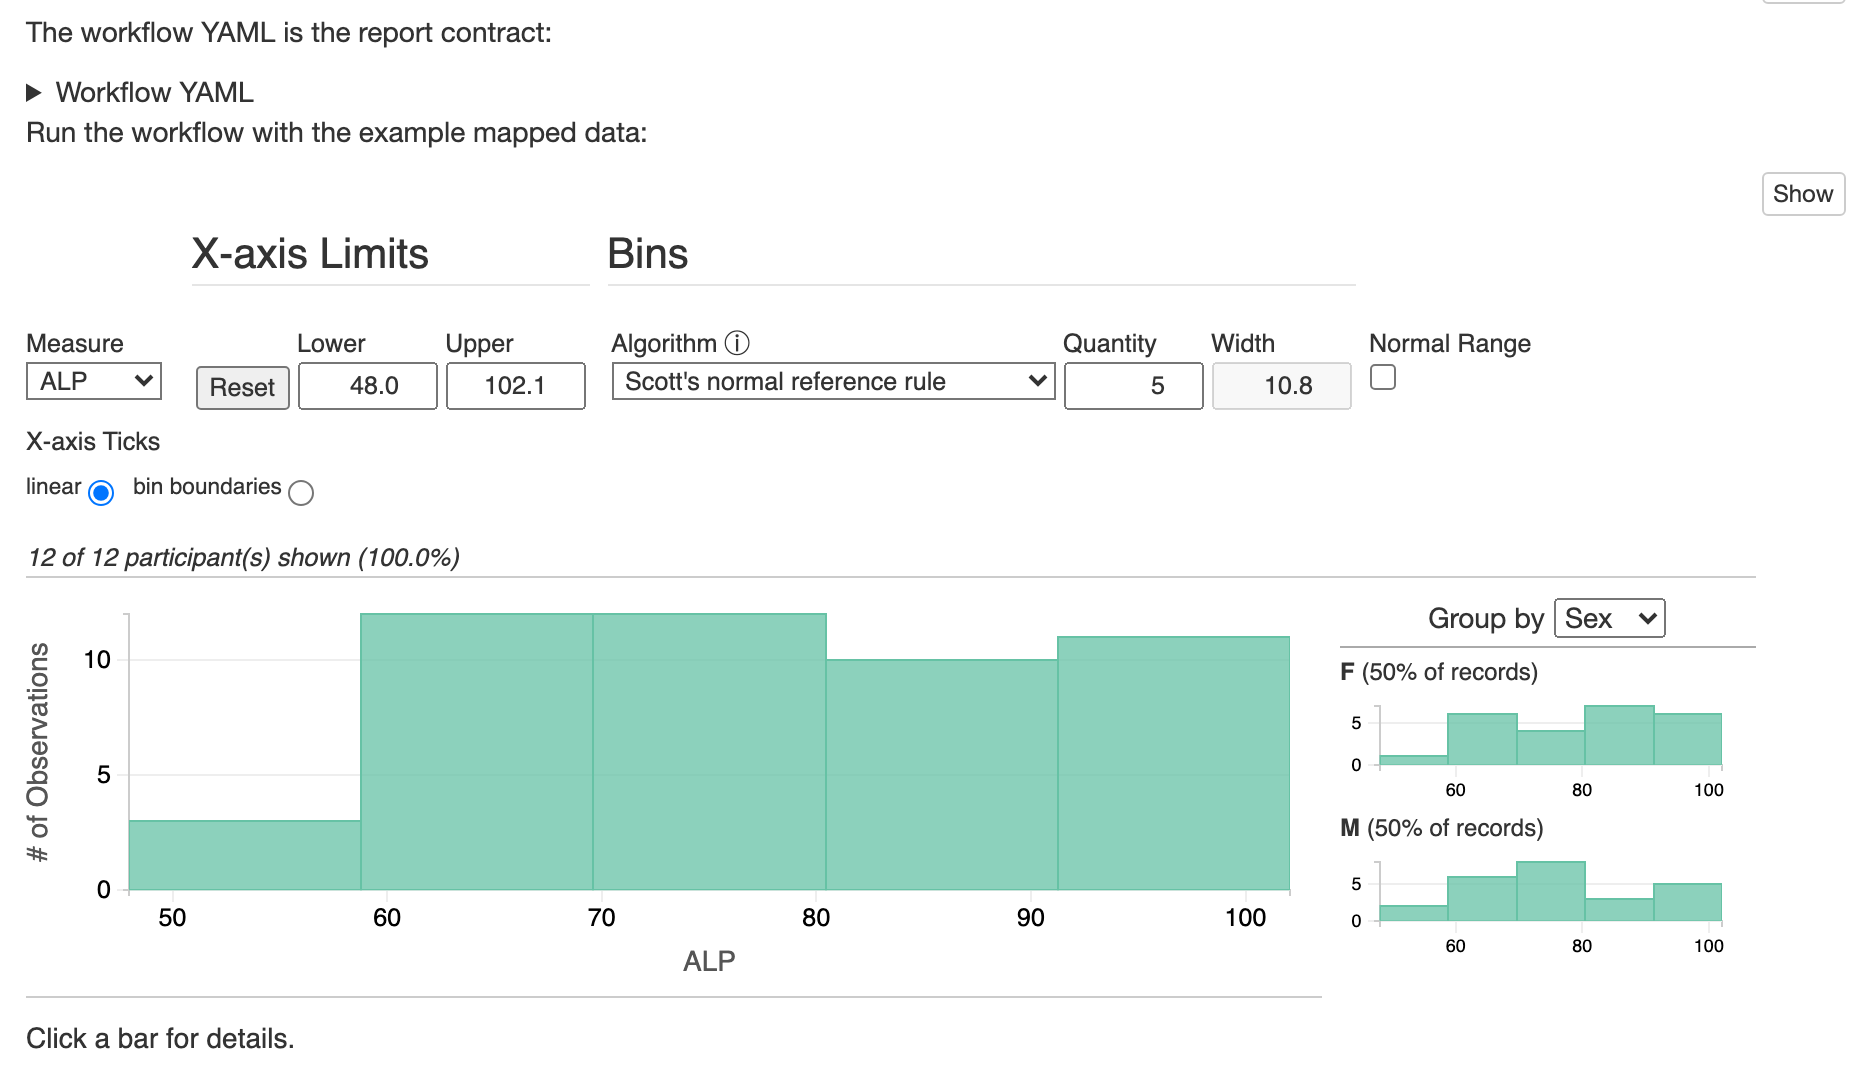
The first renderer took a few weeks; the next six took a weekend.
1.0 billion tokens · $1,273 at API prices · $200 a month actually paid · about 10 hours of me
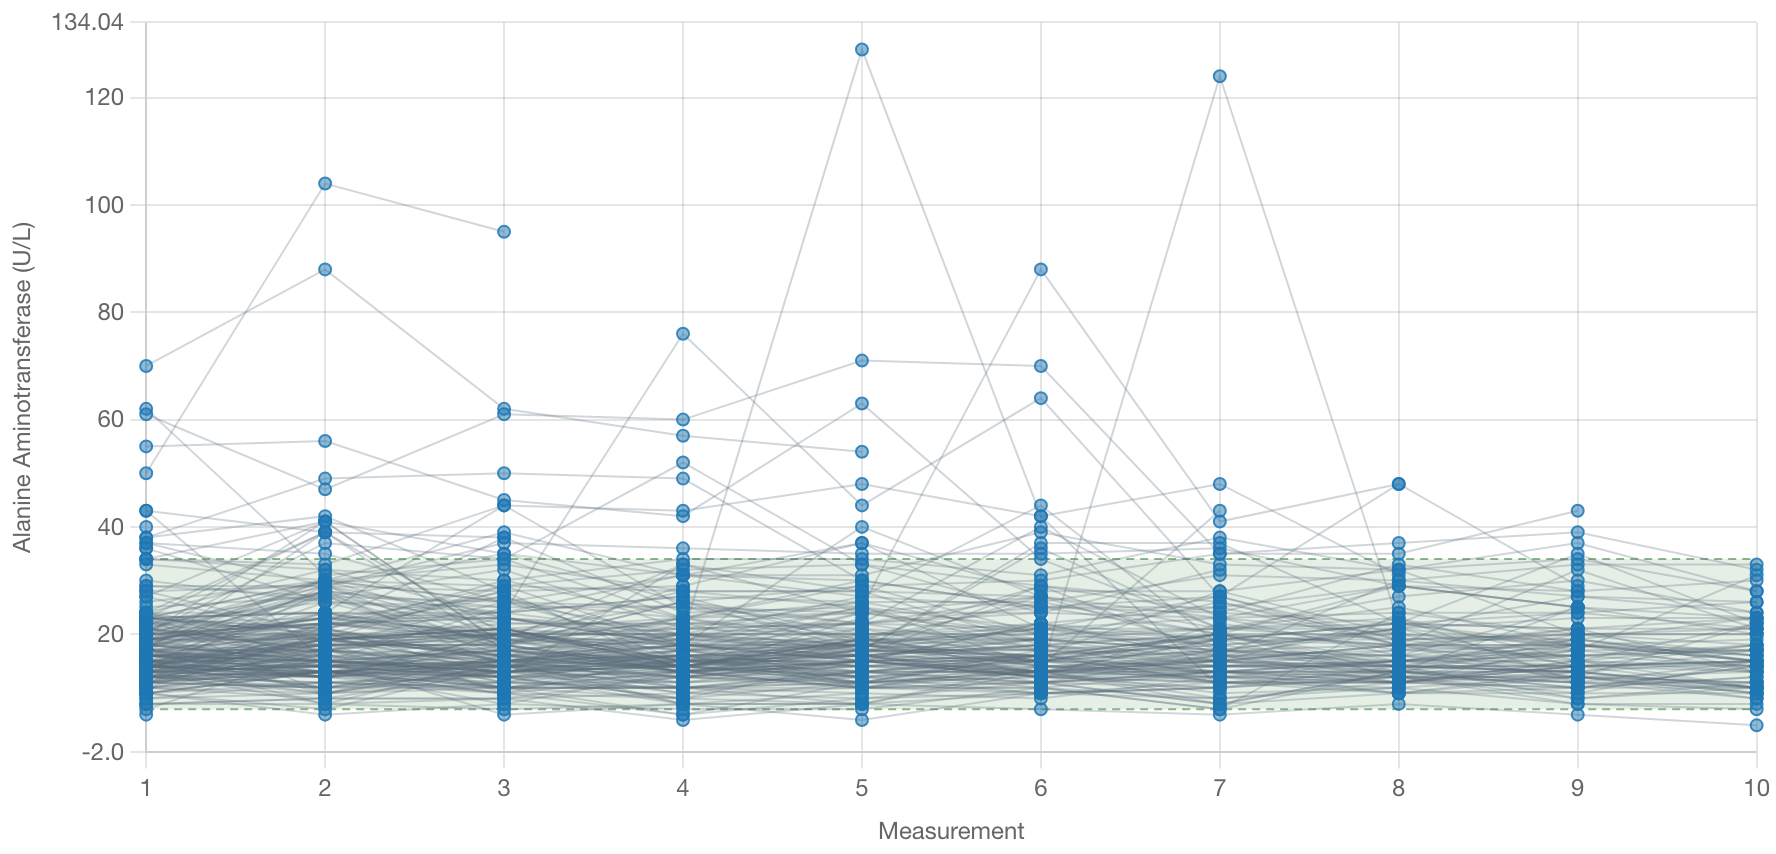
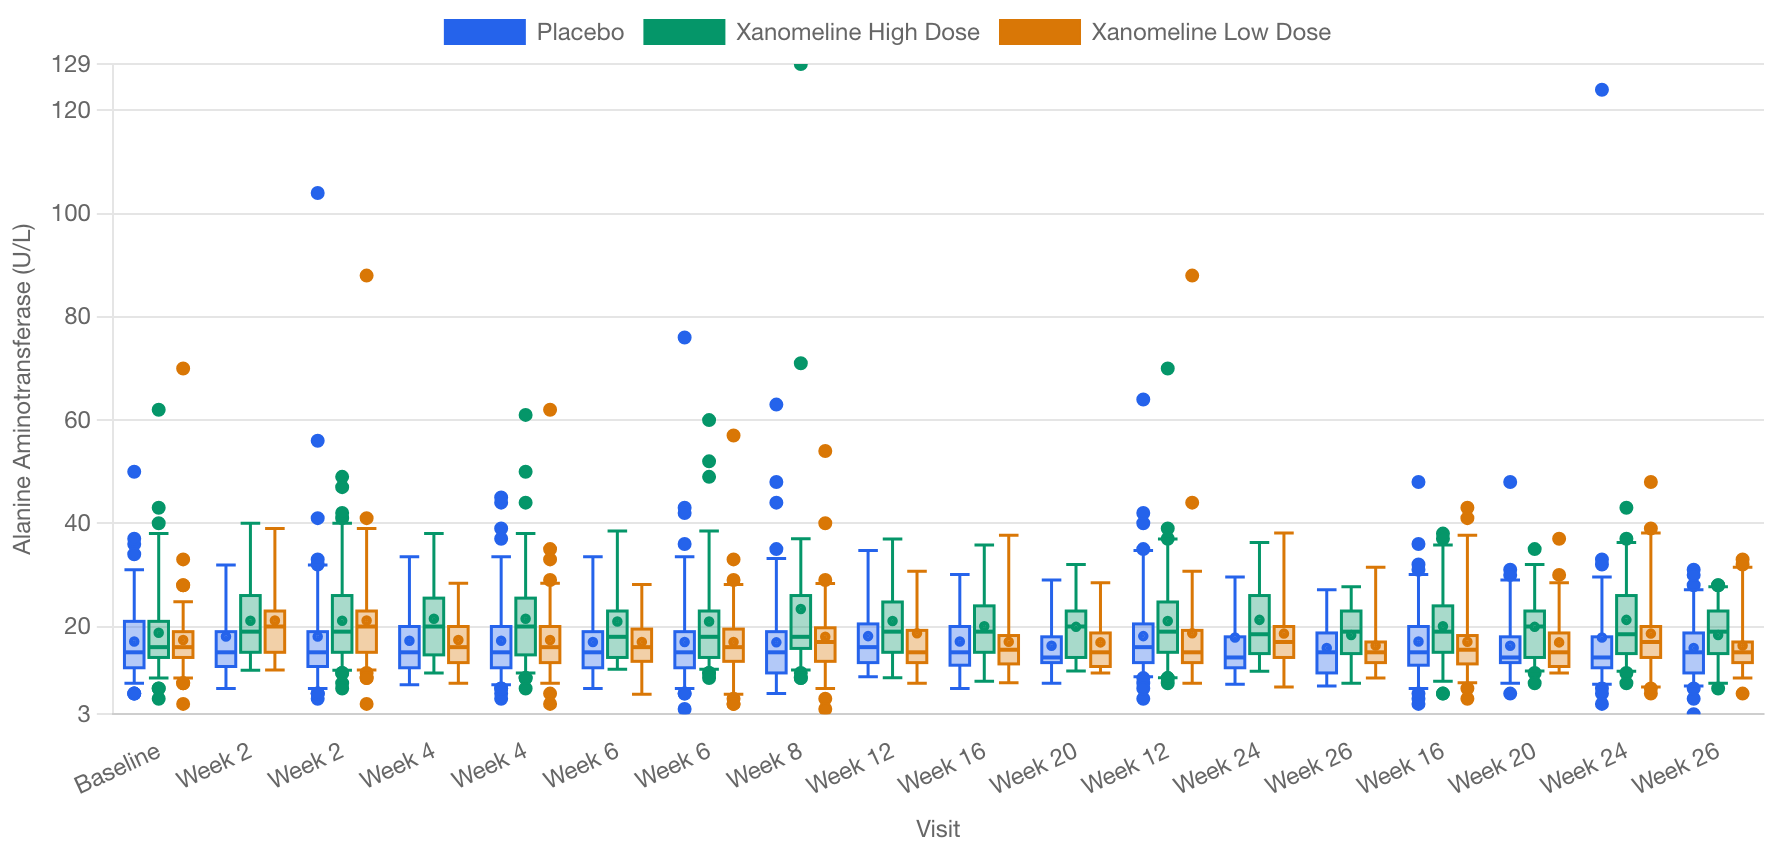
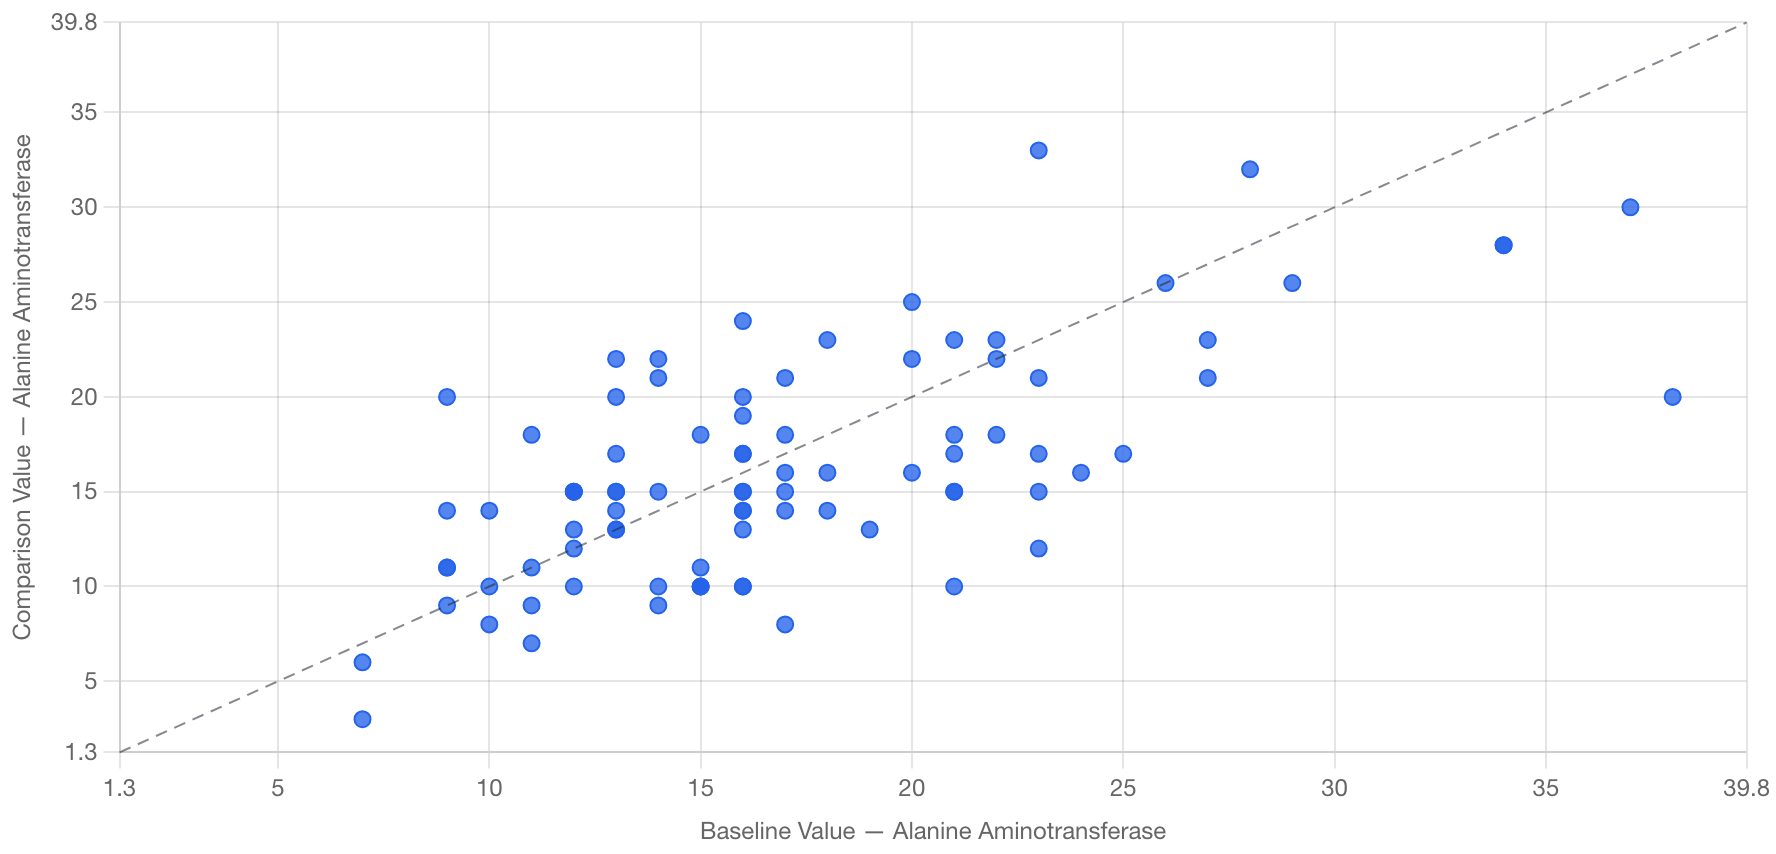
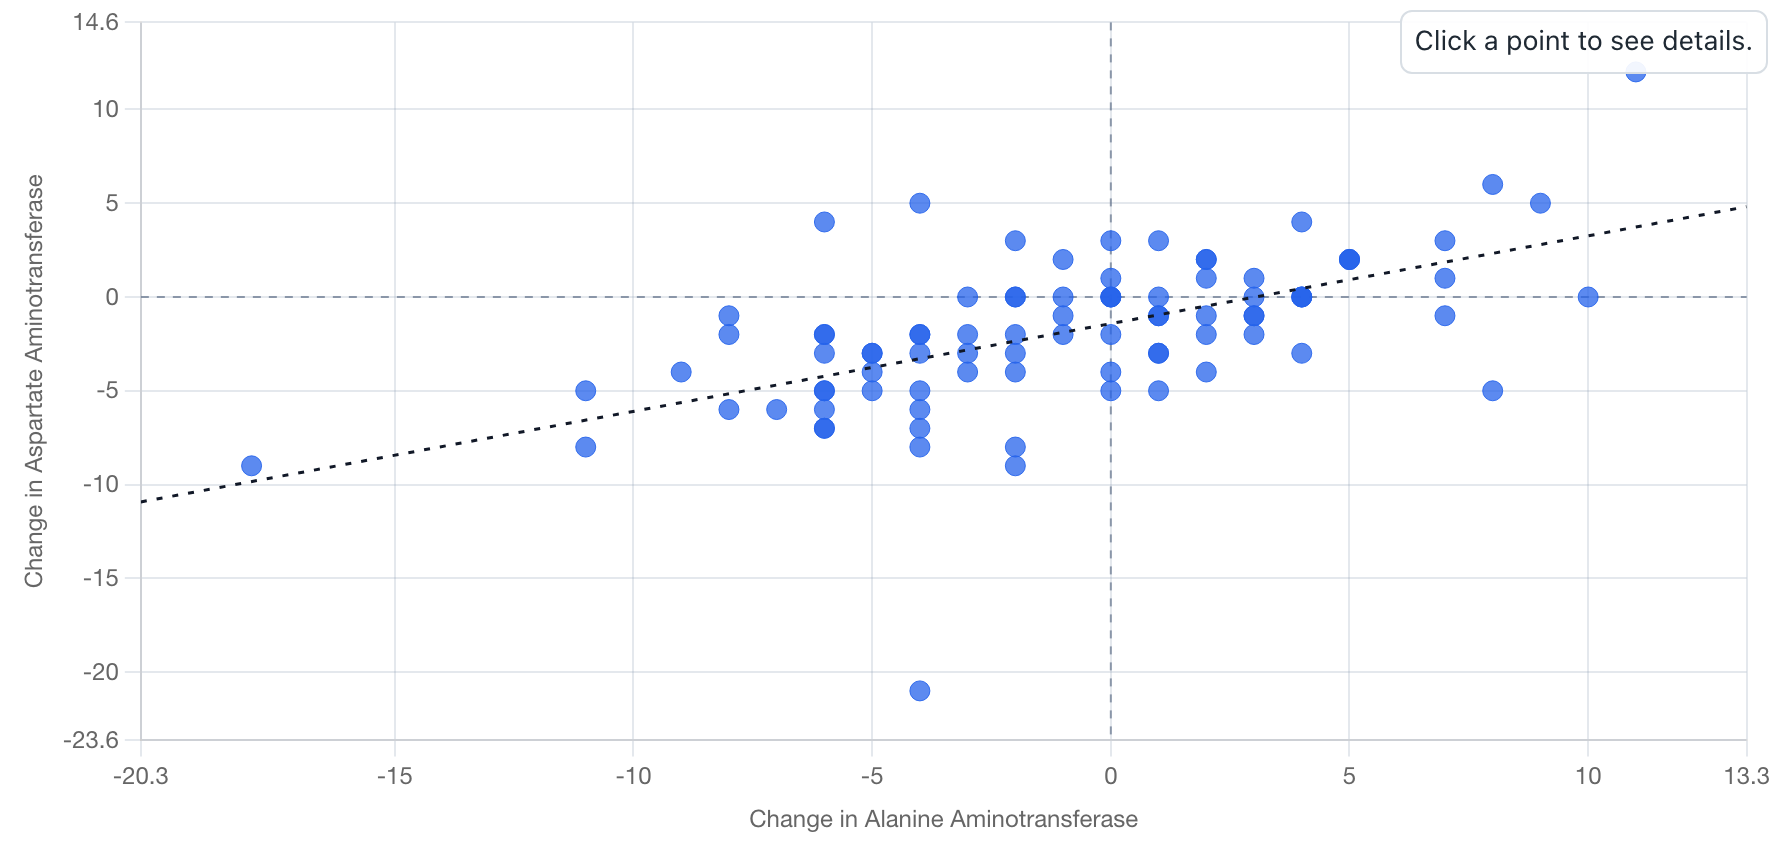
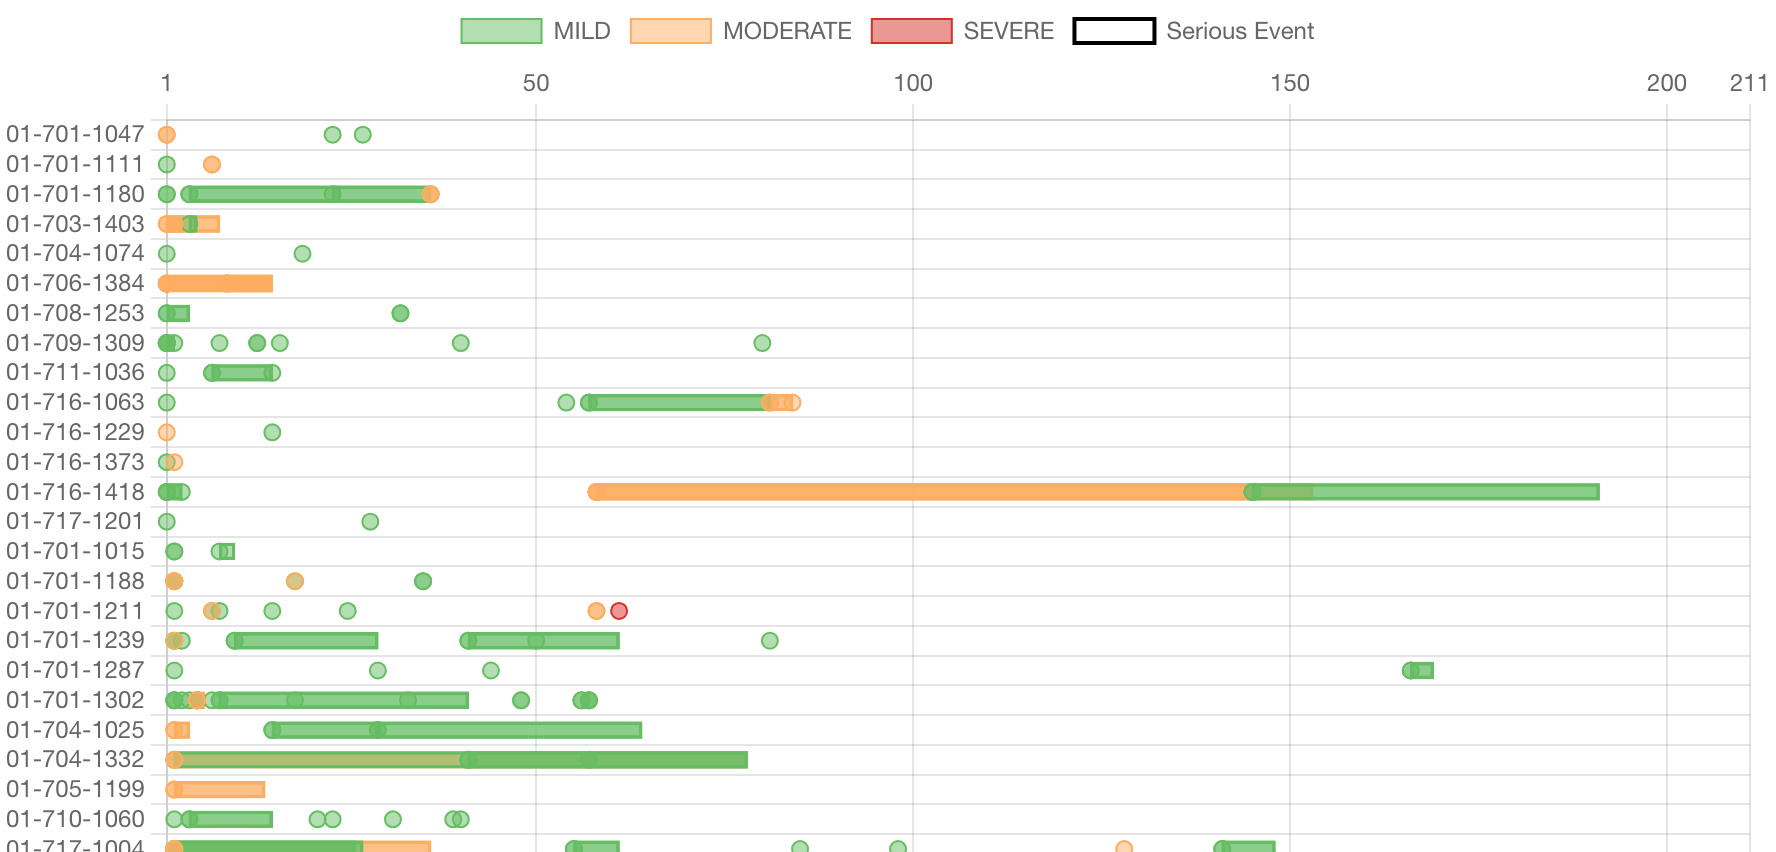
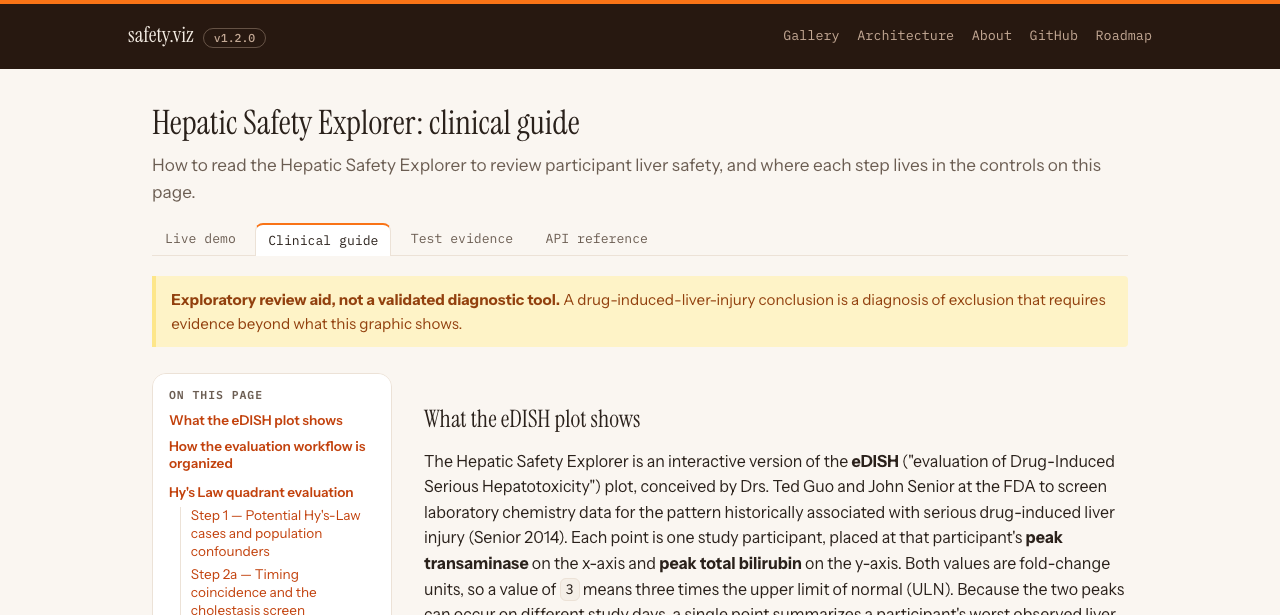
0.1 · Sat 8 am Safety Histogram 1.0 · Sat 10:30 pm Outlier Explorer 1.0 · Sat 10:30 pm Results Over Time 1.0 · Sat 10:30 pm Shift Plot 1.0 · Sat 10:30 pm Delta-Delta 1.0 · Sat 10:30 pm AE Timelines 1.2 · Sun 10 pm Hepatic Explorer 1.2 · Sun 10 pm Its clinical guide
What worked
Porting old code
👍
Saturday: now do the rest One chart to six in a day, hepatic on Sunday A billion tokens, during the World Cup 3 developers × 6 months → one weekend Good at porting old code
That’s when things opened up. I finished the first renderer from the OpenClaw days in another week or two: a modern JavaScript library for the safety histogram, on Chart.js, with a test framework and evidence, using the same tools we use for OpenRBQM. I looked closely at how it was built to make sure it followed the best practices we’d set.
I was happy with it, so one Saturday morning I prompted: we did the first one together, now you the rest. By that night I’d gone from one working renderer to six, and by Sunday night the hepatic explorer too, with Jim’s workflow document turned into a clinical guide on the website. There’s test evidence for every one, with screenshots next to the test code. It used a billion tokens, and I was mostly watching the World Cup and saying: yes, do that, do the next thing.
I’d have expected that to take a team of three developers about six months without AI. I did it in a weekend. To be fair, this was old working code, with good documentation of what we wanted. AI is really good at porting old code. More in diary #5 and diary #6 .
obot v3 · what I built next · 17 July
Papers → prompts → prototypes
Hepatic composite view · from a 2024 paper
QT explorer · from a clinical workflow
What worked
Translating research into software
👍
Jim: have a look FDA paper: build figure 3 Hours later: the composite view QT explorer: another night Not qualified, but passes the sniff test
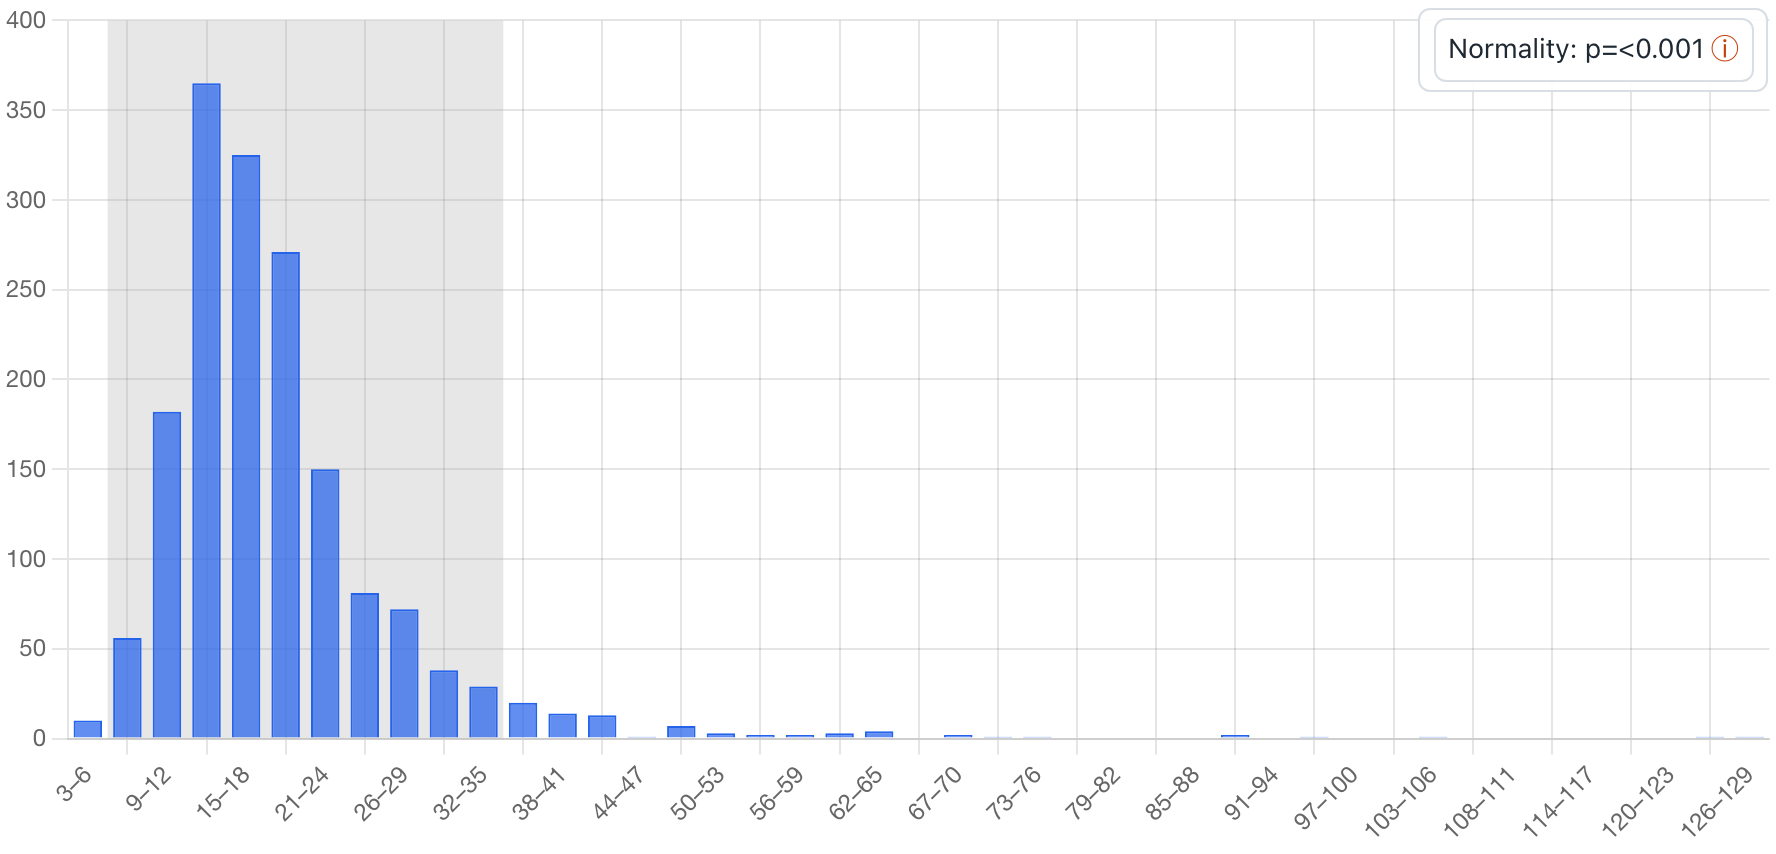
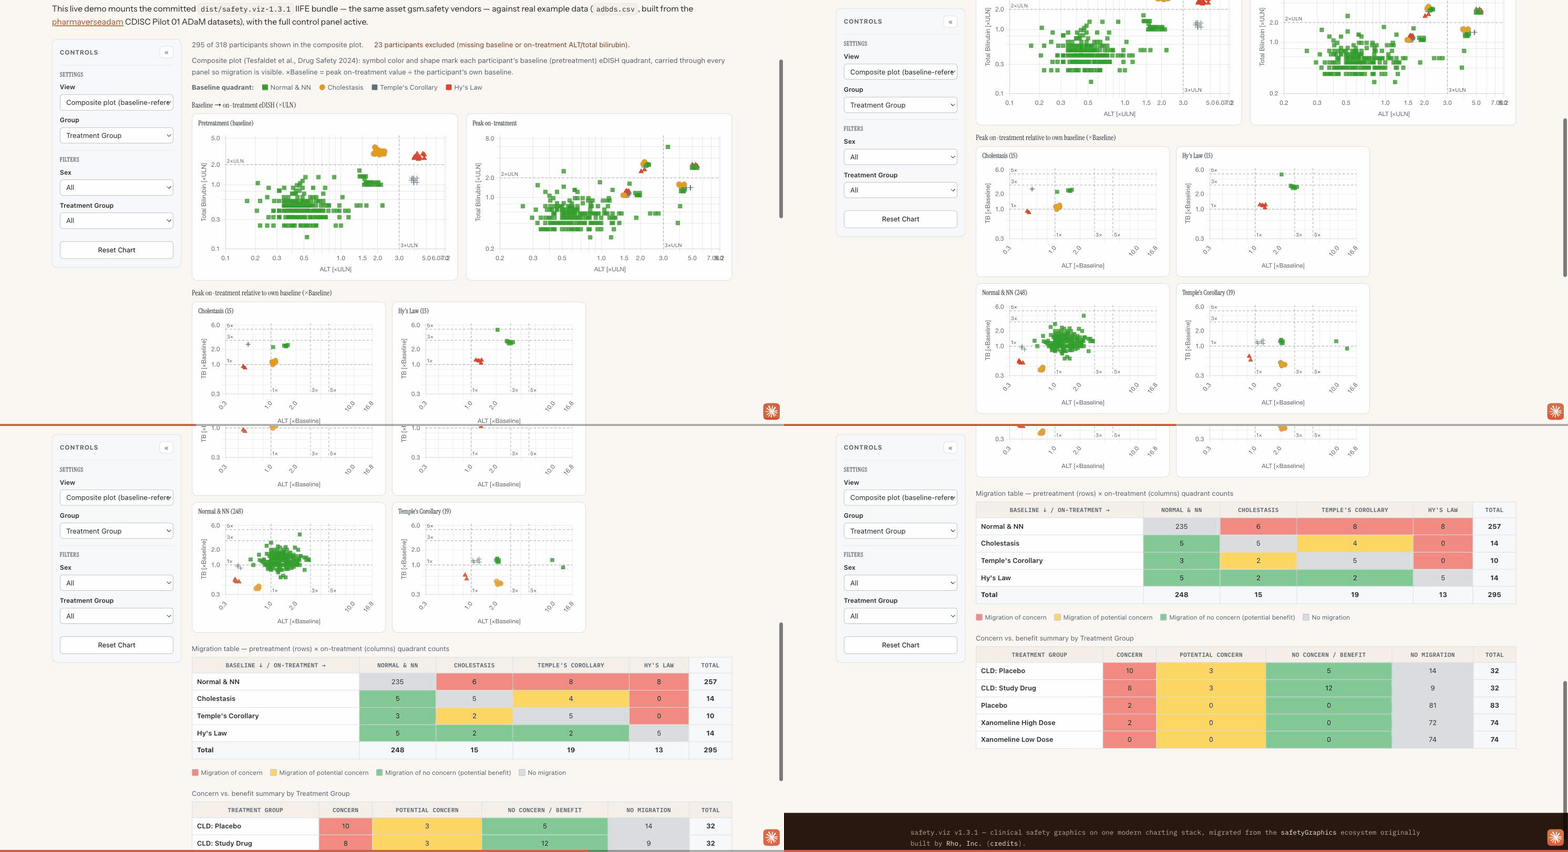
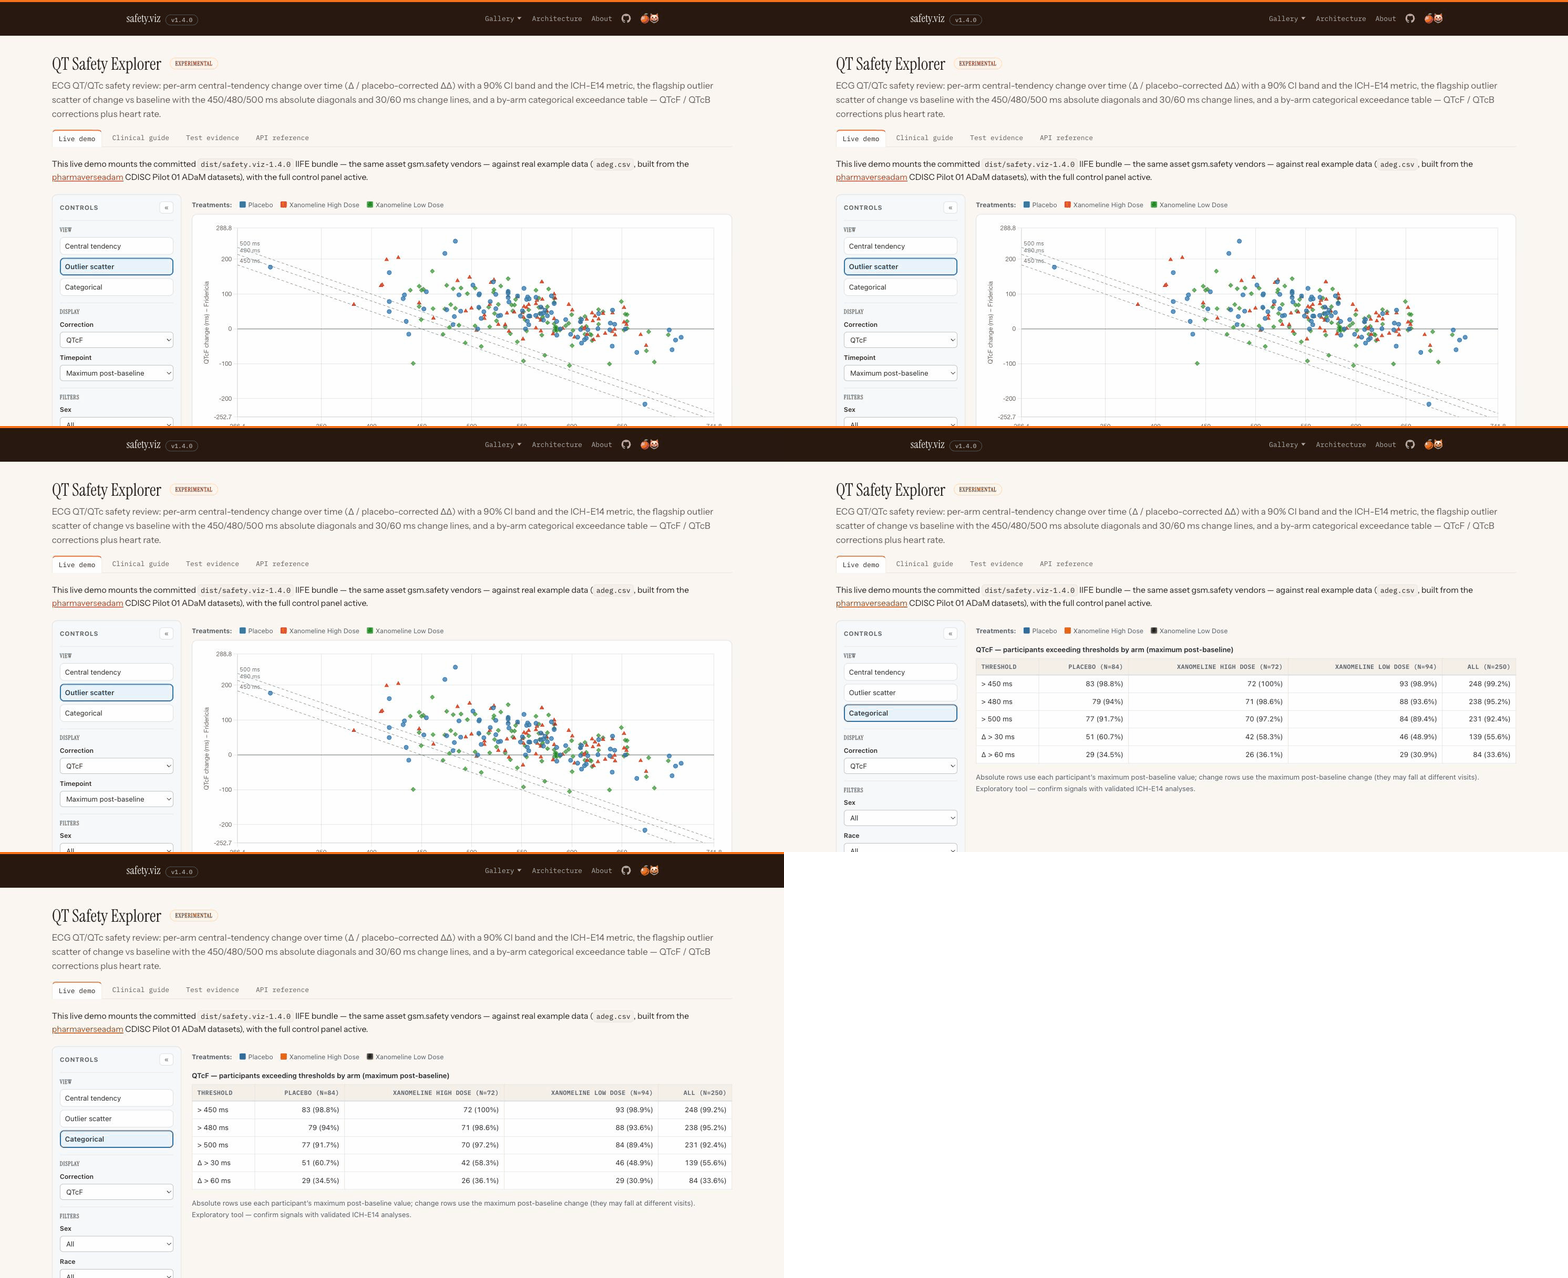
Then I sent it to Jim Buchanan, SafetyGraphics’ clinical lead. We hadn’t worked on it in a couple of years, and he was excited; he’s an amazing advocate for this work. He sent me a couple of papers from colleagues at FDA, including a newer one that changes how the eDISH analysis works. It had some cool new figures, so I asked obot: take a look at this paper; can you build figure 3? A few hours later we had this composite view, a new way of analyzing liver toxicity, working, with a clinical workflow. Then the QT explorer, which we’d worked on but never taken to production: modernize that old repo. Done, another night.
Translating research into software like that blew my mind, with tests and quality documentation too. It’s not qualified; nobody has gone through those steps. But it passes the sniff test from people who’ve spent a lot of time with these charts. This wasn’t something I had time to do, or funding to do. This new technology made it possible. The full story is in diary #7 .
Levels of AI usage
5 The dark software factory 4 The engineering team 3 The developer 2 The junior developer 1 The coding intern 0 Spicy autocomplete
obot v4 · August to 10 September
The organisation
What is it? Claude Code on Opus 5, with four standing roles and a timer script, built to run without me
What changed I asked how far it could get without me in the loop at all.
Got greedy: what do you need me for? Tiptoeing to the dark factory
Coming off that success, I got a bit greedy. OK, Obot, If you can take a paper and make charts, what do you need me for? There was all this talk of loop engineering, so I started tiptoeing from the engineering team, where I set the direction and review the output, towards the dark software factory: I tell it what to do, and I don’t look at the code.
obot v4 · what I built
Four roles, and a timer script
Jeremy sets strategy, decides
Concierge answers, never builds
Operating officer asks become requirements
Workers one job each, then gone
Timer script every five minutes
Fleet manager wakes, clears, exits
talks to directs dispatches
watches
clears
launches
Not an agent.
The only part with a clean record.
whaaa? can the concierge orchestrate
A small company of agents Spun my wheels for weeks The OpenClaw days again
So we set up a small company: several agents with different roles, a fleet of workers, an operating officer, a concierge and a fleet manager, plus some scripts. Some nights I had 20 or 30 agents running at a time. I spun my wheels on it for a few weeks. Hacker Orange was right: it was the OpenClaw days again, all configuring and no building. (Diary #8 is obot’s own account of this stretch.)
obot v4 · what it built
The machinery spiraled, then we cut it back
Files in obot.agent, June to October
0 100 200 300 400 500
Jun Jul Aug Sep Oct
v1–v2 v3 v4 v5
0 charts 11 charts 2 charts 7 charts
472 files
80,000 lines
10 September
Cut to 7
obot.agent the playbook
v4 472 files: 27 home-made tools, 115 drafts, 26 skills, 39 scriptsA dashboard, a morning digest, car audio briefings, a spend guard
v5 7 files: the instructions, one skill, a daily standup
obot.roadmap the hub
v4 Scripts went from 4 to 79Audits, decision logs, status pages
v5 Scripts trimmed to 61; reports keep growing, 36 to 810
What v4 actually built: machinery 472 files, 27 home-made tools [press] 10 September: cut to seven files; Hacker Orange: thank goodness The hub kept shipping
Here’s what v4 actually built. obot.agent is the playbook: the agent’s instructions and tools. Through June it was about forty files. In August it climbed to 472, about 80,000 lines: 27 tools it built for itself, a dashboard, a morning digest, even audio briefings for the car. Almost none of it built a chart.
On 10 September we cut it to seven files: the instructions, one skill and a daily standup. The hub, obot.roadmap , went the same way: its scripts were trimmed, and the reports it publishes kept growing, from 36 to more than 800.
Levels of AI usage
5 The dark software factory 4 The engineering teamback, with me driving 3 The developer 2 The junior developer 1 The coding intern 0 Spicy autocomplete
obot v5 · September to October
Back to building
What is it? Claude Code on Opus 5, then 5.5, with a roadmap of GitHub issues: I set the goal, and agents do the rest
What changed On 10 September I shut v4 down. 468 files of scaffolding went; seven stayed.
September: shut v4 down 468 files gone, seven kept Back to building: I set the goal, agents do the rest
In September I shut the dark factory down: 468 files of scaffolding went, and seven stayed. Maybe it was me; I don’t know the best way to do that yet, and maybe it’s coming. But for now I don’t recommend going that route. Even in your experiments, I’d focus on something you want to build, and then build it.
So I went back to Claude Code with one change. I set the goal and review the release, and the agents do everything in between.
Levels of AI usage
5 The dark software factory 4 The engineering team 3 The developer 2 The junior developer 1 The coding intern 0 Spicy autocomplete
obot v5 · how it works
Same workflow, but I just set goals, answer questions and review releases
Design
Set the goal
Gather requirements
Write the work item
Draft the technical plan
Review the plan, then prompt
Build
Write the tests
Review the tests
Implement
Draft the change summary
Check code quality
Approve
Publish
Automated gates
Quality documentation
Draft the documentation updates
Finalize and release
Publish
I set goals and review releases Agents do everything else Ask me questions, multiple choice
This time the deal was: I set the goals and review releases, and the agent does everything else. Gather requirements, build everything, draft the pull requests, merge to dev whenever it wants. Merges to main, for actual releases, I review. I wanted a demo for everything it built, and solid release notes, and I built skills and an AGENTS.md with Claude to say exactly what I wanted.
And: ask me questions whenever you’re stuck. Multiple choice when you can; if it’s a big question, make an artifact. That’s how I’ve worked for the last month, and it’s been remarkably productive.
obot v5 · the roadmap
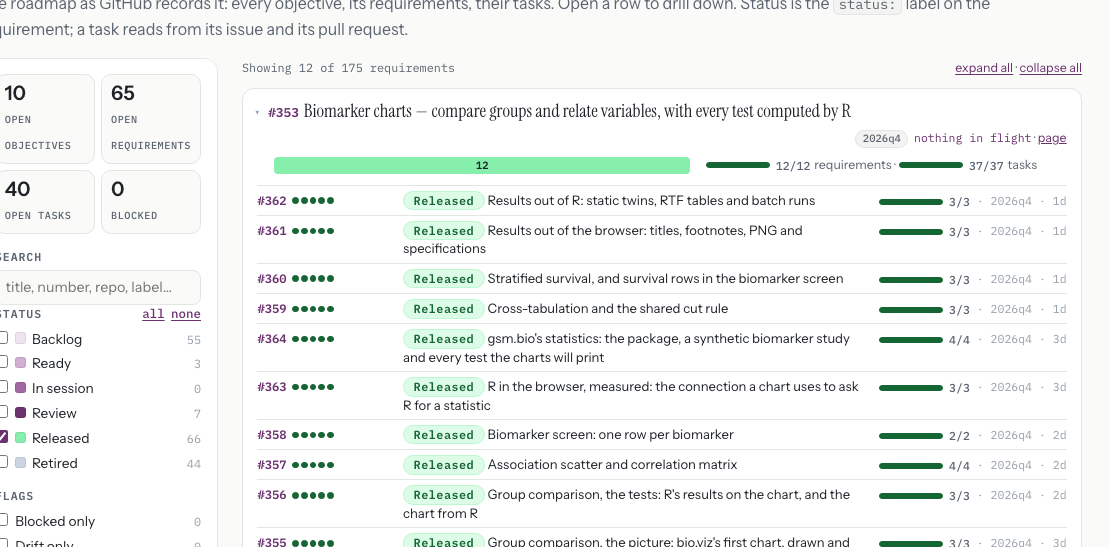
Objectives → Requirements → Tasks
jwildfire.github.io/obot.roadmap
Objectives 13
Chart coverage 10/36 Portfolio view 1/5 Static parity 0/2 Data loading and mapping 1/5 A local-only desktop tool 0/3 Program operations 0/3 Biomarker charts 16 /17 RBQM in the browser 3/12 A demo app ready to show 7/7 A fast check 1/2 R/Pharma keynote deck 0/3 Autonomy in obot.agent 28/34 open.csr 0/5
Requirements 17 16 of 17 done
Tasks 61 60 of 61 done
R in the browser, measured
gsm.bio's statistics
Group comparison, the picture
Group comparison, the tests
Association scatter, correlation matrix
safety.viz's shared parts, opened up
Biomarker screen
The demo app hosts the charts
Cross-tabulation and the cut rule
Stratified survival
Results out of the browser
Results out of R
bio.viz's site, styled as safety.viz's
Group comparison over time
An R app for the biomarker charts
The biomarker app as a web app
The difference grid, a second view
Releases · bio.viz and gsm.bio
Fri 2 Sat 3 Sun 4 Mon 5 Tue 6 Wed 7 Thu 8 Fri 9
One weekend, 2–4 October
obot.roadmap · GitHub releases · 18 Oct 2026
Objectives: every goal at once [press] Requirements: one goal, biomarker charts [press] Tasks: each with a definition of done [press] Watch it fill in, 2 to 9 October
The whole roadmap lives in GitHub issues, on the obot.roadmap hub . Here’s every goal at once. Every goal becomes requirements (this is one goal, the biomarker charts), and every requirement becomes tasks, each with a definition of done. The last panel shows how it filled in, 2 to 9 October. The agents filed most of this, and I signed off on the goals. Getting that clear definition of done worked really well.
obot v5 · what I built · 2–4 October
One orchestrator, one brief, one weekend
In: one brief of about 800 words · about 22 messages from me · Claude Code, as shipped
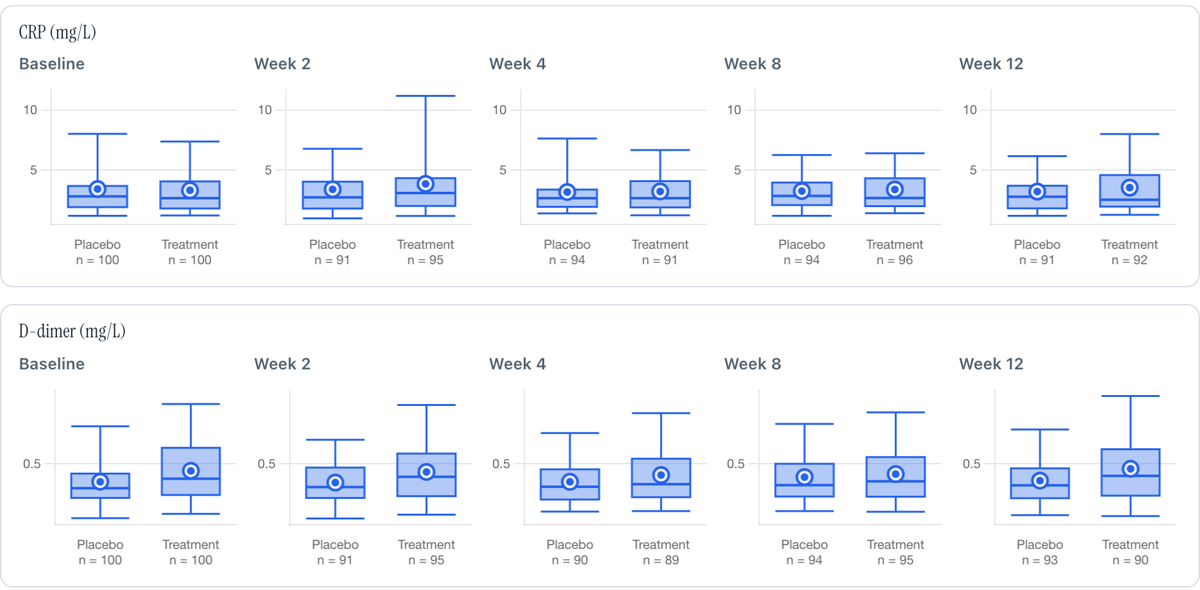
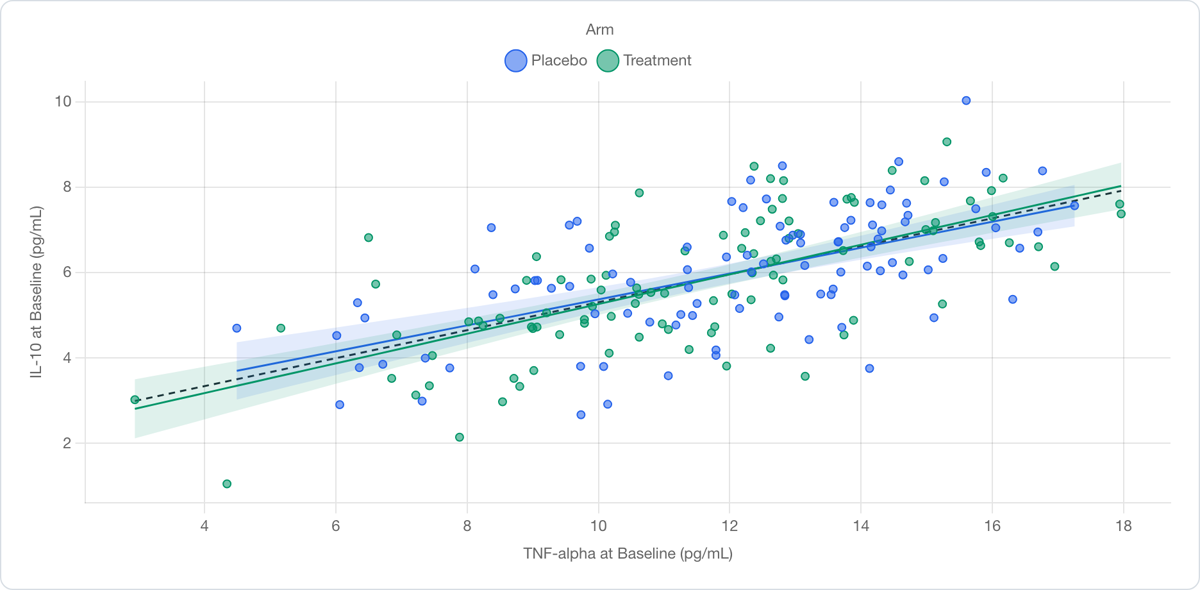
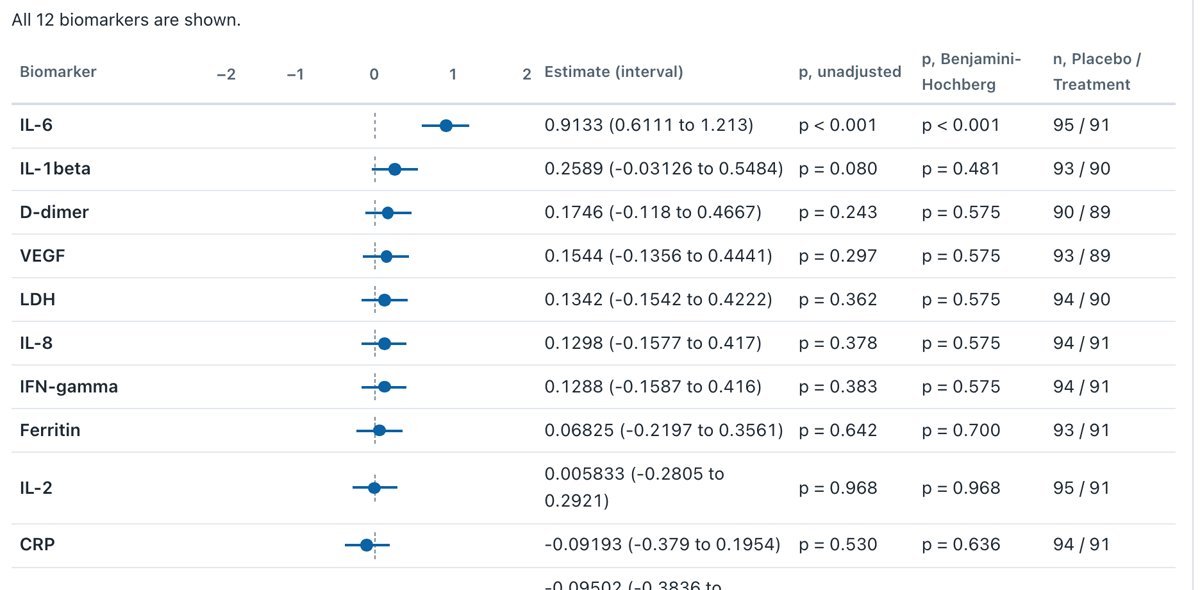
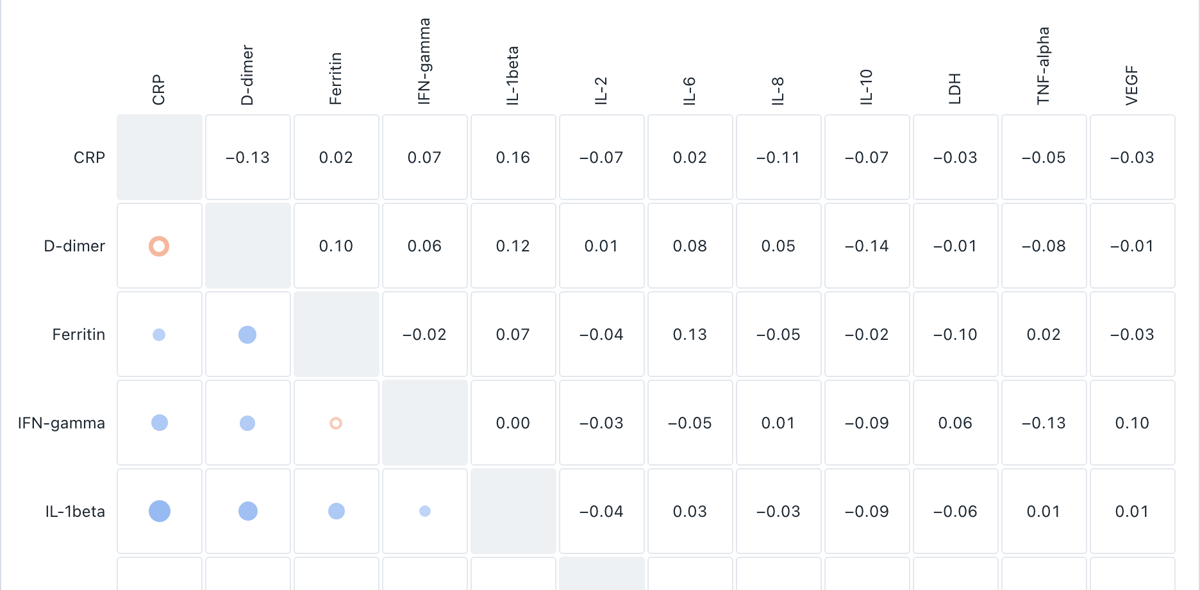
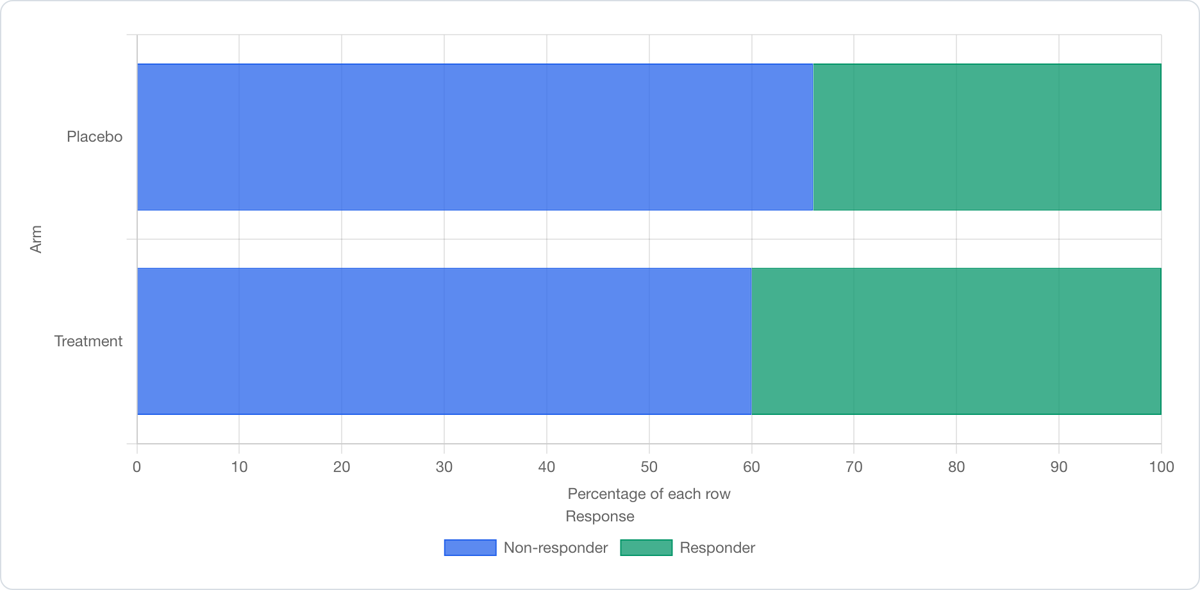
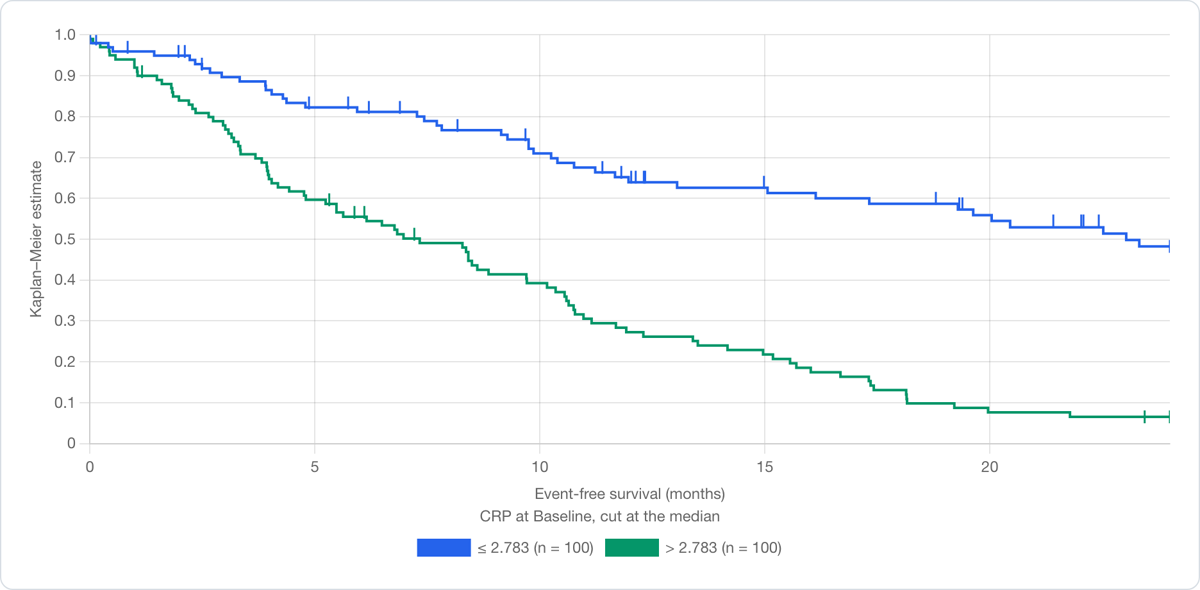
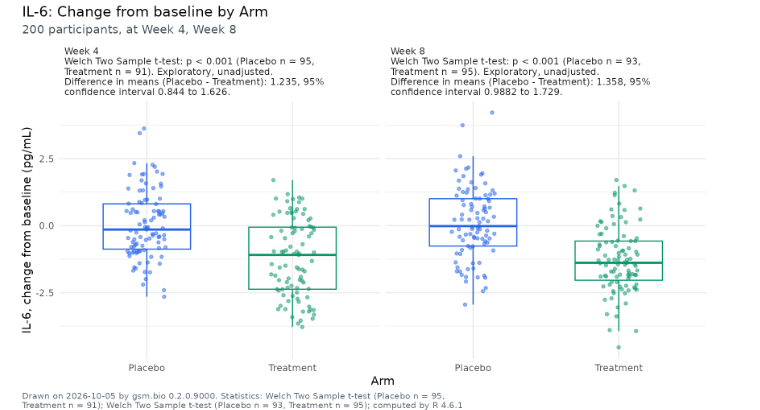
bio.viz Group comparison bio.viz Association scatter bio.viz Biomarker screen bio.viz Correlation matrix bio.viz Cross-tabulation bio.viz Stratified survival gsm.bio The same charts, from R the hub 12 of 12 requirements filed that weekend
What worked
Reviewing its own work
👍
Opus 5.5: the best model I've worked with One goal, one 800-word brief 22 messages, 52 agents, 3.9B tokens Six releases: biomarker charts in JS and R I steered; it did the work
Then Opus 5.5 came out, the best model I’ve worked with. I think we’re in the middle of another jump in capabilities: it’s cheaper, and it’s really good at orchestration. I ask it to work on a goal, and it works through the requirements and issues for hours on its own, occasionally asking me questions or making draft decisions for me to confirm later. In the end, it hands me release candidates.
I gave it the biomarker goal and an 800-word brief. Over one weekend: 22 messages from me, 52 agents, 40 of them reviewers, 3.9 billion tokens, and six releases. A full biomarker suite in JavaScript and R, with R running in the browser. I steered; it did the work.
The payoff · in numbers
What we built
Clinical Trial Tools
20
Interactive charts 14 for safety, 6 for biomarkers
7
Clinical guides About 19,000 words on how to read a chart
3
Apps The safety.viz demo, the gsm.bio app, open.csr
Technical
599
Pull requests merged 341 on charts and apps, 253 on the scaffold
43
Releases 31 of charts and apps, 17 of them safety.viz
345,000
Lines of source 43% of them are tests
5,500
Tests 2,963 of them in safety.viz
20 charts, 3 apps, 7 clinical guides About 600 pull requests One person, nights and weekends
From May to October, Obot and I built 20 interactive charts, 3 apps and 7 clinical guides. Some new, some from papers, some from the old SafetyGraphics work. About 600 pull requests. This was nights and weekends, maybe 8 hours a week (I didn’t keep track), alongside my day job. One person, in their spare time, with a $200 a month plan.
The payoff · what I built
The safety.viz demo: safetyGraphics ❤️ OpenRBQM
Try it
Your files, nothing uploaded R in the browser Play with it, file issues, fork it
Here’s the demo . You load your own files, and nothing is uploaded. It works out how your data maps to what the charts need, and lets you tweak it. R launches in the browser (I’d never done that before; the agents figured it out), and you get the RBQM components, the new biomarker charts and all the SafetyGraphics work, old and new, in one place.
Please play with it and file issues, and maybe I’ll let Claude get to work on them. Or fork it; it’s all open source.
Costs
At least $11,750 at API prices. I paid $200 a month.
$6,000
$4,000
$2,000
obot v3, July: $3,329.60 on 14 days with usage
$3,330
obot v4, 1 to 19 August: $3,830.50, recorded in full
obot v4, 20 August to 10 September: at least $2,189.76. A floor.
$6,020 or more
obot v5, 1 to 6 October: $1,954.96, recorded
obot v5, 11 to 30 September: at least $451.72, on three days. A floor.
$2,410 or more
v3 July
v4 Aug to 10 Sep
v5 11 Sep to 6 Oct
A floor: most of those session logs were deleted before they were read
What I paid
$200 a month
One Claude Max plan, with a weekly limit
Per million tokens
$0.97 → $0.41
July against October, mostly the price cut
Two long weekends
July: 1.0B tokens for $1,273October: 3.9B tokens for $1,639
A floor: no June, most of September missing, and the July weekend about $1,100 short.
$200 a month; about $12,000 at API prices Cheap next to building without AI
All told, I paid $200 a month for the Claude Max plan. At API prices this would have cost at least $11,750 in tokens; the record has holes, so the real figure is higher (the numbers ). That’s a lot of money, but not compared to what it would have cost to build without AI. Claude isn’t the cheapest option, but the Max plan is a pretty decent deal.
SDLC · quality
A lot of tests, and still an experiment
Agents test
2,963
tests in safety.viz, up from 343 in July.
Agents review
40 of 52
agents on the October weekend were reviewers. One caught a bad p-value.
A person signs
Not yet
Nothing here has had a formal review.
Tests and reviews are cheap now. The signature is not.
What evidence do you have?
Lots of tests. No sign-off.
About 3,000 tests, agent review on every PR No sign-off: not qualified
For Inspector Orange: about 3,000 tests written along the way, and agents reviewed everything; every PR in the last few months had several layers of review. I reviewed and approved every release.
But no sign-off. This is not qualified; let’s be very clear. It’s an experiment, and I did it more to understand how agents work than to build a production platform. Don’t use it on your actual study, and if you do, validate anything you find.
Orange, with a question
What we learned
What can we do today?
What can we do today? What's next? Is it a good thing?
Okay, wrapping up. What can we do today, what’s next, and how do we feel about all this? It’s a lot.
The question, one last time
What can we actually do with AI agents right now?
Real work across the development pipeline.
Agents write code.
Packages, tests, config
Humans own the decisions.
Strategy, architecture, judgement
Real work across the pipeline Agents write code Humans own the decisions
So what can we actually do with AI agents right now? Real work across the development pipeline. It’s a lot: most of the coding work. I didn’t have much luck at having Agents make strategic decisions or prioritizing, though I suspect they will improve quickly. Agents write the code, humans own the decisions, and that works great today. We’ll use them more and more as they mature.
The gap
Don't judge AI by what you can do on a trial.
Illustration, not data
Frontier capabilities
Clinical trial tools
What you see
at work
What you're
not seeing
A year ago
Today
The rules at work are right. They also show you a fraction of what these tools can do.
Don't judge AI by what you can do on a trial The rules at work are right They show a fraction of what's possible
Here’s what I’d say: don’t judge AI by what you can do in your day job, on a trial. The gap between the tools that are ready for use on a trial, with extensive human oversight, and the tools at the frontier is pretty large right now, and it’s growing.
The rules we work by are right. We have to keep people safe, and we have to use tools we trust. But those rules also limit our view of what AI can do.
How fast it is moving
Frontier is moving extremely fast
Nov Dec Jan Feb
Mar Apr May Jun
Jul Aug Sep Oct
2025 2026
24 Nov 2025 Opus 4.5
Jan OpenClaw
7 Apr Mythos
9 Jun Fable 5
9 Jul GPT-5.6
24 Jul Opus 5
1 Sep Fable 5.1
22 Sep Opus 5.5 · GPT-6 Sol/Luna
21 Oct today
v1 early May assistant
v2 May–Jun OpenClaw
v3 Jul Fable 5
v4 Aug–Sep Opus 5
v5 Sep–Oct Opus 5 → 5.5
Did not try
MCP tool protocol, since Nov 2024
Open-weight models Qwen 3.6 Apr, 3.8 Aug
Muse Meta’s personal agent, 8 Sep
Jev TypeSafe’s decision model, 15 Sep
Dots OpenAI’s always-on agents, 29 Sep
an obot version ran on it
another release
Moving extremely fast What I didn't try: MCP, assistants, open weights At work, we're behind
This is all moving extremely fast. I spent four or five months really experimenting, and in that time there were several new innovations. There’s a lot I didn’t try. I didn’t go deep into MCP, though Claude uses it under the hood. I haven’t played with the new personal assistants beyond OpenClaw. No open-weights models, which are getting good, and no decision models, which I think will be really valuable for clinical trials. I couldn’t try everything, and at work we’re behind on all of it. It’s a little disorienting.
How fast it is moving
New ways of working, written up in public.
FDA 6 May · US FDA
Elsa 4.0, with custom agents
…the agency’s internal AI tool available to all FDA staff, from scientific reviewers to investigators.
FDA press release · Elsa 4.0 and a consolidated data platform
23 Sep · Rails World keynote
Done coding by hand
At 37signals, a couple of weeks ago, we made the decision that it clearly means we’re done writing code by hand.
David Heinemeier Hansson, creator of Ruby on Rails · as transcribed in The Pragmatic Engineer , 1 Oct
15 Oct · Claude Code team
Review, moved to machines
We didn’t remove review. But we did move most of the reading to machines…
Addy Osmani, Morgan Westlee Lunt and Qing Wang · How the Claude Code team does code review
From my reading list, and the FDA
FDA: Elsa 4.0, agents for all staff DHH: done coding by hand Claude Code team: review moved to machines Anthropic: agent hours outnumber human hours 6 to 1
Even in the last few weeks there’s been a run of write-ups on how to work with agents. The industry is wrestling with this right now.
I tend to agree with DHH. I don’t think we’re going to be typing for loops anymore. We’ll be helping to design the systems, but coding by hand isn’t the most efficient way to do this anymore. And a year ago, none of this was how things worked.
The gap, a year from now
We're at the beginning.
Illustration, not data · after today, three guesses
Slow
Steady
Fast
Steady
Fast
Exponential
Frontier capabilities
Clinical trial tools
A year ago
Today
A year from now
Nobody can tell you what these tools will do next year. They are not going away.
We're at the beginning Nobody knows next year They're not going away
I really believe we’re at the beginning of this trend, not the end. Nobody can tell you what these tools will be able to do next year. But they’re not going away, and I think they’ll get better. Even if there were never another model release, figuring out how to use what we have now and deploy it across our industry would take several years.
We can think bigger
“I think that most people are underestimating just how radical the upside of AI could be, just as I think most people are underestimating how bad the risks could be.”
Dario Amodei · Machines of Loving Grace · October 2024
Think bigger: Amodei Huge upside, huge risks Grain of salt, then look at the last year
We’re a highly regulated industry, for good reason, and we tend to focus on the risks. But I agree with Dario Amodei in Machines of Loving Grace : most people are underestimating how radical the upside of AI could be, just as they’re underestimating the risks. (We’ve started to wrestle with the risks a little more in recent months.)
What's next
More Medicines Faster
Illustration, not data
Frontier capabilities Clinical trial tools
A year ago
Today
A year from now
Fast
Slow
Fast
Some day?
Today: multiple years and more than $1 billion per drug; 9 in 10 fail [press] Slow: real marginal improvement, but still years [press] Fast: a paradigm change, soon [press] Some day? Months, maybe weeks Say the forecasts (the slide before, moved to the Reserves 20 Oct): Amodei, 50–100 years of biology in 5–10, once powerful AI arrives; Hassabis, the end of disease within reach, maybe within the next decade. Forecasts, not facts Time to close the gap
The gap is measured in medicines. A drug today takes multiple years and more than a billion dollars (Wouters 2020 , DiMasi 2016 ), and about nine in ten candidates fail . The COVID-19 mRNA vaccines took about nine months. With AI, that could be the new normal, and some day maybe faster than that.
Amodei predicts that once powerful AI arrives, AI-enabled biology and medicine could compress 50 to 100 years of progress into 5 to 10 . Demis Hassabis, who runs Google DeepMind, told 60 Minutes that the end of disease could be within reach, maybe within a decade. Take these with a big grain of salt. Then look at the last year. After using this stuff to build what I’ve built, these big forecasts don’t feel as crazy to me as they used to.
Closing the gap between clinical trial tools and the frontier means more medicines, faster. These changes are already starting; the FDA is already reviewing with AI. And we’re the ones who can make this happen. The tools we make set the pace.
Closing the gap
Try it on something that's yours.
1 Pick an agent Claude or Codex, $20 for a month. Others are fine too. 2 Set up GitHub A free account is fine. 3 Pick a development process For R: Hadley Wickham's R Packages book, free at r-pkgs.org . 4 Write a prompt Make me an Open Source R package that does X. Include a working example and user guide in GitHub pages. Follow all of the best practices in Hadley Wickham's R Packages book.
5 Ask questions! Explain how you did X
What are agents good at now?
Teaching me things!
👍
Closing the gap
Or do something fun!
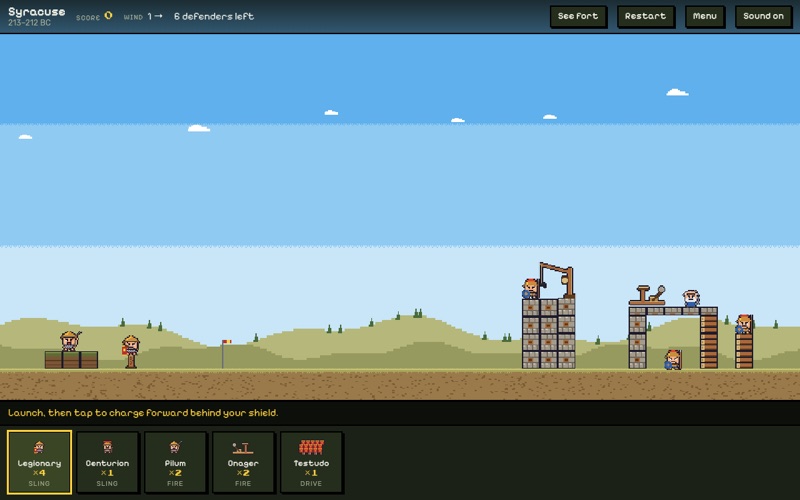
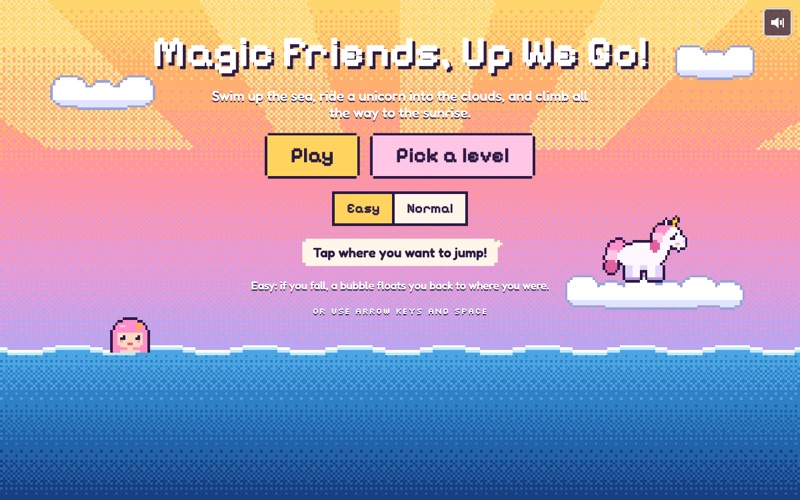
I make games with my kids, using AI. Here are our favorites.
Mixed feelings
Coding feels completely different than it did a year ago.
It's kind of fun, but I'm certainly not working less.
But, what's next?
More medicines, faster!
And no more powerpoint!
Data Centers. Rogue Agents.
100 years of innovation!
Coding feels completely different Fun, but not working less Four Oranges: hope, fear, change, excitement
To be totally honest, I have mixed feelings about all of this. Coding feels completely different than it did a year ago, and so does my job. It’s kind of fun, but I’m certainly not working less, and it hasn’t been less stressful.
So what’s next? Each Orange has a different opinion. Thumbs-up Orange says more medicines, faster, and no more PowerPoint: I made these slides with Claude, all web-based, and all the Orange references were really fun. Thumbs-down Orange sees data centers everywhere, rogue agents, all sorts of scary stuff. Inspector Orange is going to be stressed for a long time: there’s a lot of change now, and more coming. And Hacker Orange, the one I identify with most, is in heaven: 100 years of innovation in the next 10, trials on a chip, robots folding my clothes.
We live in interesting times.
Acknowledgements
Thanks to my amazing co-workers, patient bosses, very patient family and all of my open source collaborators!
Co-workers, bosses, family, collaborators
Thanks to my incredible co-workers, my very patient bosses, my extremely patient family, and everyone I’ve worked with on open-source projects. I hope we get to work together more in the coming years.
jwildfire.github.io/keynote
Credit Simon Willison Thank you!
And here’s our Orange party (click for confetti). It’s a fork of Simon Willison’s Kākāpō Party, and credit to Simon, my favorite AI blogger: I’ve borrowed a bunch of his ideas, this post’s format included. Thank you all for your time.
AI collaboration note : Obot (Claude Code, using Opus 5.5) drafted this post from my speaker notes and the transcripts of two dry runs, keeping my words where it could. It rendered the slide images, recorded the demo videos and built the slides with me. I edited the post line by line from there.

 2020
 2021
 2019
 2019
 2019
 2019
 2020
 2019
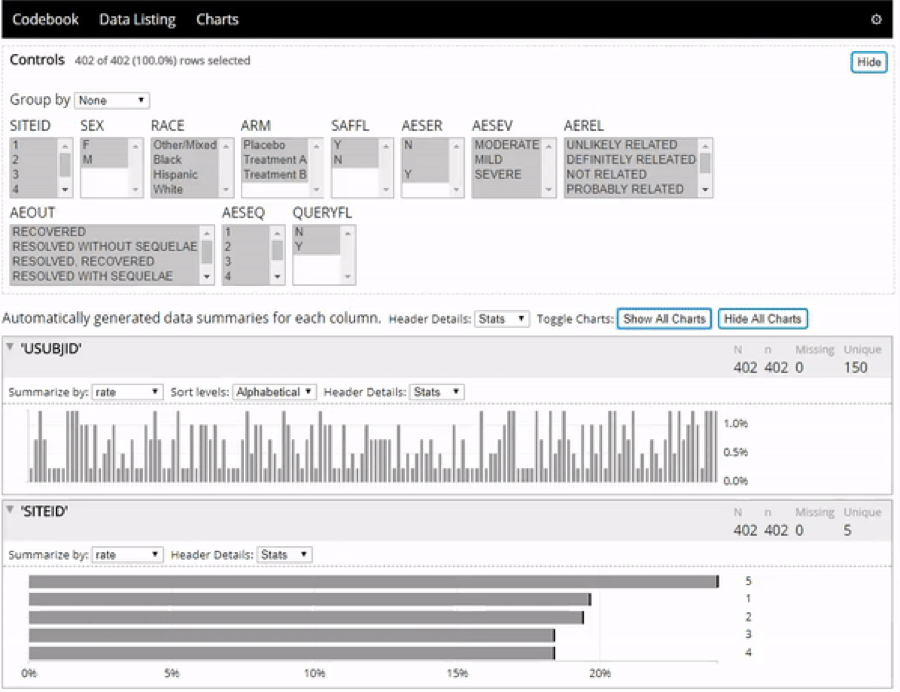 2021
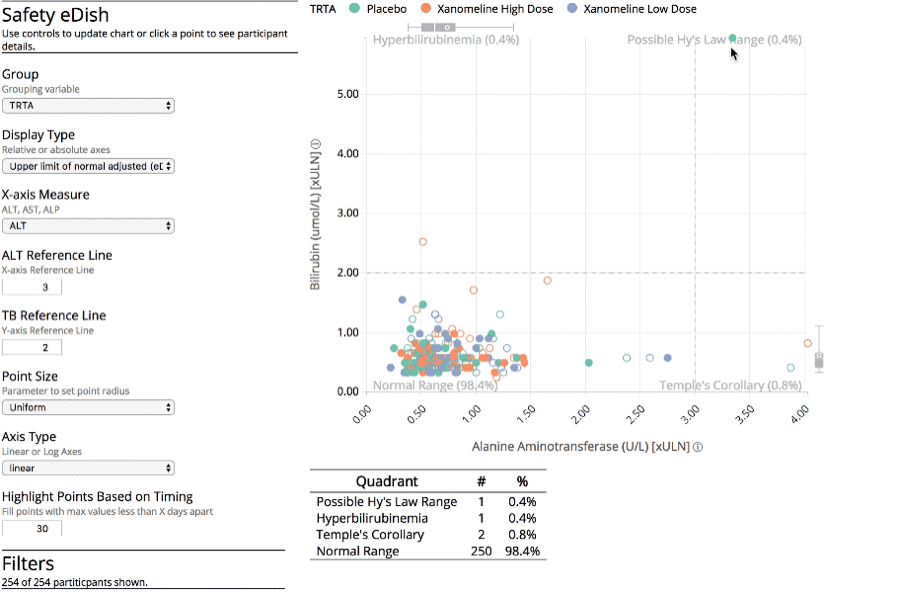 2022
 Orangethe original
 v1a personal assistant
 v2OpenClaw
 v3Fable 5
 v4the organisation
 v5goals, on Opus 5 → 5.5
 0.1 · Sat 8 am
 1.0 · Sat 10:30 pm
 1.0 · Sat 10:30 pm
 1.0 · Sat 10:30 pm
 1.0 · Sat 10:30 pm
 1.0 · Sat 10:30 pm
 1.2 · Sun 10 pm
 1.2 · Sun 10 pm
 bio.viz
 bio.viz
 bio.viz
 bio.viz
 bio.viz
 bio.viz
 gsm.bio
 the hub